Focus: Atlanta
School is out, and summer is officially here. As we approach the midway point of the year, but before Q2 final numbers are in, it’s a good time to have a closer look at individual markets. This time around, we’ll be digging a little deeper into the Atlanta market.
View the full monthly Markets Stats PDF
Average Occupancy and Net Absorption
Average occupancy gain in the Atlanta metro area continues to lag many other large markets. In the 12-month period from May 2017 through May 2018, average occupancy rose around 1.4% to 91.2%. The new construction pipeline is undoubtedly causing this lack of positive momentum. More than 10,000 units have been delivered to the market in the last 24-months after delivering only about 6,800 units in the previous 24-month period.
However, this is far from the whole story. Softening the blow of lackluster average occupancy growth is the fact that only the highest price tier* in the market ended May of 2018 below an average occupancy of 92.5%. Furthermore, those properties at the top of the market gained nearly 10% in occupancy year-over-year to end May at just under 80%. Given many of these are newly delivered, this is a good sign.

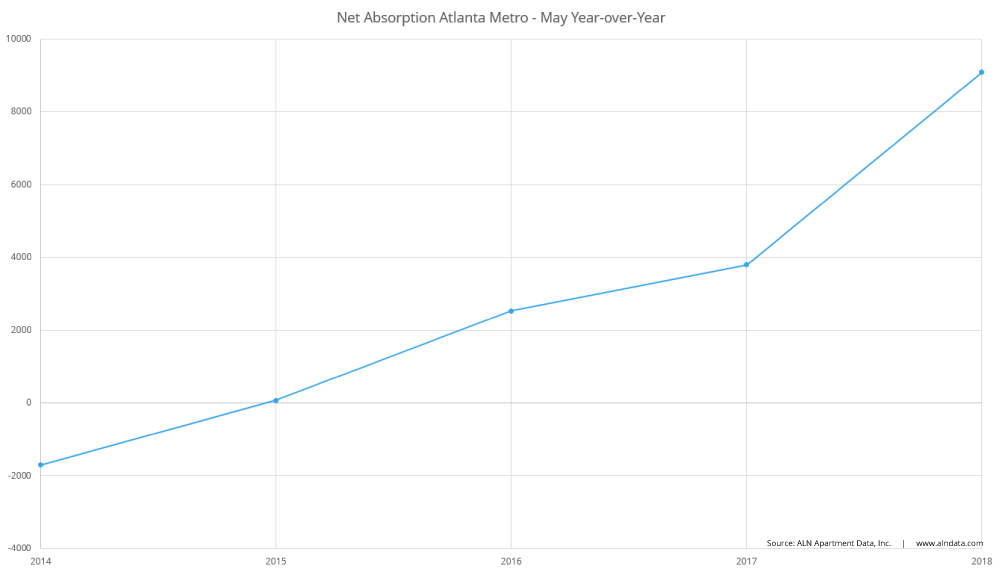
The modest gain in occupancy despite all the new units is thanks to very strong net absorption**. Year-over-year, the Atlanta market absorbed more than 9,000 net units. This is more than triple the number of units from the same period two years ago. As new supply continues to enter the market unabated, these strong increases in net rented units will need to continue to avoid a substantial average occupancy loss.
Sustaining Demand
With the unemployment rate unlikely to fall as much in the next 12-months as it has in the previous 12-months for the area, much of the sustained demand will need to come from the under-18 population aging and moving out on their own, or from population growth via new residents. According to government figures, the Atlanta-Sandy Springs-Roswell metropolitan statistical area has 320,000 residents between ages 15 and 17, and added around 800,000 new residents in the last year.
Those numbers are on par with similarly sized markets, and multifamily owners and operators will be relying on these segments for continued strong performance. Of course job growth and wage growth will need to be strong enough to make the rental units accessible to these demographics.
Average Effective Rent and Concessions in Atlanta
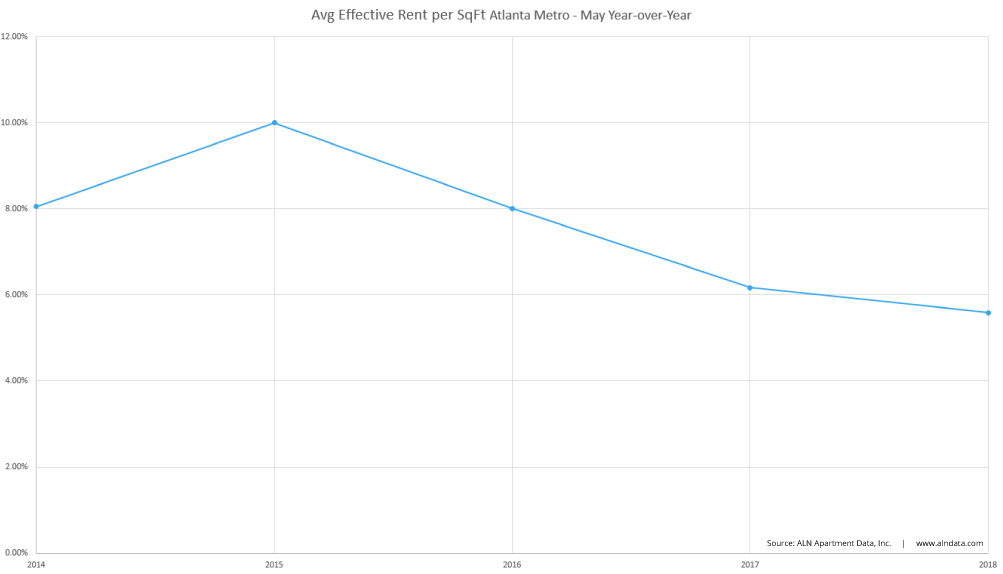
We expect to see average effective rent gains where there is a concentration of new construction activity, and Atlanta has been no exception. Monthly average effective rent has risen $200 per unit since the start of May 2015, and ended May 2018 at about $1169. The smallest gain has been in the top price tier, with rent concessions for new lease-up properties having an impact.
As those new properties push existing ones down into lower price tiers, we really see the pricing impact of new supply. Class B properties gained 3.7% in average effective rent over the last 12-months, and Class C properties realized a 5.5% increase.

The number of properties offering a discount for new leases declined by about 8% during the period. This is another positive sign for the market, because gaudy absorption numbers have been achieved in the last year largely without the help of rent concessions. The value of the average discount package amongst properties that offered one did increase during the period, but much of the increase was within the top price tier.
Takeaways
Like many areas across the country, the effects of the new construction pipeline are apparent. Unlike some markets though, the demand has been strong enough to prevent any slippage in average occupancy. The Atlanta market has not been overly reliant on concession packages to achieve strong net absorption, and average effective rents have shown solid growth. Metrics continue their upward trajectory for the Atlanta market, but any decline in demand for new units will quickly halt that trajectory.
*ALN assigns conventional properties to a price class depending on each property’s average effective rent per square foot percentile within its market
**Net absorption is the net change in rented units
How to Create Amazing Market Surveys
Using ALN OnLine, see how easy is it to create useful and amazing custom market surveys!
Using ALN OnLine, see how easy is it to create useful and amazing custom market surveys!

