

Multifamily First Quarter 2018 Review
Now that the numbers are in for the first quarter of 2018, it’s a good time to look back and assess the multifamily industry’s performance. We’ve been seeing signs of an overloaded construction pipeline for several quarters now, and the story hasn’t changed so far.
In the opening quarter of 2018, the multifamily sector added more than 62,000 conventional units to the market nationally. Absorption outpaced the growth by barely 4,000 units and national average occupancy gained less than a quarter of a percent to 91.7% to end the quarter. Rents grew nearly 1% nationally.
View the full monthly Markets Stats PDF
Interestingly, the spread between average and median effective rent gain narrowed significantly in the first quarter of 2018 compared to the initial quarter of 2017. This shows that the margin between the best and worst performing markets has shrunk. Currently the average apartment unit in a conventional property effectively rents for $1,271 per unit and $1.43 per square foot.
*All numbers referenced below are based on conventional multifamily units in ALN’s 137 markets.
Washington/Oregon
After an unusual rise of more than 5% in the first quarter of 2017, average effective rent in Seattle gained only 1% to $1,672 per unit to open 2018. Portland, currently at $1,327 per unit, had an equal gain for the quarter. Spokane managed to regain positive effective rent growth after declines in 2017, but only to the tune of 0.1%. Average effective monthly rent remains $936. Absorption was strong in this region in the first quarter. Portland nearly quadrupled the number of newly rented units compared to Q1 of 2017, with more than 1,600 additional units rented. Seattle also outpaced last year’s performance with over 1,300 units absorbed in the quarter- more than double the prior year.
In terms of occupancy, Portland fared much better to open the year than Seattle. Portland absorbed more than double the number of delivered units in the quarter, for an occupancy gain of about 0.7% to 93.1%. Meanwhile, Seattle’s strong absorption was not enough to counteract the more than 1,700 delivered units. As a result, average occupancy fell 0.1% to 92%.
California
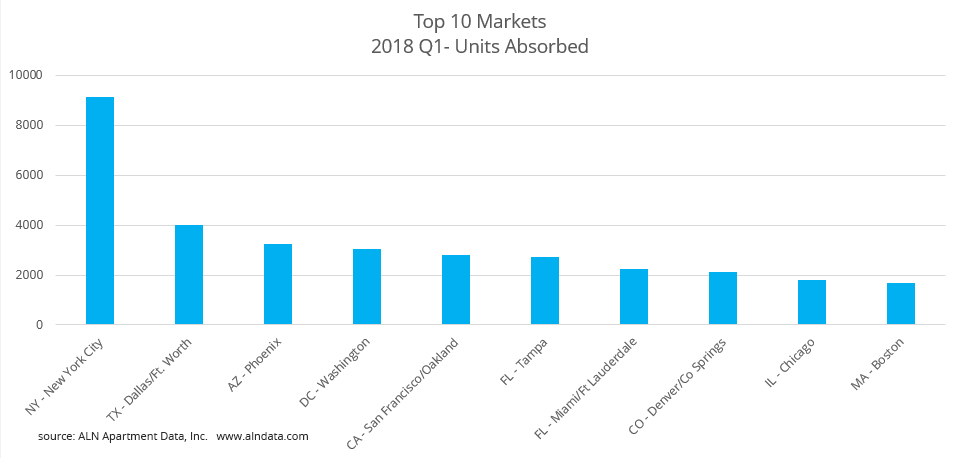
The California markets managed to absorb over 4,700 net conventional units in the first quarter. Most of the units were within two markets: The Bay Area and the greater Los Angeles area. However, San Diego wasn’t far behind, with over 700 additional units rented.
The Bay Area absorbed more than 2,800 units and the Los Angeles metro area gained just under 1,000 net rented units. However, new construction continued unabated throughout the year and while occupancy is up 1.2% for the year in the Bay Area average occupancy only grew 0.1% in the 4th quarter. Los Angeles experienced much the same situation. The market added over 11,000 net rented units in 2017 with just under 4,000 of those units absorbed in Q4 2017.
Average occupancy remained flat in the quarter, with the Bay Area the only market to move more than half of a percent in either direction. Even that gain was a modest 0.6%. Leading the way in rent gains were the Central Coast and Bay Area markets, with gains just under, and just above, 2% respectively. Rents rose across the state, with the 1% gain in San Joaquin Valley representing the minimum.
Arizona/Nevada/New Mexico
It wasn’t all good news for the major desert region markets regarding rents. The nearly 2% decline in average effective rent in Flagstaff was in the bottom 20 markets of the nation for effective rent gain. On the other end of the spectrum, both Phoenix and Reno gained around 2%- both good for top 20 markets in the nation. Most of the 4,600 units absorbed by this region in the quarter were in Phoenix- with over 3,200 units. Even with the delivery of over 1,700 units, average occupancy rose as a result by 0.65% to about 92.2%.
Las Vegas and Reno both had solid absorption numbers, but the more than 800 absorbed units in Las Vegas was not enough to offset the 1,000 new units delivered in the first quarter. Average occupancy dropped a little more than 0.1% to 92.3% as a result. The good news for all these markets is that average occupancy is still healthy in the 92-95% range.
Idaho/Utah/Montana/Wyoming/Colorado
The Denver-Colorado Springs area added more than 2,000 units to the market and absorbed more than 2,100 units to bring average occupancy up 0.1% for the quarter to 90.5%. Salt Lake City also absorbed less than 100 more units than were added in the quarter, for an average occupancy gain of 0.2% to 92.8%. Wyoming added over 400 rented units in the quarter, and none were delivered in that span. The result was a 6% increase in average occupancy to 88.7%. Montana had basically flat absorption in in the quarter. Both Denver and Salt Lake City saw effective rents rise about 0.8% for the quarter, while Boise and Wyoming both rose more than 1%.
North Dakota/South Dakota/Nebraska/Iowa/Kansas
Des Moines absorbed about 550 units in the quarter, followed by Omaha at just over 100 units and Bismarck and Sioux Falls at 100 units each. These four markets accounted for nearly all the absorption in these five states, but Des Moines and Omaha both failed to absorb more than the number of units delivered. As a result, average occupancy fell 0.3% to 89.4% in Des Moines, and Omaha fell 0.1% to 91.9%. On the other hand, Bismarck and Sioux Falls both saw no new units delivered, and led the way in this region with average occupancy gains of 1.3% and 1% respectively.
Des Moines, Lincoln and Sioux Falls all realized average effective rent gains of about 1.3% in the quarter. Omaha and Rapid City both saw gains under 1%, while Wichita and Fargo each suffered average rent losses of 0.27% and 0.55% respectively.
Oklahoma/Louisiana/Arkansas/Missouri
Little Rock gained more than 300 newly rented units while adding no new construction units in the quarter, and the Northwest Arkansas region absorbed nearly 200 units, but delivered more than 400. Average occupancy rose in Little Rock by 0.8%, mostly because the new units were delivered elsewhere in the state. This resulted in a decrease of 0.7% in average occupancy in the Northwest Arkansas region.
Louisiana had negative absorption for the quarter, fueled almost entirely by losses in Baton Rouge and New Orleans. These two markets lost a combined 360 net rented units. Contributing to this decline was the fact that over 1,000 new units were added to those markets during the quarter. Even with no new units delivered, Monroe had negative net absorption for the quarter by nearly 100 units. Lake Charles stands as the only market in the state to see an average occupancy gain- at 2.2%. for an average occupancy of 88.5%.
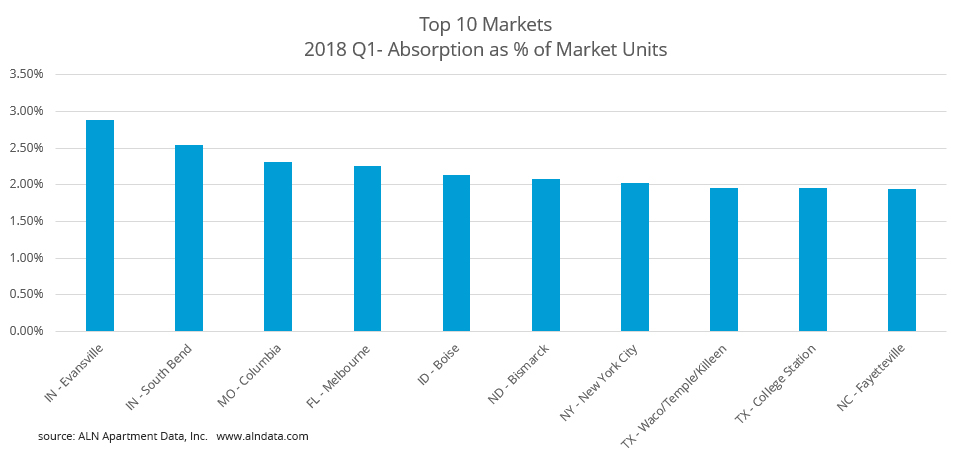
Missouri fared better, though not much. Kansas City added over 1,400 units and absorbed just under 1,500. St. Louis added just under 349 units and lost nearly 400 net rented units. Columbia saw average occupancy climb more than 2.5%, good enough for top 20 in the nation. Oklahoma City had a decline in net rented units of about 50, resulting in essentially flat average occupancy.
For the most part, rents that stood out in this region did so for the wrong reasons. Average effective rents declined in most of Louisiana and in both Oklahoma markets. The 2.3% decline in Monroe put it in the bottom 20 markets nationally. The Northwest Arkansas region, and the St. Louis metro area were the only markets in this region to have gains in excess of 1%- albeit it barely.
Texas
The Dallas/Fort Worth and Houston metroplexes accounted for 60% of the units absorbed in the state for the opening quarter of 2018, and both were in the top 20 of the nation. Dallas/Ft. Worth maintained a flat average occupancy of just under 91% for the year even as nearly 3,900 new units were introduced. Houston added only about 800 new units and ended the first quarter just under 90% occupied. Austin and San Antonio each absorbed just over 900 units during the quarter, with average occupancy ending at 89.7% and 88.7% respectively.
Many of the secondary and tertiary markets like Amarillo, Longview-Tyler, San Angelo and Victoria lost ground from an absorption perspective, and average occupancy declined in many of the small markets by 0.3-0.7%. Effective rent performance was mixed, with four Texas markets landing in the top 20 markets nationally, and three landing in the bottom 20. On the positive end, Abilene and Lufkin both surpassed 4% average effective rent growth in Q1, and Midland-Odessa topped 5%. On the low end, Amarillo and Corpus Christi declined just over 1% each.
Minnesota/Wisconsin/Illinois
Most major markets in this region displayed signs of overbuild in 2017. The deliveries have slowed, but some markets are still under pressure. Chicago absorbed nearly 1,800 units while net units rose by more almost 1,500. Similarly, Madison added more than 400 net rented units, but delivered nearly 300. Milwaukee absorbed almost 700 units and delivered under 300. The Springfield and Green Bay markets were the only two in this region where average occupancy moved by more than 1%- unfortunately both declined nearly 1.5%. The good news is average effective rents did not suffer similar declines for these markets. In fact, Springfield and Minneapolis-St. Paul experienced gains of 2.3% and 1.5% respectively. Chicago and Moline each came in just a hair under a 1% gain, and the 0.15% decline in Peoria was the only loss.
Michigan/Ohio/Indiana
Of the nine markets in this region to deliver units in Q1, only Columbus managed to absorb more units than were delivered. The result was average occupancy declines in Indianapolis. Detroit, Grand Rapids-Kalamazoo and Toledo. The silver lining is that Grand Rapids-Kalamazoo at -0.59%, and Toledo at 0.57%, were the only markets to lose more than 0.5% in average occupancy.
The pipeline deliveries were largest in Cincinnati-Dayton and Cleveland-Akron, with nearly 800 units, and just over 750 units respectively. Neither market matched those figures in absorption, but the shortfall was smaller in Cleveland-Akron. Due to the lack of new units, the largest average occupancy gain was in the South Bend market, with a nearly 3% rise to over 94%. The only other market in this region to reach 1% occupancy gain was Fort Wayne at 1% exactly, thanks to no new supply in the quarter.
Effective rent per unit growth was positive across the board in the quarter, with Evansville leading the way at 3%. South Bend and Cleveland-Akron both met 1.5% growth, and Detroit checked in last with a gain of 0.5%. The 0.8% gain in the Toledo market was enough to push average effective rent per unit above the $700 threshold to end the quarter, ending at $703 per unit.
Kentucky/Tennessee/West Virginia
The 1.2% average occupancy gain in Louisville was the best in this region for the opening quarter of 2018. Absorption was nearly 600 net units, and there were none delivered. Another bright spot was Nashville. An improvement in average occupancy of 0.4% is nothing to write home about, but absorption was nearly 1,300 units after just under 1,000 were delivered in the quarter. That level of activity is a welcome sight in this region. Unfortunately, Chattanooga and Memphis led the way with occupancy losses in excess of 1%- a 1.2% decline for each.
More alarming for these two markets was the loss of net rented units. Each had one new property come online in the quarter, but Chattanooga lost over 150 net rented units, and Memphis lost more than 700. Despite this, both managed to remain above 90% occupied- Chattanooga at 90.5%, and Memphis at 91%. Knoxville and Louisville both achieved average effective rent gains above 2%, and Knoxville’s 2.7% gain was good enough for top 20 in the nation. The only market to lose ground was Charleston, with a loss of 1.3% for an average of $761 per unit.
Virginia/DC/Maryland
The DC metro area needed every bit of its strong 3,000 net unit absorption to offset the more than 2,500 units delivered in the quarter. Baltimore, Norfolk and Richmond were all unsuccessful in absorbing more units than were delivered. Worst was the Baltimore market, where absorption was barely 33% of the new units delivered. Roanoke managed to rent barely more than 100 additional net units, but delivered none in the quarter for an average occupancy gain of 0.6%. Roanoke’s 94.8% average occupancy was good enough tops in this region to end the quarter. Baltimore, at 90.9% is the only market to be below 92% as of the end of March.
Average effective rents in these areas moved similarly in the quarter. Roanoke was the only market to increase a full percent, with a 1.1% improvement. DC and the remaining Virginia markets all had gains between 0.5-1%, and Baltimore rounded at the group with a 0.25% rise.
Mississippi/Alabama/Georgia/South Carolina/ North Carolina
The pressure of the new construction pipeline took its toll on markets in this region as well. Charlotte absorbed nearly 1,600 units- putting it in the top 20 of the country for Q1. And yet, average occupancy fell 0.25% due to the delivery of more than 2,200 new units. Similarly, Raleigh-Durham absorbed less than half of the 1,500 units delivered in the quarter, and Charleston gained net rented units equaling half of the more than 1,200 new units brought online. Atlanta delivered about 640 units, but lost nearly 700 net rented units to open the year.
The smaller markets were affected too. Augusta, Savannah, Asheville, Columbia, Greenville-Spartanburg and Myrtle Beach all failed to offset new units with net rented unit gain. Unsurprisingly, eight markets in this region were in the bottom 20 markets of the nation for quarterly net absorption, but the 1.8% average occupancy gain in Fayetteville placed it in the top 20 of markets for quarterly average occupancy change.
Thanks in large part to all of the new units, Charlotte led the large markets in the region in average effective rent gain- with an improvement of just under 1.5%. Augusta and Fayetteville led the field though, with gains of 1.9% and 1.7% respectively. Overall, the South Carolina markets performed best in this region from a rents perspective, with gains ranging from 0.8% in Greenville-Spartanburg to 1.2% in Wilmington.
Florida
Florida markets opened 2018 strong, with a couple of exceptions. Melbourne realized average affective rent gains over 2% for the quarter, and Orlando hit 2.5%. Both were within the top 20 in the country for effective rent gain. Fort Myers-Naples saw a 2% rise, and both Palm Beach and Tampa hit 1.6%. Tallahassee was the only market to lose ground, but only to the tune of a 0.1% decline.
Just as with effective rent gains, Florida had two markets in the top 20 for quarterly absorption as well. Miami-Fort Lauderdale absorbed about 2,200 net units, but delivered the same number of new units. Tampa absorbed nearly 2,800 units, and added less than 1,600. Orlando and Palm Beach were the other two markets in the state to surpass 1,000 additional net rented units in the quarter. Unfortunately for Orlando, nearly 1,000 more units were delivered than absorbed in the quarter. The result was a nearly 0.5% drop in average occupancy, the only average occupancy loss in the state.
On the other end of the spectrum, the 2.4% gain in Melbourne, and the 1.8% increase in Pensacola were both in the top 20 nationally. The deliveries in Miami-Fort Lauderdale kept average occupancy flat for the market, and it joins Tallahassee as the only markets in Florida not remain below 90% average occupancy.
Pennsylvania/New York/New Jersey/Delaware
New York City added just under 3,100 units in the quarter, and absorbed over 9,100 for a net average occupancy gain of nearly 1.6% to 90%. Albany experienced an average occupancy gain, of 1.8%, while Philadelphia’s flat occupancy was the only Pennsylvania market not to lose ground. Rents rose across the board though, with both Buffalo-Rochester-Syracuse and Philadelphia touching 1%. Pittsburgh led the way with a gain of 1.4%, and New York City bought up the rear with a gain of about 0.8% for the quarter.
Connecticut/Rhode Island/Massachusetts/New Hampshire/Vermont/Maine
Boston rented almost 1,700 additional net units to open 2018, but delivered close to 2,300 units for an average occupancy loss of 0.3% to 88.8%. Hartford and Concord also failed to absorb more units than were delivered- though to a lesser degree. Hartford suffered negative absorption on top of the added new units, while Providence also lost net rented units, but without the deliveries. Effective rents all gained ground in this region to start 2018. Hartford gained just under 0.75% and was joined by Hartford as the only market below a 1% rise. Boston led the way with a 1.4% increase in average effective rent.
Conclusion for the First Quarter 2018
In general, while the first quarter is typically not as strong as the following two, 2018’s first quarter was inferior to last year’s in many areas. Most of the lackluster absorption and average occupancy numbers where in areas where the construction pipeline continued unabated. We expect the pipeline to continue pressuring many markets around the country, and the next six months of the year will be telling. If performance in the traditionally stronger quarters doesn’t match the previous few years, we will have entered a new business cycle.
Request a Live Demonstration
ALN Apartment Data, Inc. has several platforms. Want to know more about which platform is right for you? Click the button and tell us a little about yourself to get started!
ALN Apartment Data, Inc. has several platforms. Want to know more about which platform is right for you? Click the button and tell us a little about yourself to get started!