National Occupancy Returns to Pre-Pandemic Level
2022 has been a starkly different year for the multifamily industry than 2021. The first major shift happened right out of the gate in January with tepid apartment demand that persisted all year. On the back of an active construction pipeline and low net absorption, average occupancy consistently fell from its 2021 peak, but the cushion of excess occupancy built up last year mitigated the impact somewhat. Then, as summer turned to fall, rent growth finally lost steam after running well above the normal range for more than a year.
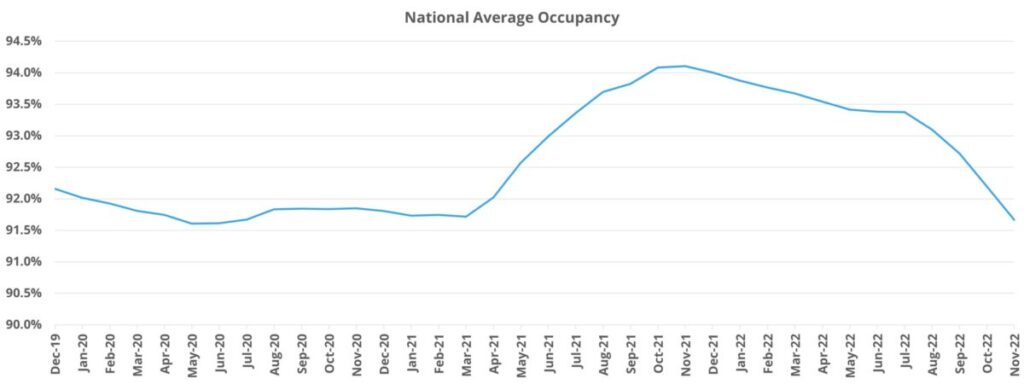
The latest development occurred in November when national average occupancy dipped below its pre-pandemic level for the first time in more than 18 months.
View the full monthly Markets Stats PDF
As always, numbers will refer to conventional properties of at least 50 units.
National Context
In the months immediately preceding the onset of the COVID-19 pandemic in early 2020, national average occupancy stood at about 92%. The national average then dipped slightly, by less than 100 basis points, and was then largely unchanged through the first quarter of 2021. Initially average occupancy was helped by residents moving less and a temporary slowdown in deliveries. In the back half of 2020, net absorption picked back up and demand was ultimately sufficient to offset new supply. The various eviction moratoria that were in place also undoubtedly had an effect.

Primarily in the second and third quarters of 2021, average occupancy rocketed upward and eventually reached a peak just above 94% to close November thanks to generational apartment demand. In just those two middle quarters of last year, approximately 460,000 net units were absorbed across the country, with annual net absorption topping 600,000 units. This level of demand, fueled partially by unrealized demand from 2020 and an unprecedented deluge of cash flooding into the economy via government action, was unsustainable. As already mentioned, by the winter of 2021 the net absorption explosion that fueled the occupancy and rent growth of last year was spent and has remained dormant through all of 2022.
Timing of New Supply Has Been Impactful
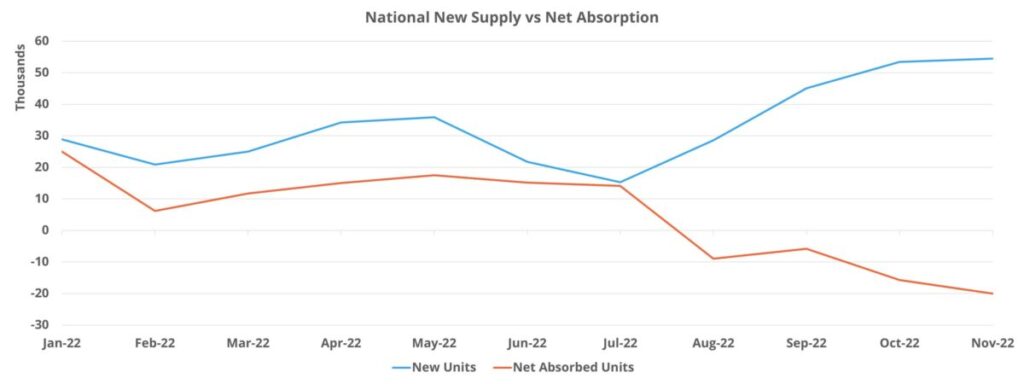
National net absorption through November of 2022 stood at approximately 54,000 units. For context, the worst year of the previous five was the 226,000 net absorbed units in 2017. This year has represented an astounding reversal from 2021 from an apartment demand perspective. Simultaneously, the new construction pipeline has delivered more than 370,000 new units – well above the previous five-year average of 302,000.
The timing of the new supply has had a significant effect on occupancy. Net absorption, although below new supply every month this year, was close enough to new deliveries through the first half of the year to keep average occupancy on a moderate downward trajectory. From December 2021 through July 2022, national average occupancy declined by 0.7% from a little above 94% to about 93.5%. In particular, a summer slowdown in deliveries paired with a small seasonal bump in apartment demand helped to stabilize occupancy from the late spring through the summer.

However, new supply ratcheted up considerably in August and in the following months right as apartment demand not only slumped further but fell into negative territory. In the four months from August through November, roughly 182,000 new units have been delivered nationally while net absorption was negative by nearly 13,000 units. The result was a 1.7% decline in that four-month period to bring average occupancy to a little below 92%. Not only was this average slightly lower than in the months immediately preceding the onset of the pandemic, but it was only around 10 basis points higher than the average from April and May of 2020 when occupancy troughed.
Takeaways Episode 45
Market Notes
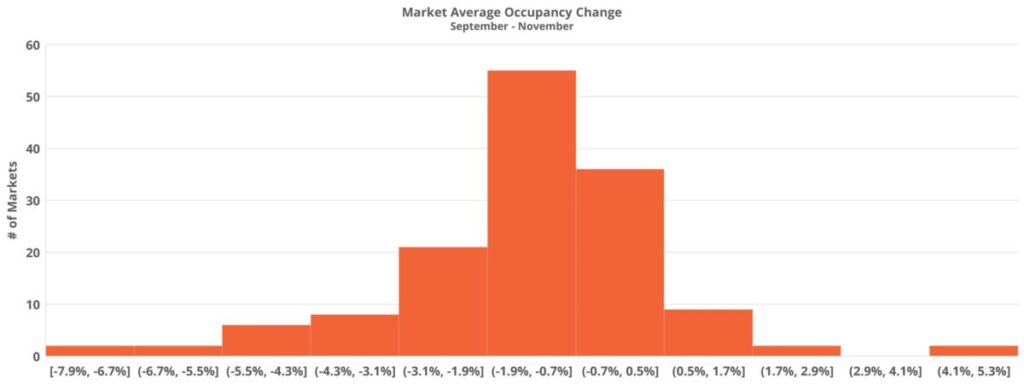
Myrtle Beach has suffered an eye-popping 8% decline in average occupancy since the end of August. To be sure, some of that decline can be attributed to seasonal effects in a popular vacation market. Even so, the previous five-year average for this portion of the calendar was only a loss of 0.4% at the average.
Other markets to shed 5% or more in average occupancy in the last three months were Omaha, Boise, Lexington, Savannah, Huntsville, and Pensacola. Boise may be the headliner of that group given its status as one of the hottest growth markets in the country over the last handful of years. In this case, the story is more to do with supply than with poor demand. Net absorption this year has been higher than in any year of the last five, but new supply reached 3,300 new units through November for a market that had averaged around 1,000 new units annually through the previous five years.

No primary market found itself near the top of the list of largest occupancy losses in recent months, but that is not to say there has not been some notable downside movement. Charlotte has seen average occupancy decline by around 3.5% since the end of August. Occupancy in Columbus, Orlando, and Tampa has declined by approximately 3% at the average in the period. Denver – Colorado Springs and Sacramento round out the remaining primary markets in which average occupancy has declined by more than 2% over the last few months – led by a 2.6% decline in Denver – Colorado Springs. Unlike in Boise, for these larger markets the movement in occupancy has been attributable both to increased new supply as well as to much lower apartment demand.
ALN Apartment Data just recently started using Instagram so we can share data and insights in new ways, and create exclusive content that can only be found there. Find us there today!
Takeaways
The multifamily industry managed to capture incredible rent growth this year while net absorption was extremely low in part due to the leftover occupancy from last year’s demand explosion. With one month left in 2022, that cushion has been exhausted.
For a reversal in the occupancy trend, or even a stabilization, some combination of an apartment demand rebound and a slowdown in new supply would need to occur. A significant slowdown in deliveries is not in the cards in the near term. Any changes to the pipeline by way of projects being canceled or put on hold, or development deals not being originated in the first place, would only impact projects that have yet to break ground and would not be entering the market for at least two years. Based on projects that are currently under construction, 2023 is set to be another very active year for multifamily new supply.
If a slowdown in deliveries is not in the cards for 2023, a rebound in apartment demand will be needed to mitigate further occupancy softening. Given that the winter months are typically seasonally a weaker portion of the calendar for the industry, this rebound would be most likely to occur in the spring and summer of next year – if it materializes at all. In the meantime, further downward movement in the next few months is highly probable.
Certain headwinds persist for apartment demand as well. Inflation has eaten into wage growth to send real median household income in the wrong direction. Household debt, and especially credit card debt, have grown at rates not seen in more than a decade. Household wealth and household cash balances have fallen considerably this year. Additionally, the stated FED policy has been to continue raising rates until unemployment rises – the target unemployment rate would add more than one million people to the unemployment total. All of this is in addition to 24% average effective rent growth for new leases since the start of 2021 that has exacerbated affordability concerns for residents and garnered undesired attention from government at all levels.
The situation is certainly not all doom and gloom. With a longer-term horizon of a few years, multifamily fundamentals remain encouraging – not least due to the expected muted competition from single-family sales. In the near-term though, the road is likely to be somewhat bumpy.
Disclaimer: All content and information within this article is for informational purposes only. ALN Apartment Data makes no representation as to the accuracy or completeness of any information in this or any other article posted on this site or found by following any link on this site. The owner will not be held liable for any losses, injuries, or damages from the display or use of this information. All content and information in this article may be shared provided a link to the article or website is included in the shared content.


