Digging Into Recent Rent Changes
Persistently low apartment demand this year has obviously had a major impact on the other commonly cited performance metrics for the industry. While average occupancy has been trending downward all year, tepid demand finally caught up with stubbornly high rent growth in just the last few months.
We last checked in on rent growth in the August newsletter, and at that time with July being the most recently available data, clues had begun to emerge that rent growth momentum was potentially coming to an end. In the months since, that slowdown has materialized. Interestingly, though there are some key differences in how this shift has played out, there are also notable similarities.
View the full monthly Markets Stats PDF
One major similarity comes into focus when grouping markets according to size in terms of multifamily stock. There has been relatively little difference between the average effective rent growth of primary, secondary, and tertiary markets both on a year-to-date basis and just within the last three months.
As always, to dig a little deeper on the topic, only conventional multifamily properties of at least 50 units will be included.
National Rent Growth
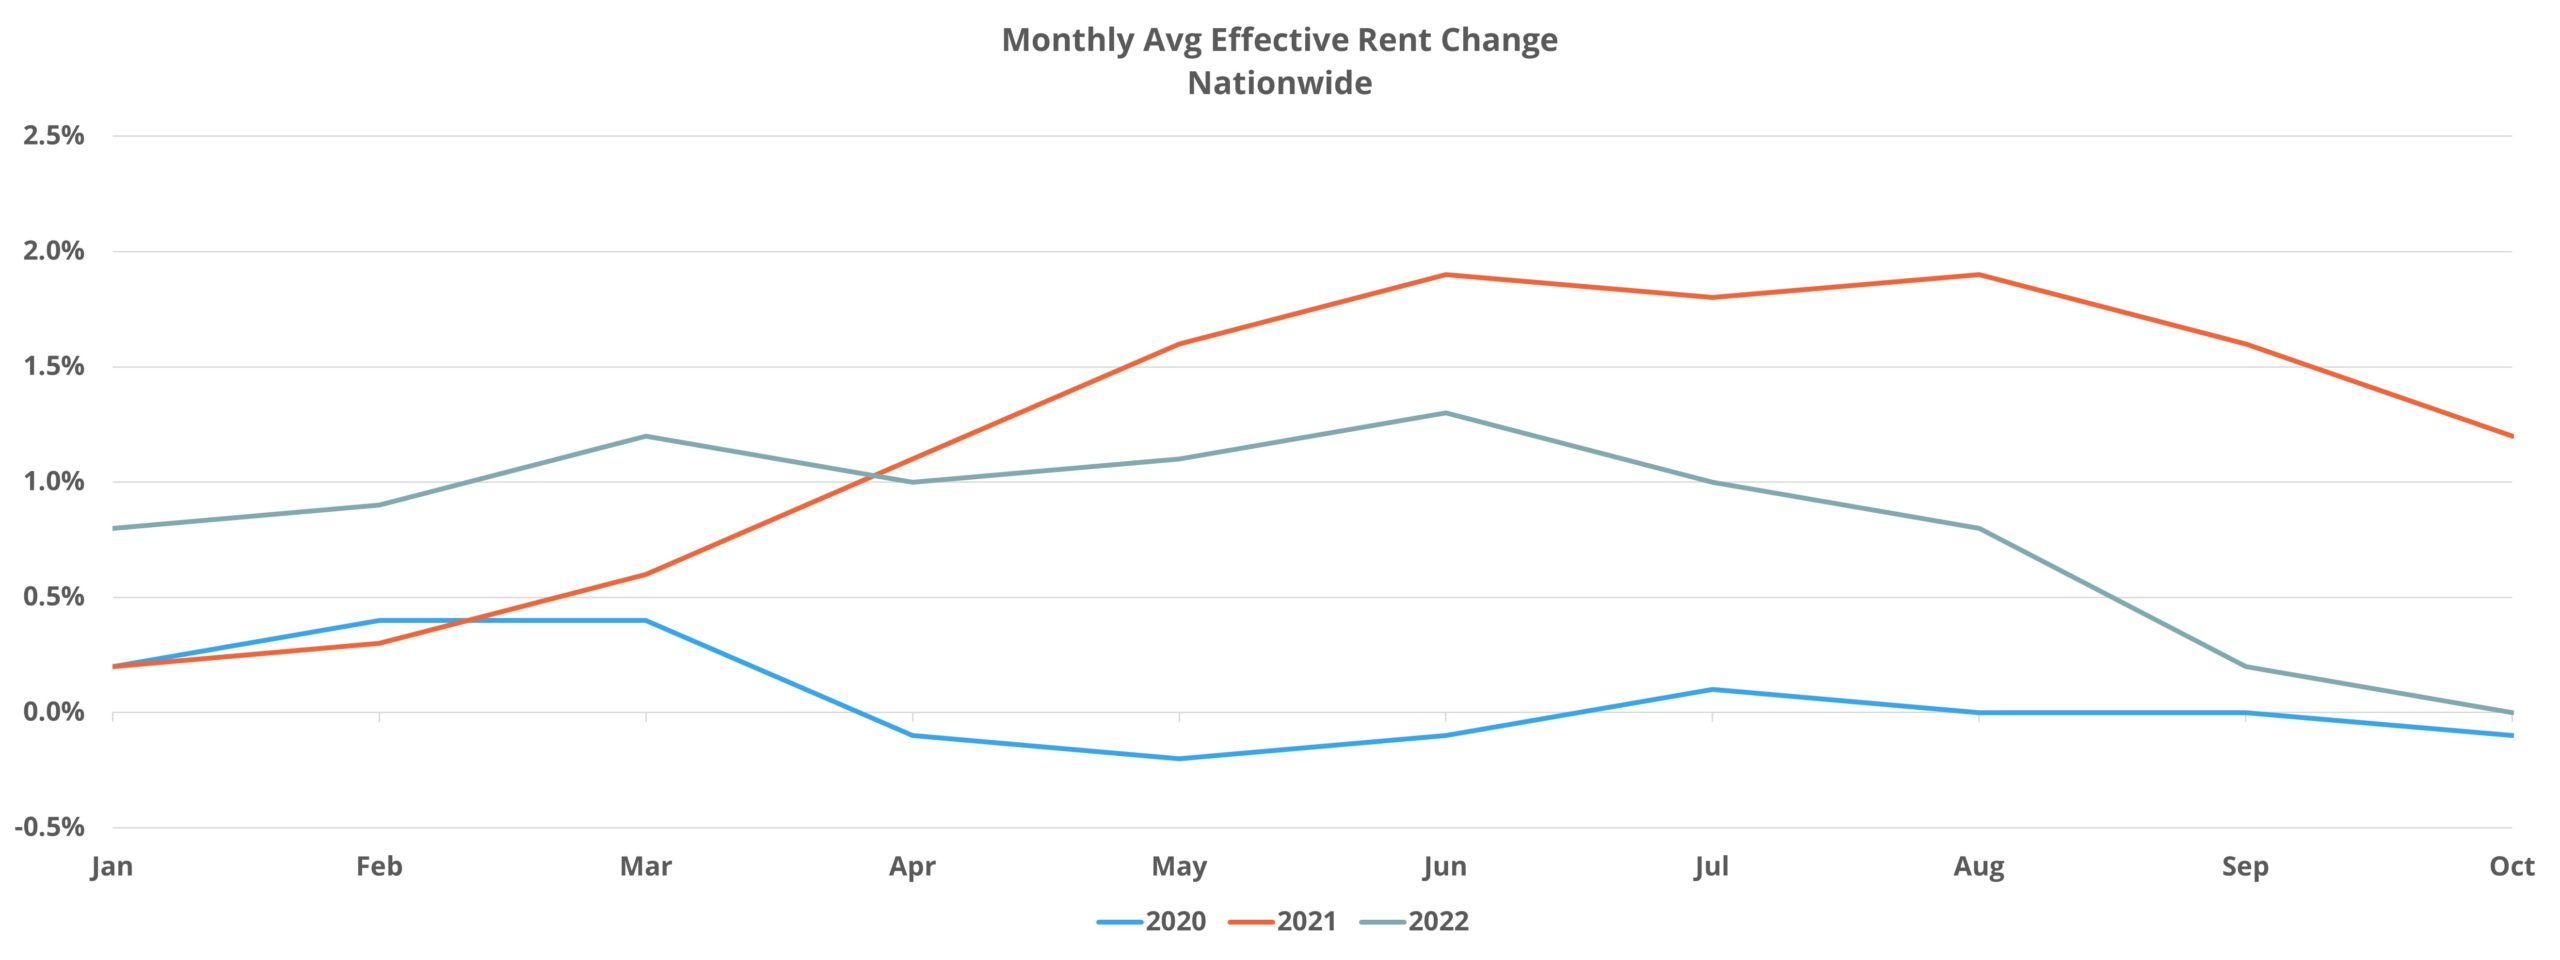
At the national level average effective rent growth for new leases slowed from a 1% monthly gain in July to no change in October. The first factor that has to be mentioned is seasonality. The multifamily industry is highly seasonal, and rent growth is typically highest in the second quarter. That being the case, we are now well past the peak period of the calendar for rent growth, and it should not be surprising that the fourth quarter opened with flat growth for new leases.

Aside from the anomalous 2021 numbers, monthly average effective rent change for October through December has ranged from -0.1% to 0.1% for the last five years. A key development of this year has been a return to something approximating the typical seasonal trend for both net absorption and rent growth, whereas in 2020 and 2021 the usual seasonality was not present in the data.
Another part of the national story has been the change in lease concession availability for new residents. After consistent declines all year, and from an already low level of availability, the industry has now seen three consecutive months of increases in availability. Not only that, but the rate of increase has grown in each of the three months – culminating in a 12% jump in availability in October. However, even after the recent increases, less than 10% of conventional properties around the country closed October offering a discount for new leases.
One other detail worthy of attention is the underlying rent growth trend when seasonality and statistical noise are removed from the data. Once this adjustment is made, it becomes apparent that rent growth for new leases actually peaked in the back half of 2021 and has been steadily declining since. This makes clear that aside from just normal seasonal fluctuation, rent growth pressure has truly arrived.
The Data You Need
Our clients expect valuable multifamily research and data, and our platforms make it easy to acquire the relevant information your business needs. Whether you need multifamily market analysis, property comparisons, routing, or more – don’t wait to discover how we can help you!
Price Class View
As already mentioned, there has not been much difference between primary, secondary, and tertiary market rent changes in recent months – though, the secondary and tertiary market subsets have maintained a slightly higher level of growth. But differences do emerge at the property price class level of analysis.
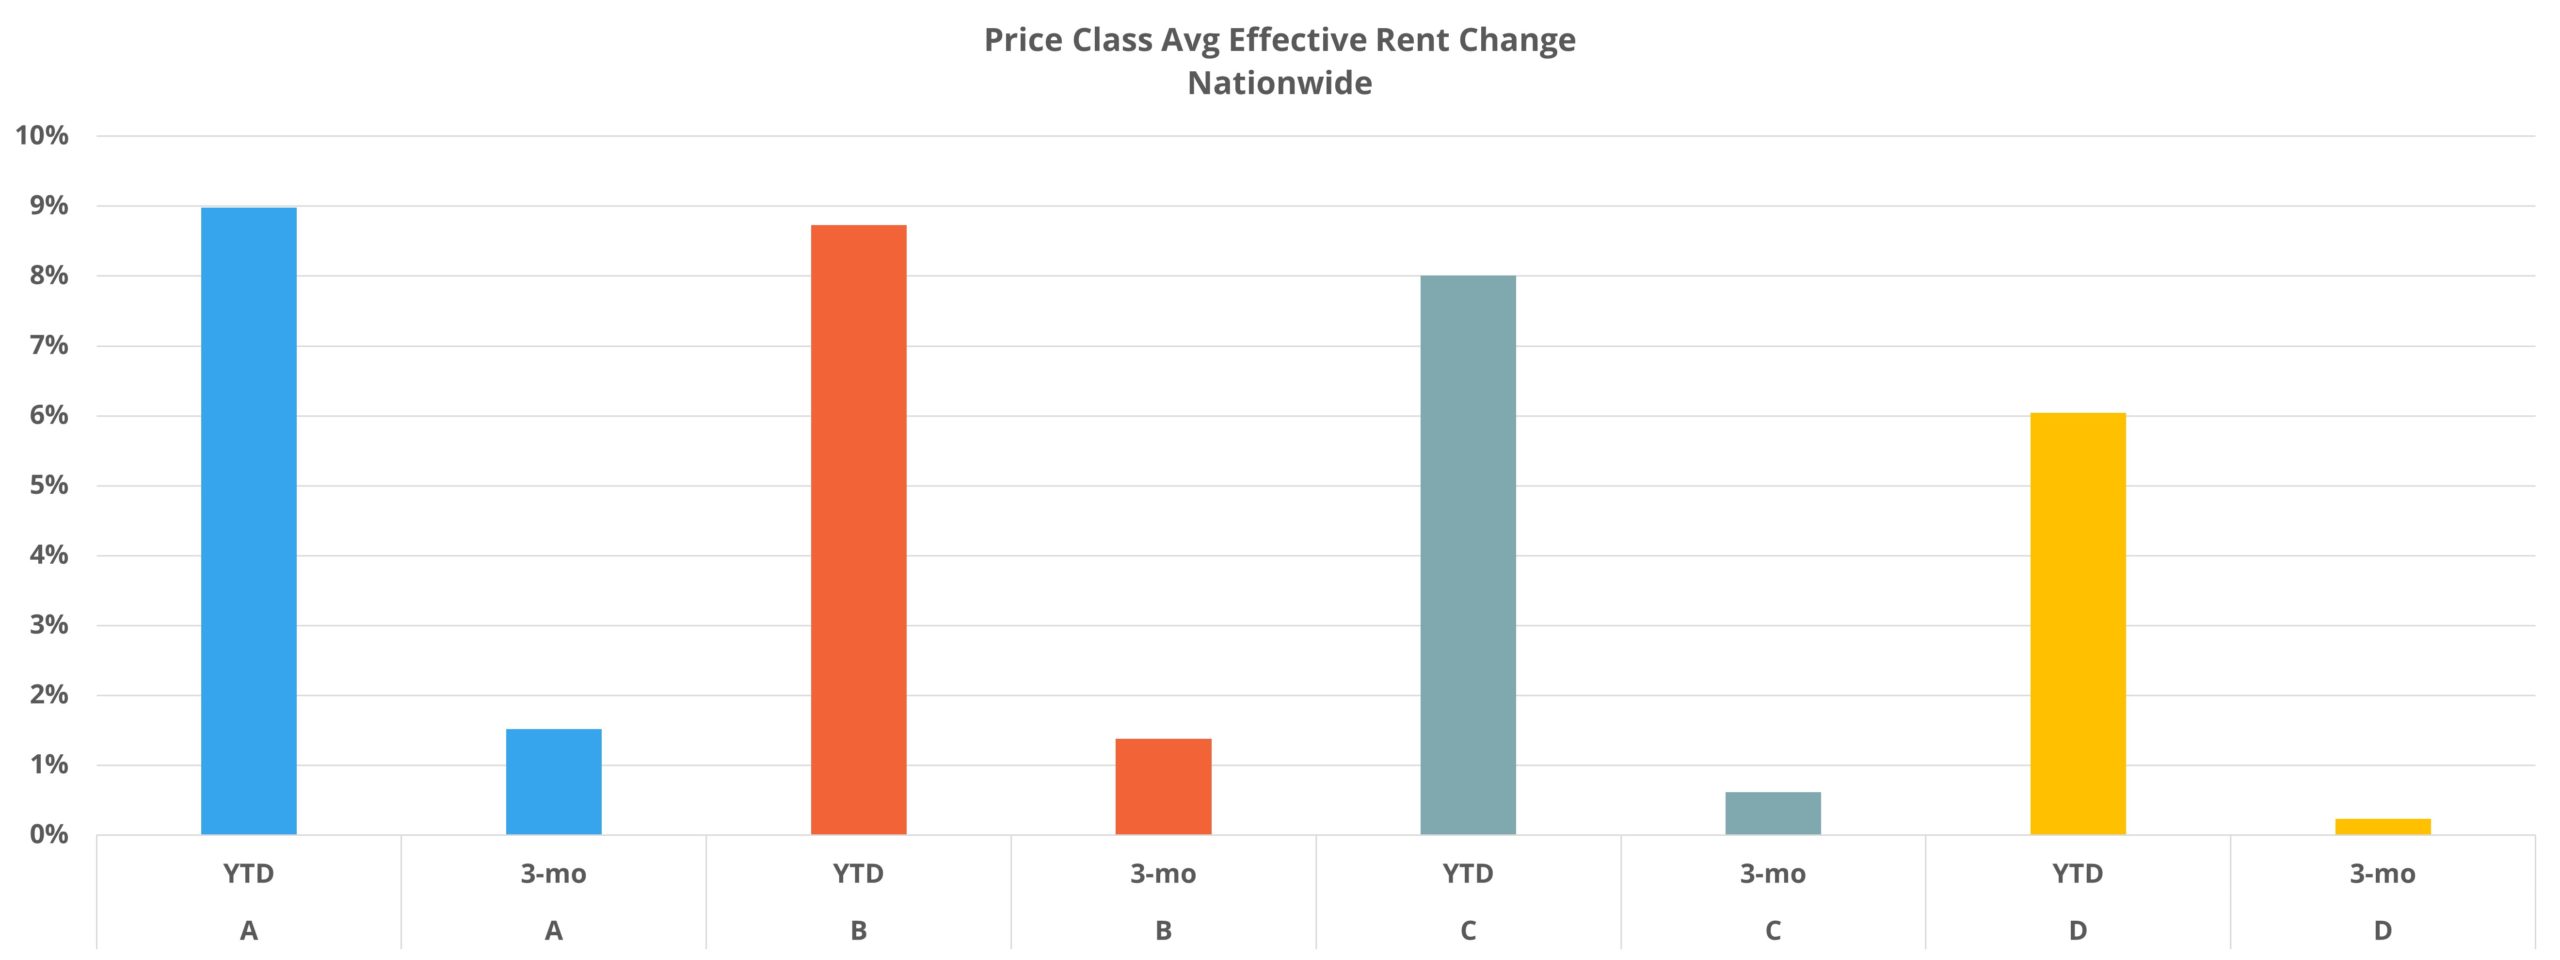
As would be expected after last year’s incredible rent growth across the board, this year’s rent growth through October decreased down the price classes from the Class A peak of 9%. However, even Class D properties averaged a 6% gain in the period. Looking at just August through October, the same pattern held with Class A achieving the highest rent growth (+1.5%) and Class D managing the least (+0.2%). The difference was in the change relative to the other price classes.

For example, Class D year-to-date rent growth was roughly one-third less than Class A rent growth, but in the last three months Class D growth was about 85% lower than Class A. Similarly, Class C average effective rent growth was only 11% lower than Class A on a year-to-date basis, but in the last three months the shortfall has been 60%.
The move toward lease concessions has also been quite different across the price classes. Only the Class A group nationally had a lower rate of availability to end October than to start the year, but even that group has seen an 8% increase in discount availability from August through October. For the remaining three price tiers, the last three months have seen gains in availability in excess of 20% – with Class C and Class D seeing increases of 35% and 25% respectively.
Regional View
There have also been significant differences in the change to the rent growth trend regionally. For simplicity, NAA regions were used to partition the data.
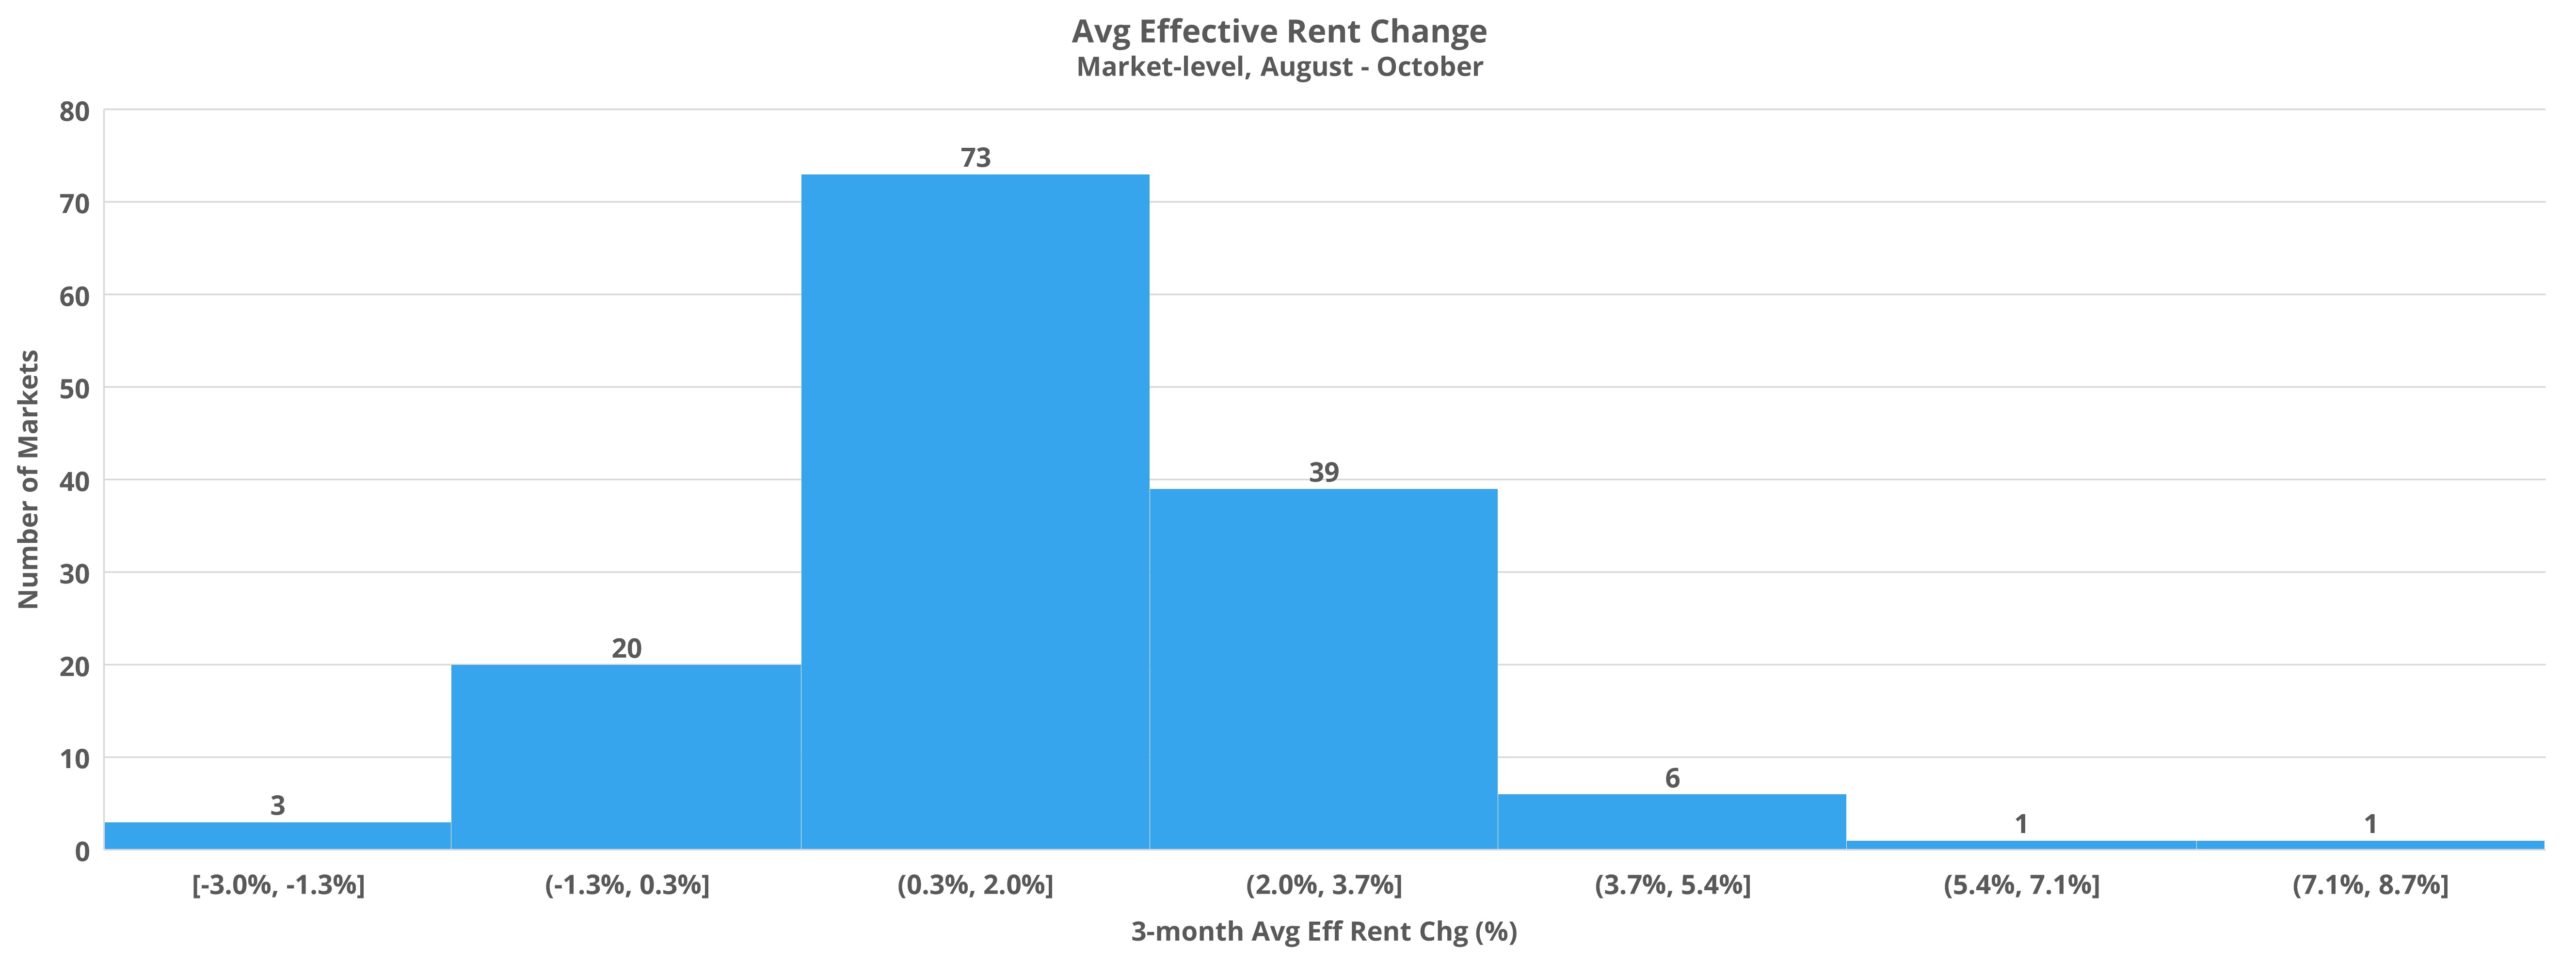
Whereas the year-to-date average effective rent gains for the ten NAA regions range from 7% to 10%, in the last three months the same range has been from 0.2% to 2.2%. Once again, recent months have brought with them greater dispersion in the rent growth results.
NAA Region 2 (Midwest) at 2.1% growth and Region 5 (Northeast) at 2.2% were the only two regions of the ten to achieve rent gains above 2% in the last three months. Driving the strong results for those two regions were areas like New Jersey, Nebraska, and Missouri. Only Maine suffered negative average effective rent growth in the last three months – to the tune of a 1.1% loss.

On the other end of the scale, both Region 7 (Pacific Northwest) and Region 8 (Rocky Mountain region) managed the least growth in the last three months with a 0.2% gain for each. In the case of these two regions, four of the 12 included states have experienced negative rent growth since August. Idaho and Nevada were the two hardest hit states, each losing around 1% in average effective rent. In particular, Boise and Las Vegas have struggled recently. It has not been all bad for this region, though. Montana and Wyoming have each managed a jump of approximately 3% in the last three months and North Dakota was right behind with a gain of more than 2.5%.
Of the remaining regions, only Region 6 (New Mexico and Texas) and Region 9 (Gulf region) failed to reach 1% average effective rent growth in the last three months. Of particular note was Austin, a high-growth market that has been near the tip of the spear for rent growth in recent years. Since the end of July, Austin has found itself in the bottom five of markets across the country with a loss of about 1.2% in average rent for the period. In total five Texas markets were in the bottom 25 markets for rent change in the period – including Houston.
Takeaways
The relationship between supply and demand is paramount. With excess supply and tepid demand, a common question around the multifamily industry this year has been how long rent growth could defy the gravitational pull of low net absorption and declining occupancy. The downward pressure from those factors, combined with increasing macroeconomic headwinds outside the industry and the seasonal effects from the current portion of the calendar conspired to provide an answer in the last few months.
Some common threads can be parsed below the national data. For one, the downward shift in rent growth has been most pronounced in the lower two price classes. These are properties less able to take advantage of prospective single-family buyers that find themselves still renting and may also be more prone to household consolidation in the face of price pressure. Another pattern in the data is that those markets that led the rent growth bonanza over the last two years or so, typically growth markets across the Sunbelt and upper Mountain West, have seen rent growth subside more abruptly. Examples include Austin, Las Vegas, Phoenix, Reno, Boise, and Jacksonville.
Looking ahead to the end of 2022 and into early 2023, there is little reason to expect a turnaround in rent growth until at least the spring. In addition to the markets already in negative territory over the last three months, there are a further 30 or so markets that have managed less than 0.5% growth in the period. These comprise the list of areas that are especially likely to dip into negative territory before spring.
Disclaimer: All content and information within this article is for informational purposes only. ALN Apartment Data makes no representation as to the accuracy or completeness of any information in this or any other article posted on this site or found by following any link on this site. The owner will not be held liable for any losses, injuries, or damages from the display or use of this information. All content and information in this article may be shared provided a link to the article or website is included in the shared content.

