Stabilized Properties Closing the Net Rent Gap
It’s been another active year for new supply of properties so far in 2019. Deliveries have been down slightly compared to last year’s deluge, but volume remains very high by historical standards. With that in mind, let’s look at year-over-year performance between nationwide conventional properties and stabilized-only conventional properties.
ALN currently tracks more than 100,000 conventional properties across all 50 states. For our purposes, a property is considered stabilized once it reaches 85% occupancy.
View the full monthly Markets Stats PDF
Net Absorption
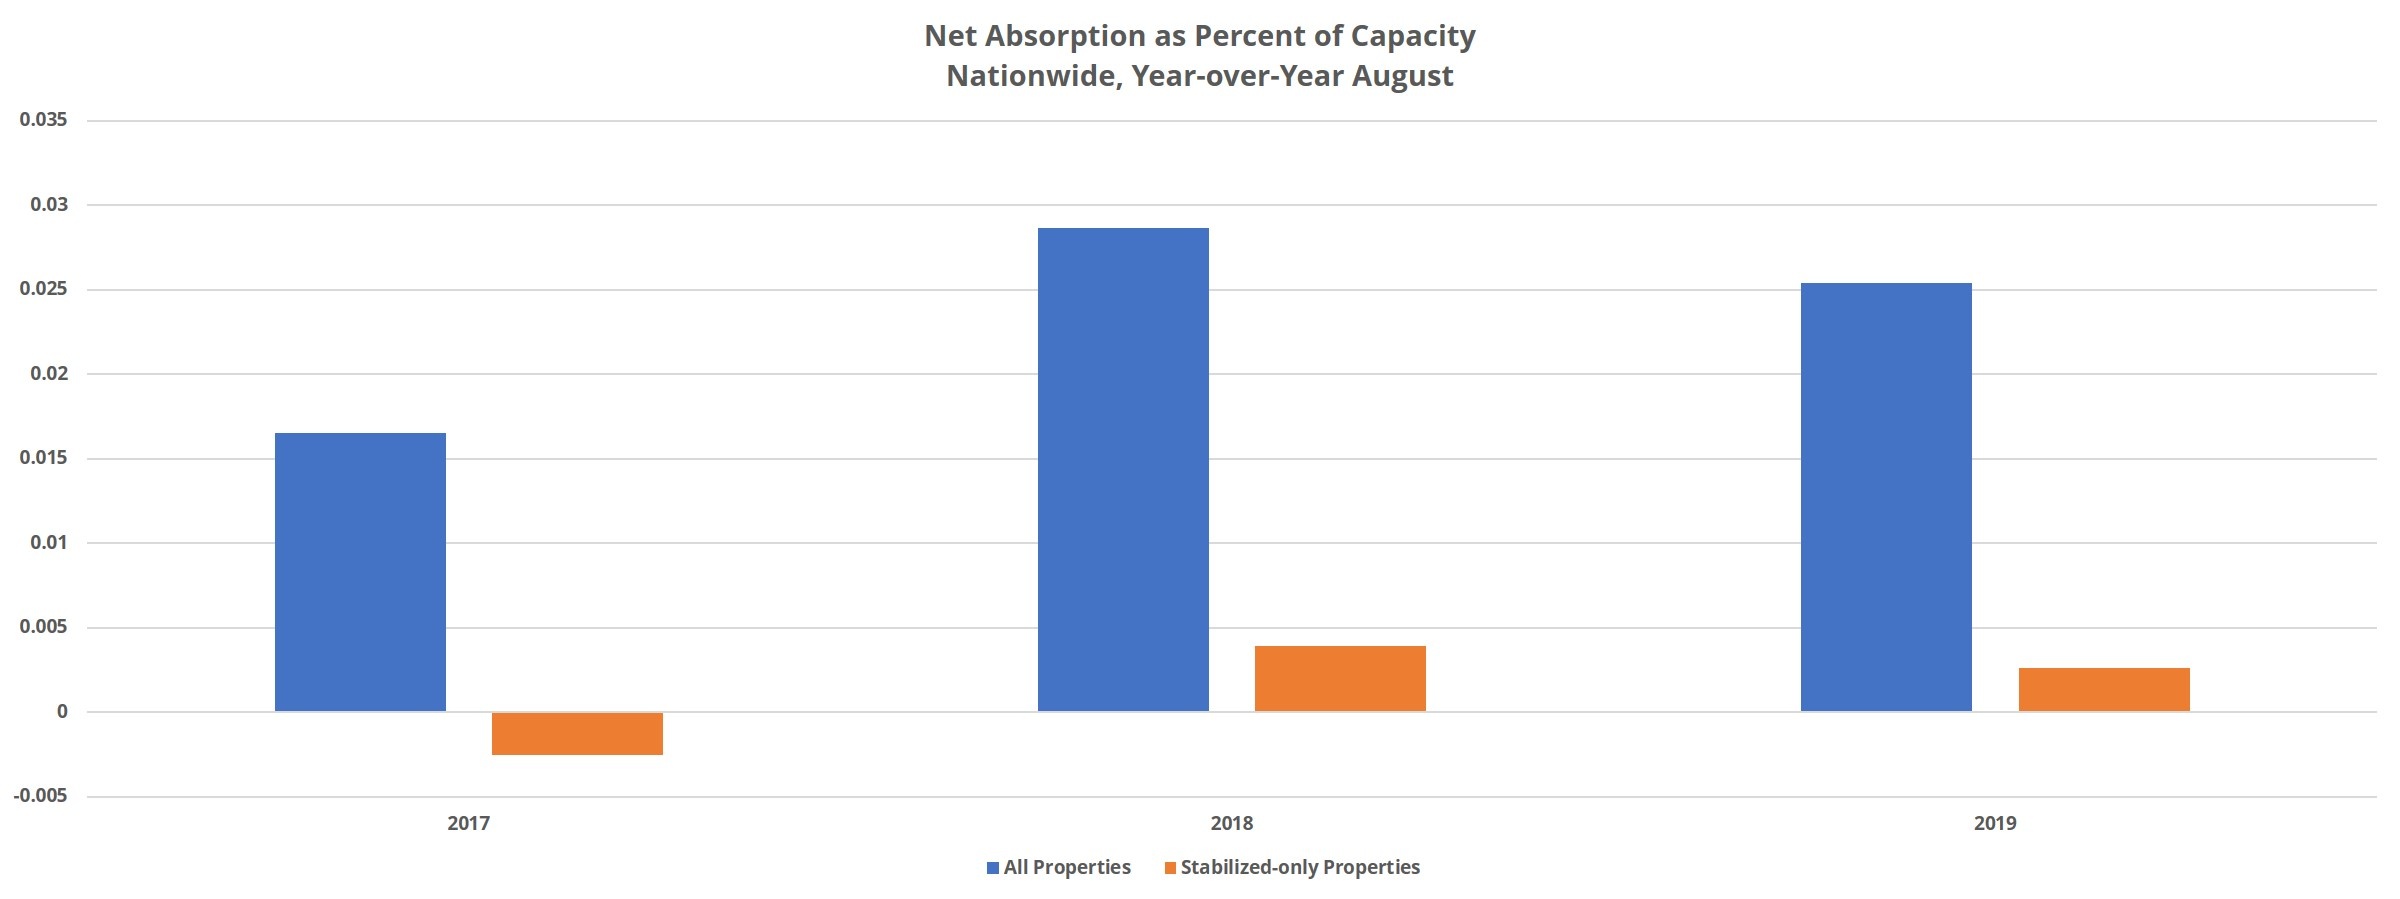
It’s valuable to compare net absorption* figures for the basket of all properties to the basket of stabilized-only properties to see whether new units are being poached from stabilized properties by lease-ups. For all conventional properties in the last 12 months, a little more than 300,000 units have been absorbed. That is down from the previous 12 months but represents a stark increase from the roughly 190,000 absorbed units from August 2016 to August 2017.
For the basket of only stabilized properties, about 30,000 units have been newly rented in the last year. That is less than the previous annual period when about 43,000 units were absorbed but is a massive improvement over the shedding of more than 25,000 rented units from August 2016 to August 2017. This is a welcome development, as it shows stabilized properties are not being cannibalized on the national level by new properties.

Average Occupancy
While demand was not equal to the previous annual period in either group of properties, absorption remained high enough to maintain national average occupancy despite the new units. When considering all conventional properties, nationwide average occupancy finished August just below 92.5% after a seven-basis point increase. Average occupancy is now just about exactly what it was to open August 2016. In that span, over 800,000 conventional units have been brought to market.
There was slightly more movement is the stabilized-only average occupancy. An annual increase of about 20-basis points brought the average to almost 94.5% to finish August. Not only did occupancy gains decrease less among stabilized compared to all, but an average occupancy pushing 95% means that those stabilized have a little cushion should new units begin to eat into demand.

Average Effective Rent
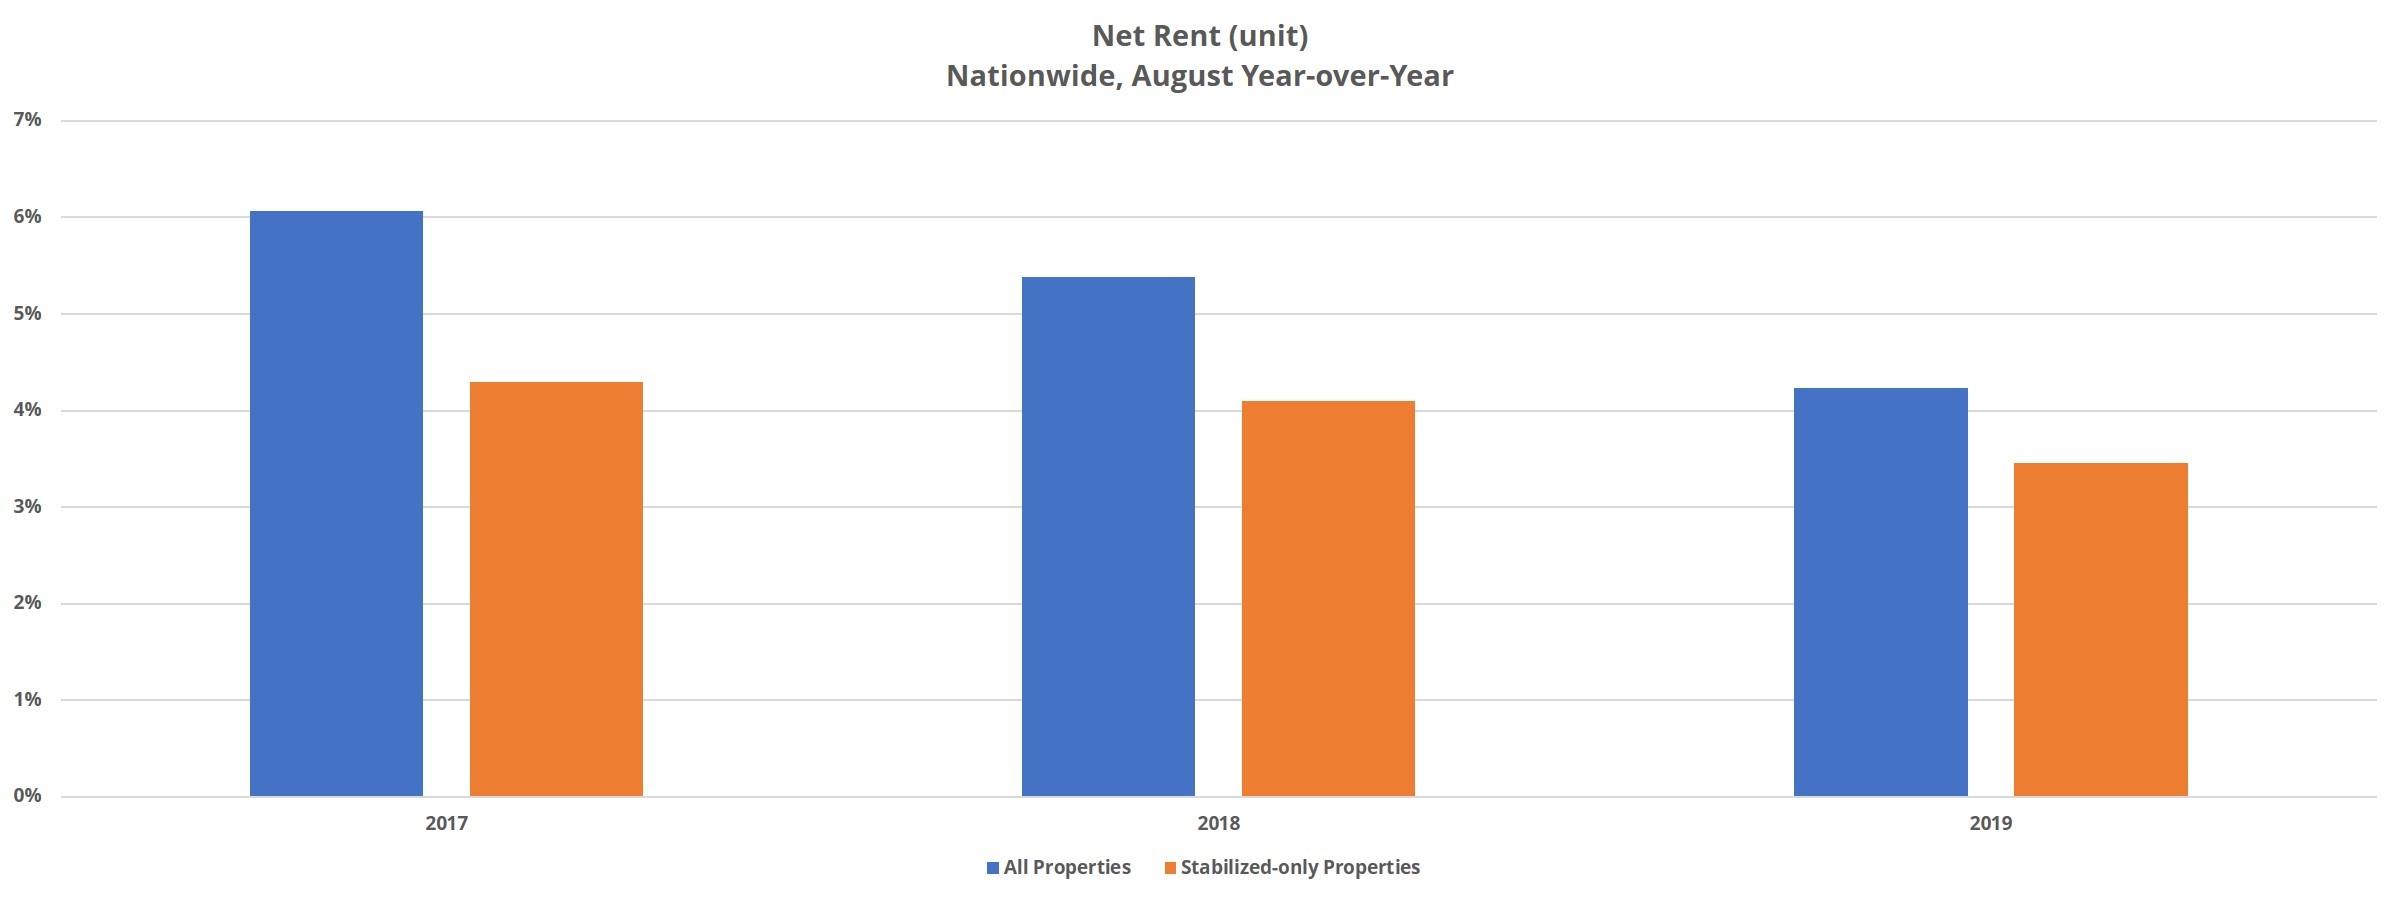
Average effective rent growth has slowed nationally over the past few years but remains robust. After seeing average effective rent climb by a little more than 4% since August 2018, average monthly rent ended August at about $1,350 per unit for all conventional properties. That’s down from more than 6% growth from August 2016 to August 2017 but rent growth north of 4% this late in the cycle is nothing to sneeze at.
Rent growth has similarly slowed within the stabilized-only properties, though not to the same extent. Whereas average effective rent growth was slightly above 4.5% two annual periods ago, the last 12 months saw rent appreciation of just under 3.5%. The delta between the rent growth across all properties versus only stabilized is narrowing. Whether looking at the percentage of properties offering a rent concession, or the average value of the discount, stabilized properties are relying on concessions less to maintain occupancy.
Takeaways
It’s clear that new properties are not currently cannibalizing existing properties – on a national level at least. While rent growth, average occupancy and net absorption were down compared to the previous annual period in both sets, none of the numbers are cause for alarm. So far, there has been enough demand to absorb hundreds of thousands of new units while also maintaining occupancies in existing properties.
The net rent gap between stabilized and all properties is closing, and we could see a continuation of that trend if rent growth for new properties begins to create additional demand for existing units while necessitating increased reliance on rent concessions for lease-ups.
*Net absorption is the net change in rented units
Disclaimer: All content and information within this article is for informational purposes only. ALN Apartment Data, Inc. makes no representation as to the accuracy or completeness of any information in this or any other article posted on this site or found by following any link on this site. The owner will not be held liable for any losses, injuries, or damages from the display or use of this information. All content and information in this article may be shared provided a link to the article or website is included in the shared content.

