Stabilized Properties are Holding Their Own
Throughout the last few months we’ve analyzed multifamily performance in several ways in this space. We’ve looked at performance by market size, by price class and over different spans of time. This month, we look at year-over-year performance between nationwide conventional properties and stabilized-only conventional properties. ALN currently tracks more than 100,000 conventional properties across all 50 states. A property is considered stabilized once it reaches 85% occupancy or 9 months after construction completion, whichever comes first.
View the full monthly Markets Stats PDF
Net Absorption
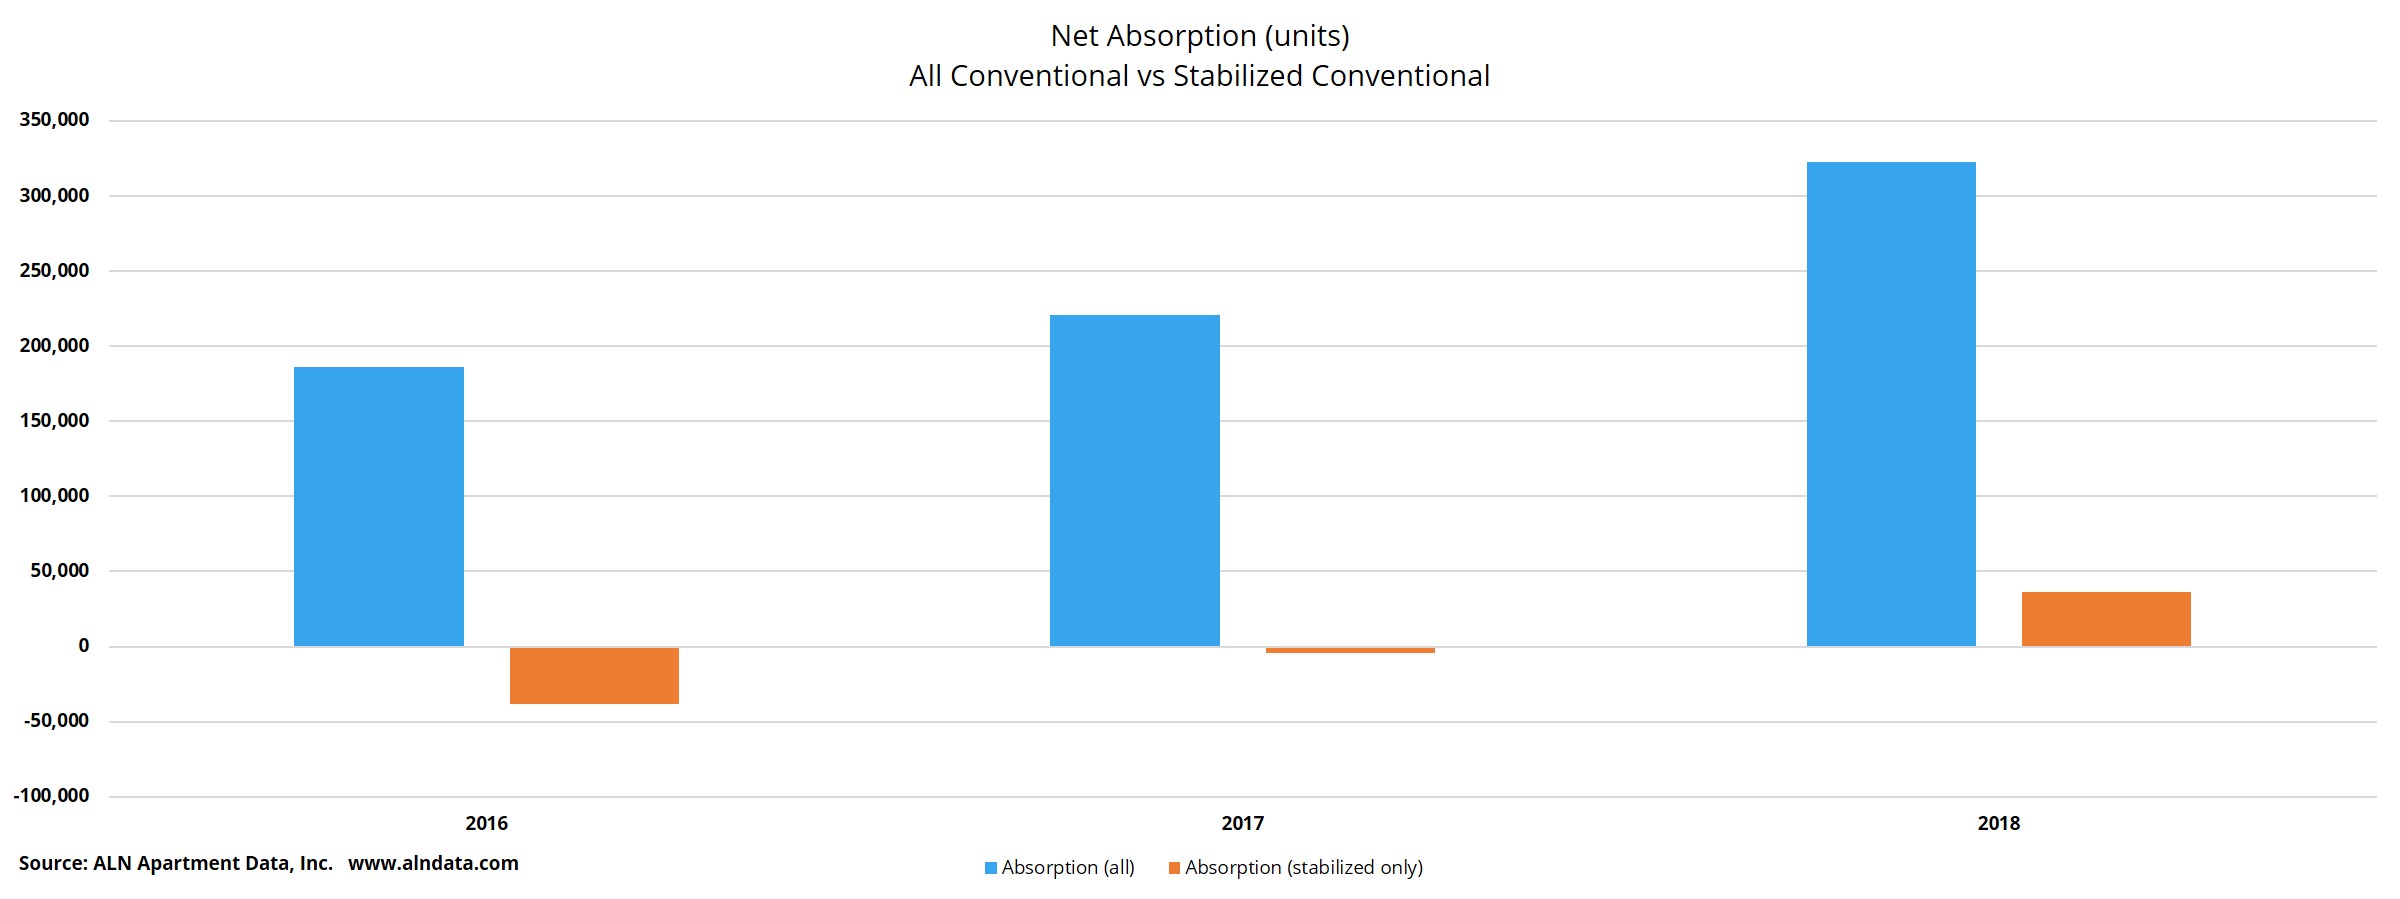
It’s valuable to compare net absorption* figures for the basket of all properties to the basket of stabilized-only properties to see whether new units are being poached from stabilized properties by lease-ups. For all conventional properties in the last 12-months, nearly 325,000 units have been newly rented. That is 100,000 more units than in the previous 12-month period and not far from double that of October 2015 through October 2016.
For the first time in the last three year-over-year periods, net absorption was also positive amongst the stabilized-only properties. A net gain of about 36,000 rented units represents a substantial improvement from the 4,500-unit loss and the 38,000-unit loss from the previous 12-month windows respectively. This is a positive development, as it shows that despite the increase in new supply, lease-ups have not cannibalized existing properties to fill their units this year.
Average Occupancy
Thanks to the strong absorption numbers found in both baskets of properties, average occupancy has remained level despite the new supply. When looking at all conventional properties, occupancy has moved between 92-93% over the last 36-months. As of the end of October 2018, the national average was a hair over 92%. Relatively flat occupancy for three years might not sound great, but this stasis occurred while more than 800,000 new units were delivered across the country.

When looking at only the stabilized properties, the picture is much the same. Average occupancy has stayed between 94-95% throughout the same timeframe. Not only is it a good sign that occupancy has stayed stable in this basket of properties, it shows there’s some cushion should there begin to be a little renter poaching on the part of new properties.
Average Effective Rent
Effective rent gains are similarly encouraging in some ways. We’ve seen a 5% gain in the nationwide average effective rent per unit for all conventional properties over the last year. 5% growth is very strong for a cycle this long in the tooth. Looking back over the recent past, it does represent a slowdown in growth though. From October 2016 through October 2017, rent growth was nearly 8%. Even that was less than the rate of growth from the prior annual period. While rents continue to rise, we are seeing a slowdown in the rate of growth.
Another piece of good news is that rent appreciation is not due only to the new units coming in at the top of the market. If we look at the stabilized-only properties, the rent gains were not too far off the overall rate. Over the last year, there has been a 4% rise in average effective rent per unit for existing properties. Just as with the basket of all conventional properties, this is a healthy gain, but fell short of the recent past. As of the end of October 2016, the year-over-year improvement was about 6%, while the previous 12 months saw even stronger gains.
Takeaways
The picture remains somewhat rosy for multifamily, at least for now. The number of new units being introduced continues to climb, but demand has kept pace. Average occupancy remains in the low 90% range overall, and that climbs into the mid-90% area when looking at stabilized properties. Additionally, it appears lease-up properties are no longer depending on renters from existing properties as they themselves try to fill units.
Effective rent continues its steady climb, though at a slower pace than we saw in the last few years. This is by no means a major red flag, because rent growth is still occurring at a healthy pace- including for existing properties. As we head into the holiday season, the industry seems to be on solid ground.
*Net absorption is the net number of newly rented units
Nationwide Multifamily Data
ALN OnLine makes it easy to research individual properties, submarkets, markets and more – available nationwide and with flexible pricing options!

