Average Lease-up Time Has Decreased After Years of Increase
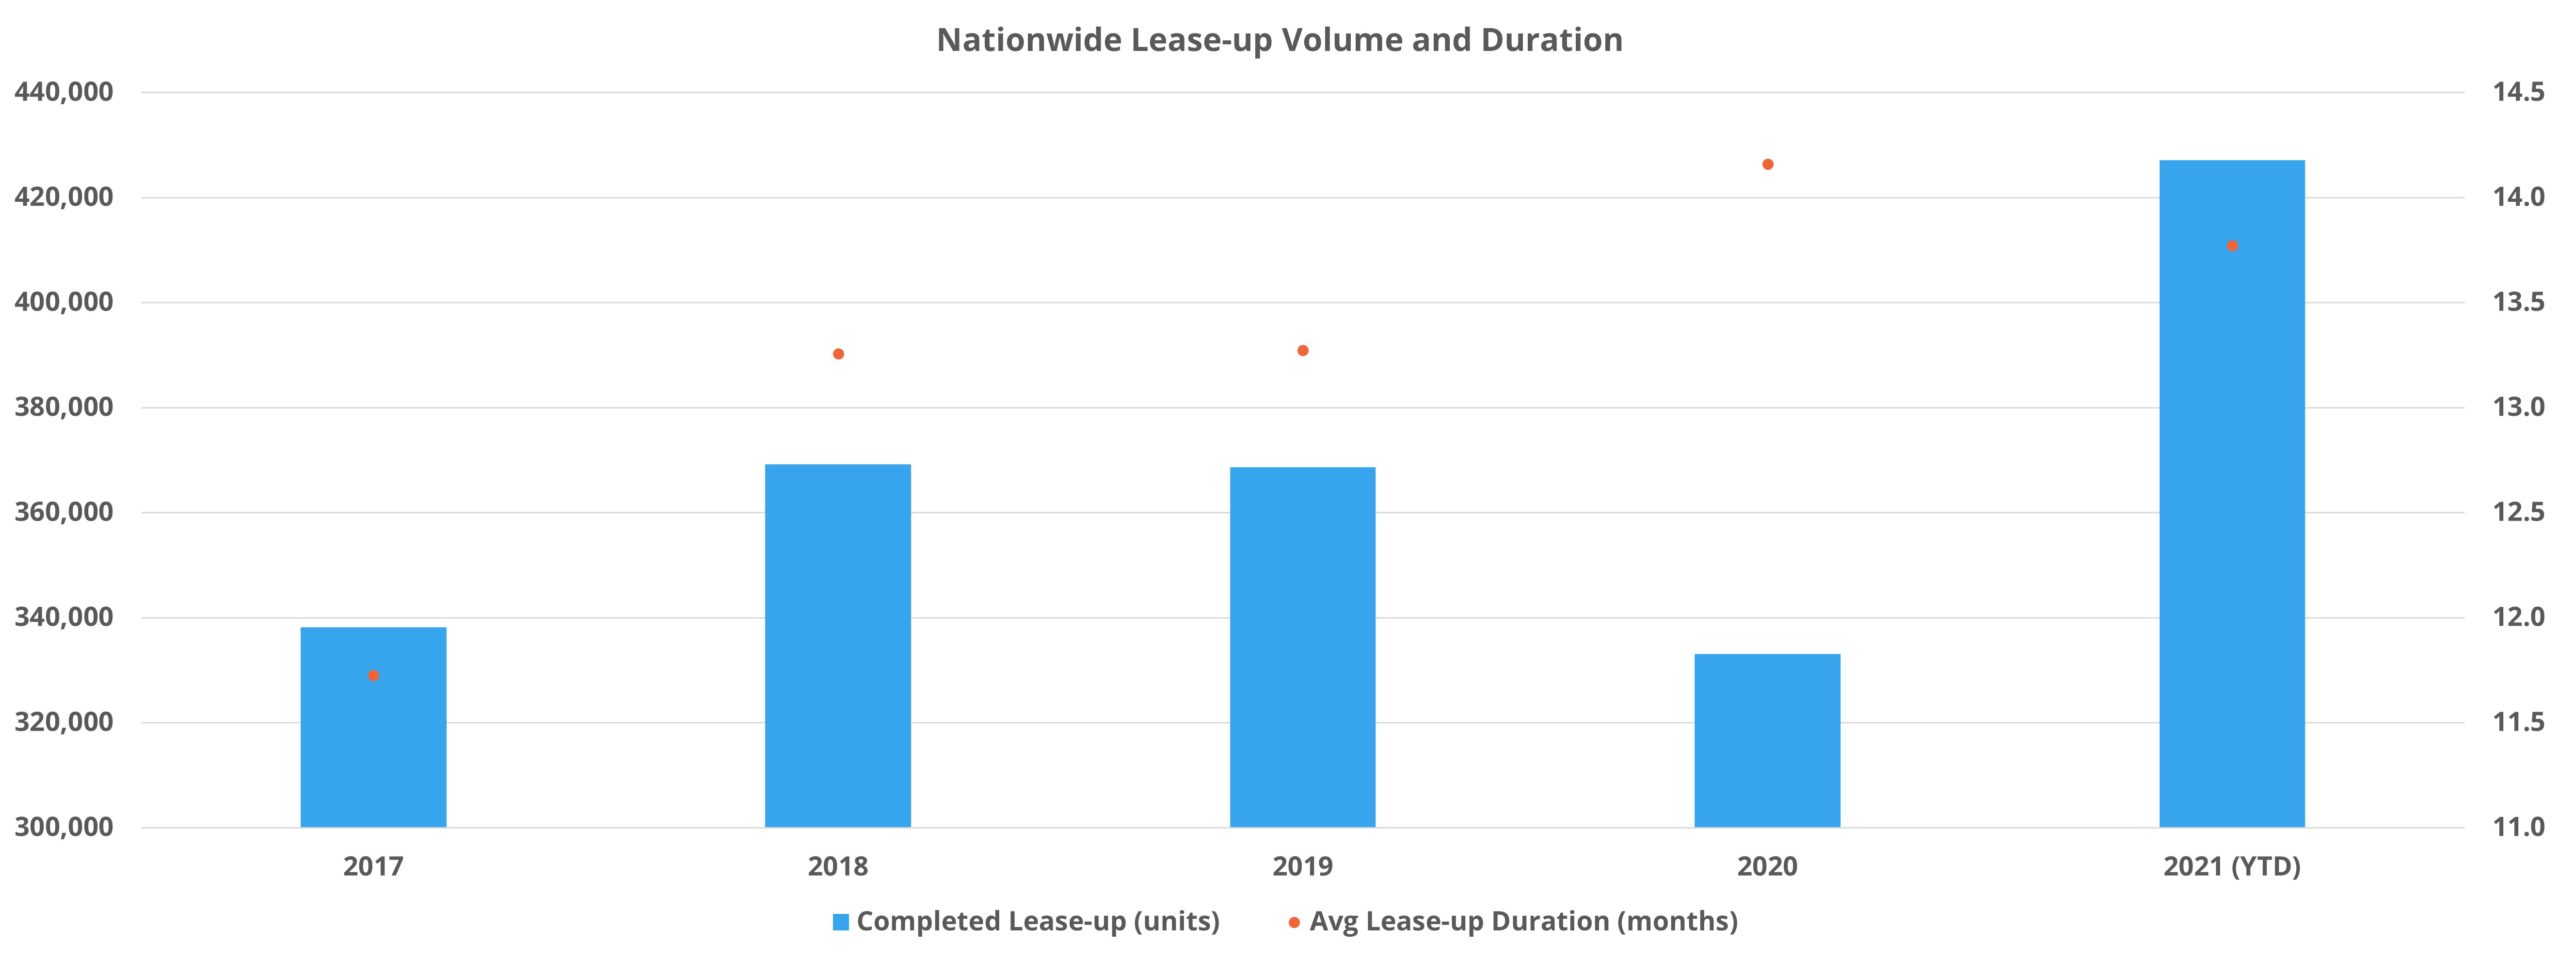
The new construction pipeline, despite the various supply and labor challenges present in the market, has continued to deliver units this year to an extent greater than in recent years. Through October, more than 300,000 conventional new units have been delivered, up from just over 260,000 new units in the same portion of both 2019 and 2020. While the preexisting upward trajectory in average construction time has continued and intensified, the average lease-up duration has declined for the first time in more than four years.
ALN defines lease-up velocity as the time elapsed from the beginning of leasing completed units to an overall occupancy of 85%, or 12 months after all construction is finished, whichever comes first. As usual, numbers will refer to conventional properties of at least 50 units.
National View
In total, almost 2,100 properties comprising just more than 425,000 units have reached stabilization through October of 2020. This is well above recent full years despite only representing a 10-month period. For properties that have stabilized this year, the average duration from lease start to stabilization was 13.8 months. This average represents a small 3% decline from 2020, but the annual decline is the first in more than five years.
View the full monthly Markets Stats PDF
In 2017, the average lease-up time was 11.7 months, and that year was the last in which the average was below 13 months. As already mentioned, this year’s improvement in lease-up velocity has been achieved even as the total number of properties in a lease-up phase has dramatically increased. This is a reflection not only of the generational apartment demand seen this year, but specifically the robust demand in the Class A space.

Market Tier View
ALN assigns every market, with the exception of a non-contiguous miscellaneous region of each state, to a market tier based on its level of multifamily stock. Tier One multifamily markets are the 33 largest in the country, and Tier Four markets are the smallest markets in the US.
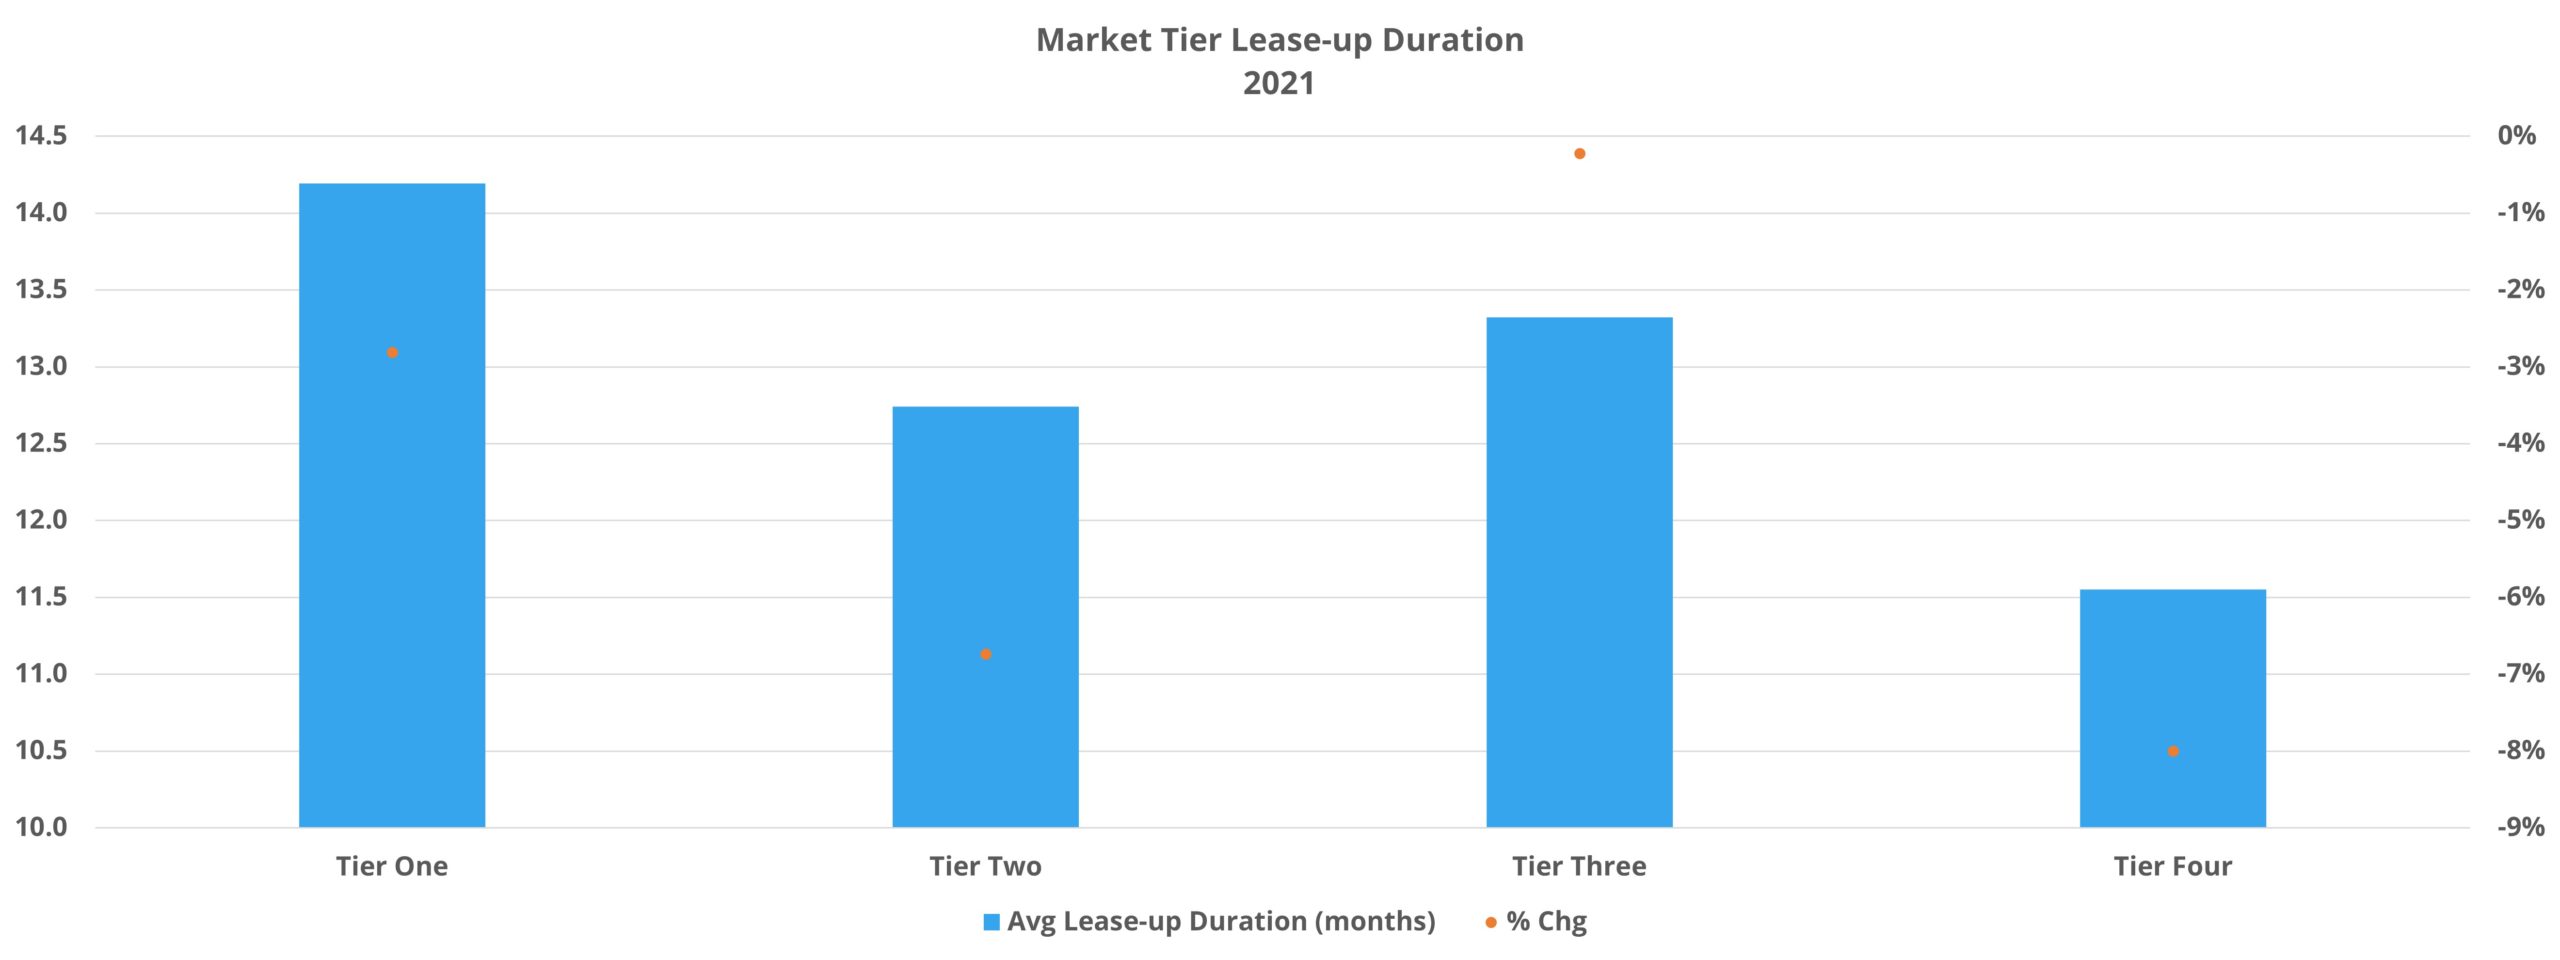
Over the last handful of years, the largest markets have consistently seen the longest lease-up times, thanks mostly to their high volume of new development. The smallest markets have tended to have the shortest lease-up times due in part to a relative lack of regular new supply. For properties stabilizing thus far in 2021, that trend has remained intact. One factor has been that the rapid market increases in total units to complete lease-up has been a dynamic almost entirely experienced in the largest markets.
The average lease-up time for properties to stabilize this year in Tier One markets was 14.2 months – a 3% reduction from 2020 despite a 30% increase in the total number of units to stabilize in the period. Tier Two markets managed a 7% decrease from last year in the average lease-up time with an average of 12.7 months for properties that have stabilized in 2021. Tier Three markets were a bit higher at 13.3 months, essentially even with 2020, while the smallest markets clocked in at 11.6 months after an 8% decline in the average from last year.

NAA Regions View
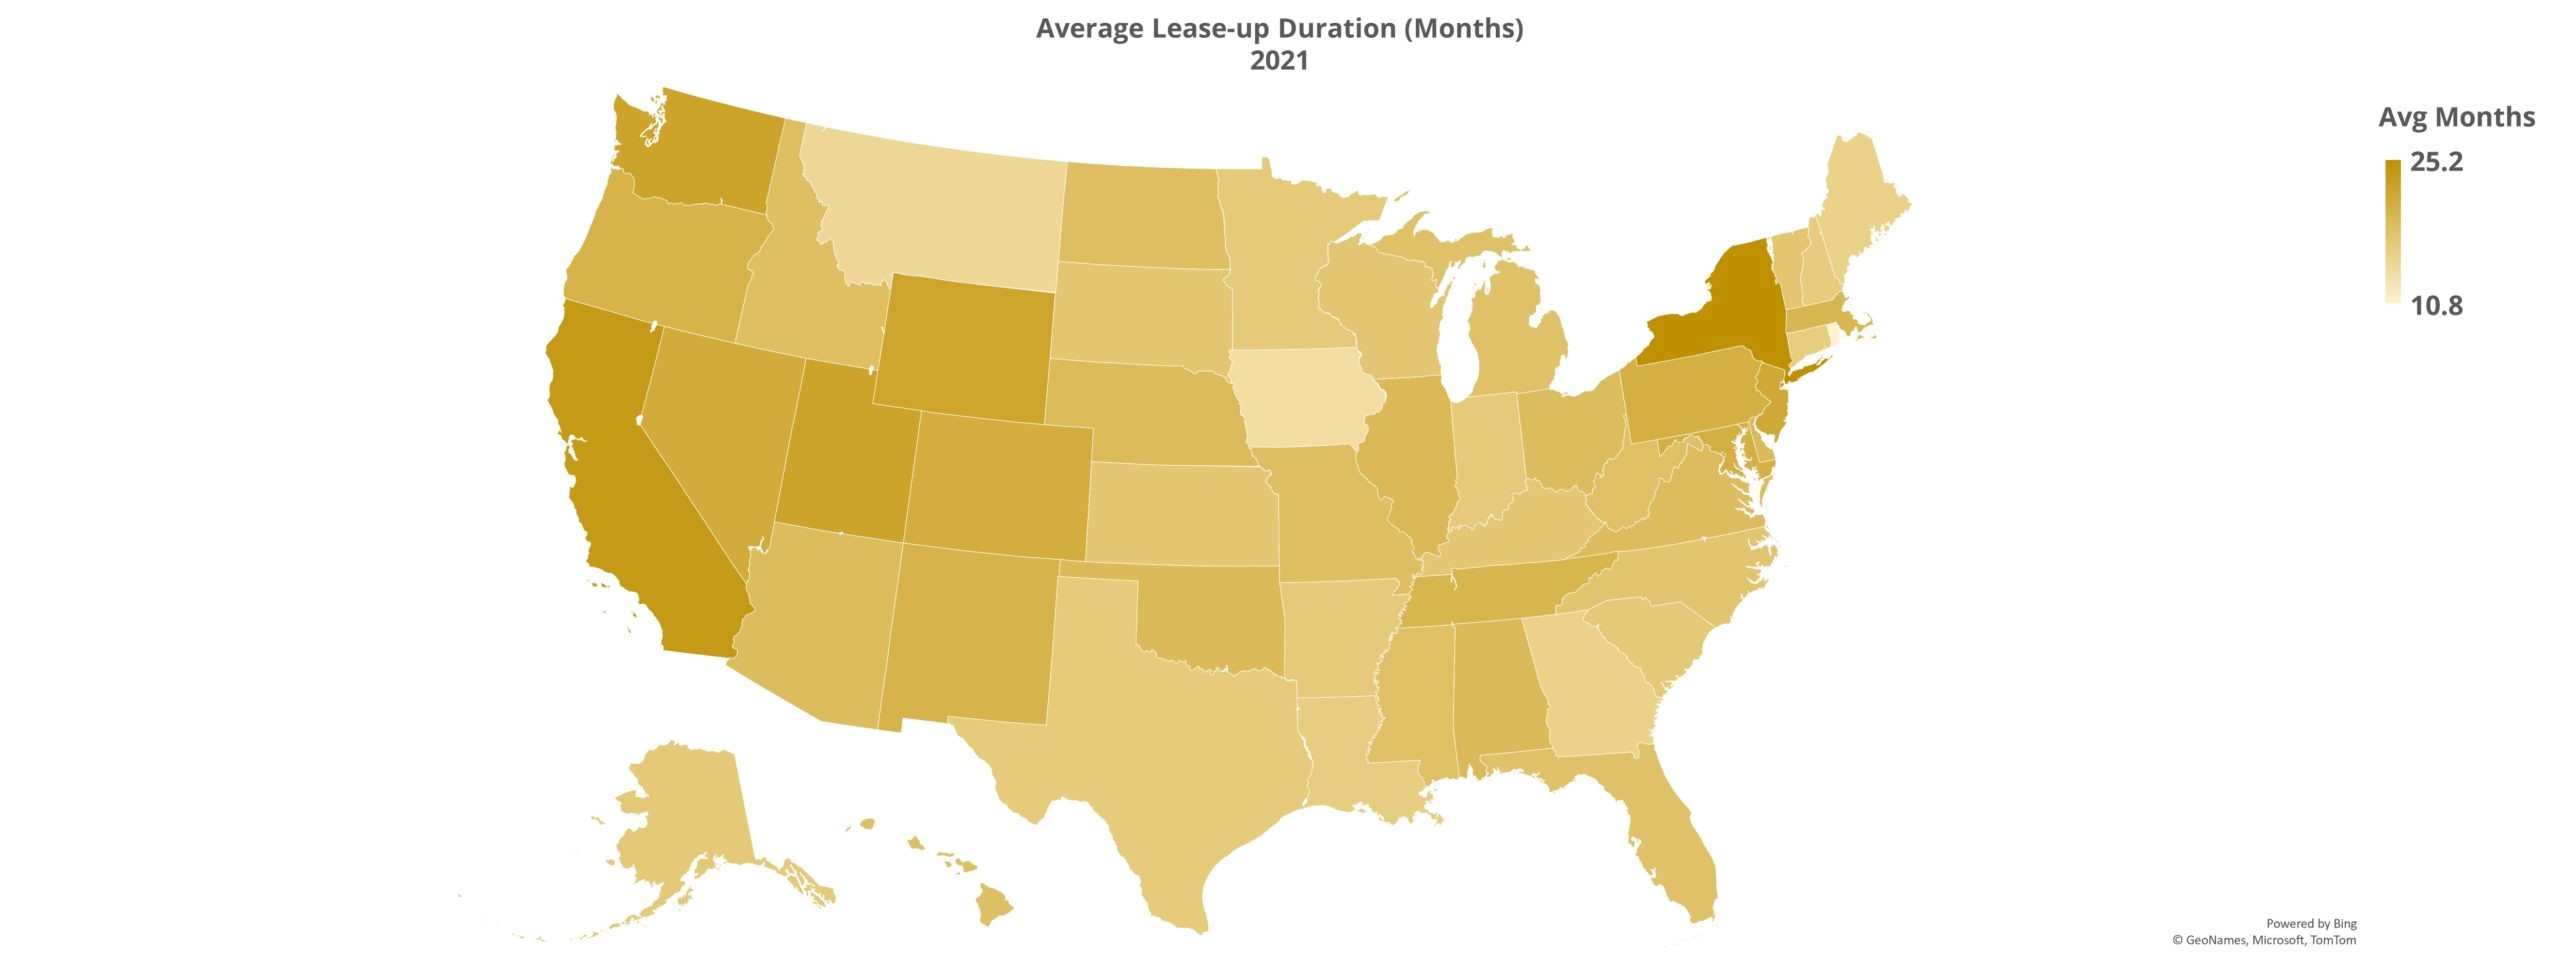
For the sake of familiarity, we use NAA regions at ALN for a regional perspective. Two regions in particular stand out with especially low average lease-up times. Region One, an area that includes Washington DC, Virginia, Maryland, West Virginia, Delaware, and Pennsylvania had the lowest average as of the end of October at 12.8 months.
Of those, DC and Delaware had the highest averages, 15.4 and 17.4 months respectively, while West Virginia’s seven-month average was the lowest for the region by a wide margin. It should be noted, however, that West Virginia’s average was based on very little activity. Virginia, with 66 newly stabilized properties, was the leader in terms of volume and managed an average of only 12.7 months.
Region Nine was the other portion of the country with an especially low average – 12.9 months for properties that stabilized in 2021. This region includes the Gulf states of Alabama, Florida, Louisiana, and Mississippi. Results here were largely driven by Florida, which had four times more properties reach stabilization through October than the remaining states combined. The average lease-up duration for the more than 200 Florida properties to stabilize so far this year was 12.8 months. Alabama, with the second most properties in the data set for the region at almost 30, had the highest average lease-up time at 13.9 months.

On the other end of the spectrum, Region Two and Region Five have the highest average lease-up duration this year. Region Two, an area covering Connecticut, Massachusetts, Maine, New Hampshire, New Jersey, New York, Rhode Island, and Vermont had the highest average at the end of October with 15.2 months. Massachusetts, New Jersey, and New York particularly drove the results.
Massachusetts and New Jersey each accounted for about 40 properties to reach stabilization this year and each had an average lease-up duration of just above 15 months. For New York, about 50 properties have stabilized so far in 2021 with an average lease-up time of 16 months.
Region Five, an area including Iowa, Kansas, Nebraska, Missouri, and Oklahoma, had the second highest average at 14.7 months to end October. Iowa and Oklahoma have each been below the national average at about 12.5 months in average lease-up duration. The region was skewed up partially by the 18-month average in Kansas based on a sample size of 12 properties that have stabilized this year, but mostly by the 15-month average derived from 31 properties in Missouri.
Market View
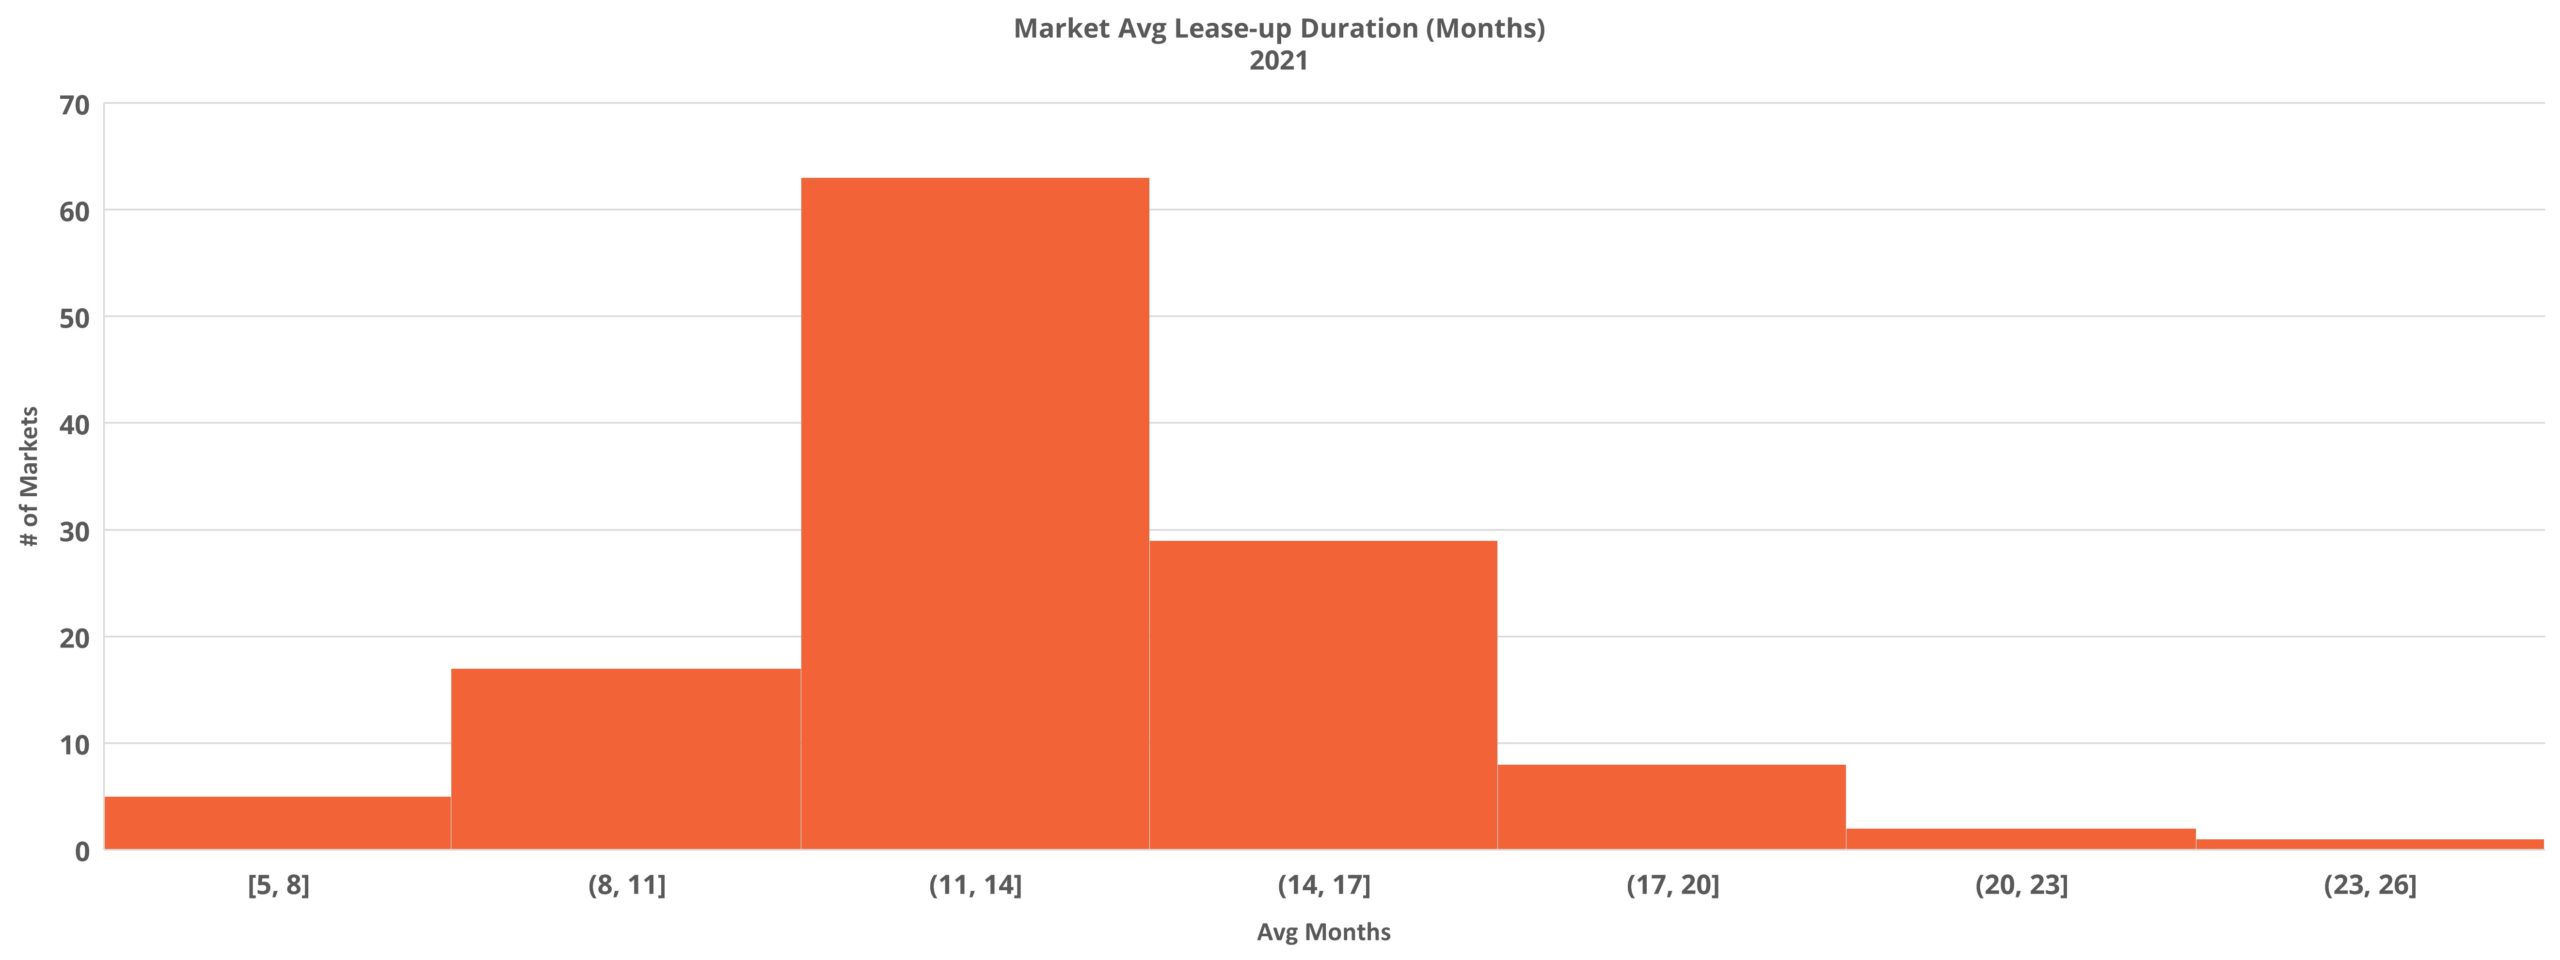
Small markets like Lufkin, TX, Lake Charles, LA, and Wichita, KS boast the shortest average lease-up time, each at seven months or less, but based on very few units. Among larger markets, Miami and Fort Lauderdale each averaged about 11 months to complete a lease-up based on around 8,000 and 6,000 units respectively achieving stabilization. For markets with at least 10,000 units to reach stabilization this year, Phoenix and Tampa were the leaders, at 12.9 and 13 months respectively. Washington DC was just behind at 13.3 months.

On the other side of the coin, there were markets well above the national average. For example, Pittsburgh averaged 26 months for lease-up duration among properties to stabilize this year. Similarly, South Bend, IN and College Station, TX were each above 20 months at the average. Moving to markets with a larger number of units to reach stabilization this year, Kansas City and Charleston, SC were much slower than the national average at 17.8 and 15.4 months respectively.
Markets with more than 10,000 units to stabilize in 2021 that lagged the national average by a significant margin include areas with a significant quantity of new units in recent years. New York properties averaged 16 months, calculated from about 13,000 units to complete lease-up this year. Houston, with almost 25,000 units completing the lease-up phase, and Austin, with just less than 20,000 units reaching stabilization, each had an average lease-up duration of 15.3 months.
Takeaways
An apartment demand wave not seen in decades that began in the back half of 2020 and has continued through this year has made its impact felt across a variety of multifamily performance metrics, including rent growth and lease concession retreat. One other area of impact has been in the average lease-up time for new properties. Construction times continue to climb, but for the first time in more than five years, average lease-up duration has decreased. The decline has been slight, less than 5%, but it has come even as the upward trajectory in new deliveries has continued units to the overall lease-up pool.
In the larger markets, healthy demand paired with a high volume of new units led to an average duration lower than in previous years, but higher than in smaller markets. Smaller markets, without the same pressure from a steady flow of new units, managed to pace the field from a market tier perspective while also realizing a decline in lease-up time.
From a regional and market-level standpoint, areas like New Jersey and New York that struggled more than some other areas in 2020 continue to lag in terms of lease-up velocity. With New York specifically, a very active construction pipeline has a lot to do with that. Though there was not space to go into further detail, states like Florida, Georgia, and Texas were well-represented near the top of the list for shortest average lease-up duration at the market level, as well as areas like Southern California and certain Mountain West markets like Boise.
Much uncertainty remains in the broader economy looking forward to 2022, but for multifamily lease-ups, the environment this year has generally been a friendly one.
Search, Analyze & Compare
ALN OnLine is a web portal that allows our clients to search properties, access submarket and markets trends, new construction, and more. Since 1991, we have continued to refine our business practices and methodology in order to offer our clients the absolute best in multifamily data.

Disclaimer: All content and information within this article is for informational purposes only. ALN Apartment Data, Inc. makes no representation as to the accuracy or completeness of any information in this or any other article posted on this site or found by following any link on this site. The owner will not be held liable for any losses, injuries, or damages from the display or use of this information. All content and information in this article may be shared provided a link to the article or website is included in the shared content.

