

How Have Stabilized Properties Fared This Year?
How Have Stabilized Properties Fared This Year?
A quick perusal of the ALN blog will reflect a wide range of perspectives from which multifamily performance has been evaluated this year. Apartment demand, the tracking of national average occupancy, market-level rent growth leaders, and a look at price class differences represent a sampling of those perspectives from the last few months. However, one important angle that has not been addressed since last summer is a specific look at stabilized properties.
View the full monthly Markets Stats PDF
In the current environment, when the multifamily industry is in the midst of a construction boom of a scale not seen in decades, isolating only stabilized properties for analysis is particularly relevant. Not only to get some indication of the impact that new supply is having on existing stock, but also because the volume of new units entering the market means that the gap between overall national metrics like average occupancy and the stabilized-specific version of the same metric is especially wide.
For the purposes of this month’s newsletter, included stabilized properties will be those that entered 2023 already stabilized. As usual, all numbers will refer to conventional properties of at least fifty units.
Takeaways Episode 45
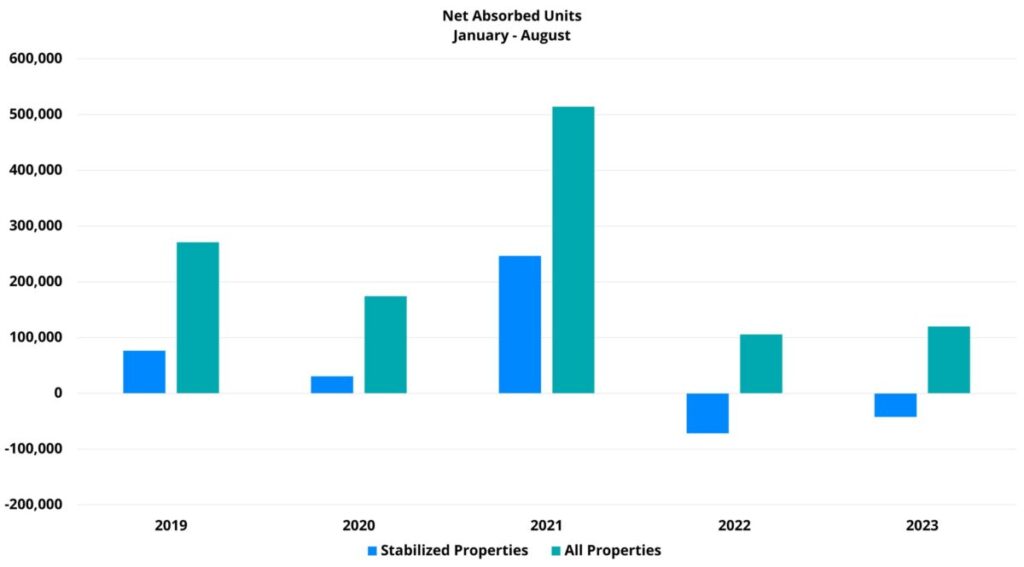
Net Absorption and Average Occupancy
For context, about 330,000 new multifamily units have been delivered across the country this year through August. That delivery volume exceeded last year through the same period by more than 100,000 units – and last year was a very active year for multifamily deliveries in its own right. Net absorption has fallen short of new units delivered by a margin of just more than 200,000 units. The result has been a 160-basis point decline in overall national average occupancy down to 90% to close August. This considerable erosion has come after national average occupancy had already been in steady decline since late 2021.
For properties that entered 2023 having already stabilized, there are both similarities and differences compared to the overall national trends. One similarity has been that despite apartment demand being poor this year, it has at least been a bit better than through the same portion of last year. In the case of stabilized properties, last year’s net loss of more than 70,000 leased units through August has been followed up this year by a net loss of only about 42,000 leased units. Nonetheless, it should be pointed out that no recent year other than 2022 featured a net loss of leased stabilized units this deep into the calendar – including 2020.
Another similarity between all properties and the stabilized-only basket of properties has been the notable decline in average occupancy from their respective peaks, though the scale has been different. Overall national average occupancy peaked at about 94% in the back half of 2021, and average occupancy for properties that entered the year stabilized peaked at approximately 96% around the same time. As already mentioned, in the time since, overall national average occupancy has declined to 90%. For stabilized properties, average occupancy closed August at just over 93%.
Average Effective Rent and Lease Concessions
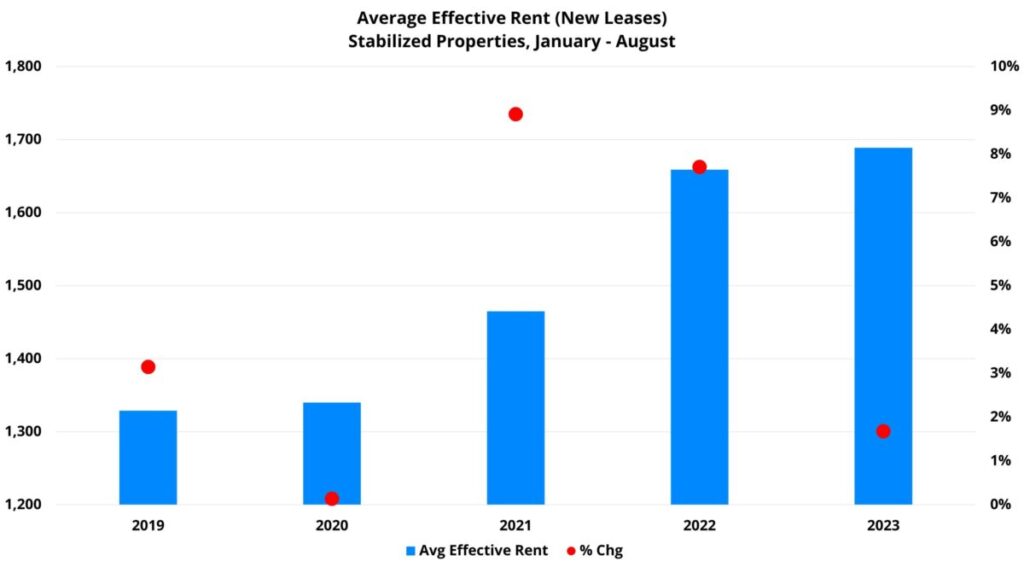
Average effective rent growth for properties to enter the year stabilized has been predictably muted relative to recent years. Last year’s lackluster demand was mitigated by still-high average occupancy thanks to the levels reached in 2021. After a steady decline in the intervening period, the same aid from average occupancy has not been in place this year.
Average effective rent growth ended August at just below 2%. This brought the average stabilized unit to $1,689 per month – a little more than $200 above the average from twenty-four months ago. Despite struggles on the demand front, including negative monthly net absorption in five of eight months this year, average effective rent growth has remained above zero all year so far. Even so, July and August each featured a slowdown in rent growth so that August change came in at less than 0.1%.
Lease concession availability among stabilized properties ended August higher than at any point since early 2021 when concessions were still retreating from their 2020 levels. Around 13% of conventional stabilized properties were offering a discount for new residents at the end of August – an increase of 25% from the start of the year. This year’s surge in availability has even outpaced the 17% rise from the same portion of 2020.
An important caveat to this sharp increase in concession availability is that the average discount value being offered has decreased compared to the start of 2023. A 6% decline brought the average discount for a new annual lease to just over 5%, or approximately two and a half weeks off an annual lease. This average value is right in line with the same average from August of 2019 and well below the 2020 and 2021 August values of more than 6%.
Takeaways
The effects of a very active new construction pipeline reverberate far and wide throughout the multifamily industry. In the case of stabilized properties, new units being brought to market constitute fresh competition for residents. In an environment in which apartment demand has been consistently below the level of new supply, the effect of that competition on performance metrics like occupancy and rent become more pronounced.
The good news for stabilized properties is that demand this year has outpaced last year’s, monthly average effective rent growth has been positive all year, and average occupancy remains above 93%. The flip side of that coin is that net absorption has been negative through August, rent growth has been lower than in any recent year aside from 2020, and average occupancy has not improved in any month for more than a year.
With student loans set to resume next month, macroeconomic headwinds remaining, and the usually softer portion of the calendar ahead for multifamily – it is likely that demand, occupancy, and rent growth performance through August for stabilized properties will be more positive than the final year-end results.
The Key to Data-Driven Decisions
Unlock unparalleled insights with our comprehensive platforms. Schedule your personalized demo and witness the power of accurate, reliable multifamily data today!
Disclaimer: All content and information within this article is for informational purposes only. ALN Apartment Data makes no representation as to the accuracy or completeness of any information in this or any other article posted on this site or found by following any link on this site. The owner will not be held liable for any losses, injuries, or damages from the display or use of this information. All content and information in this article may be shared provided a link to the article or website is included in the shared content.