

The Bottom for Occupancy Not Yet in Sight
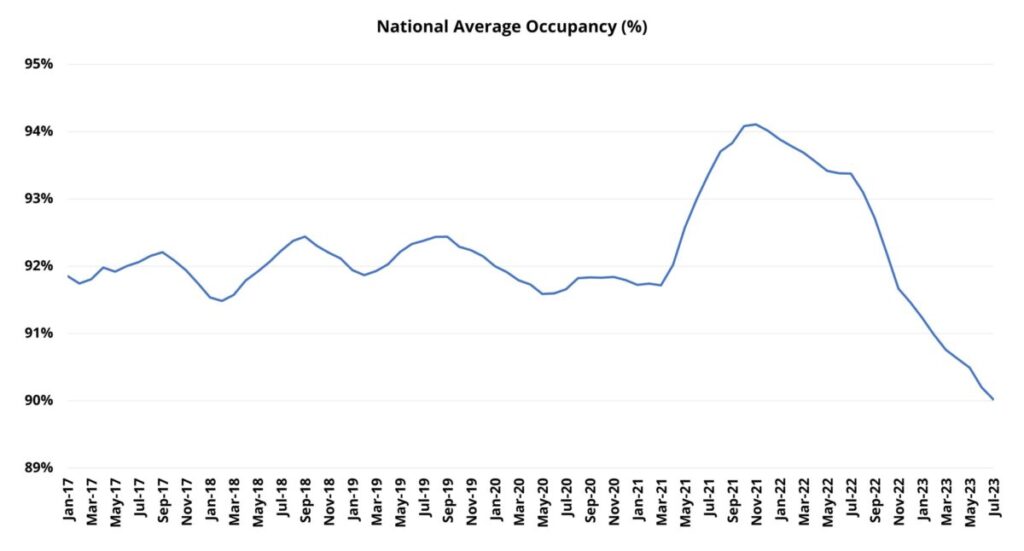
After an incredible climb between March and November of 2021, national multifamily average occupancy is now in the midst of an almost two-year decline that has more than offset the gain from 2021. During the initial period of the decline, occupancy played an important role in helping rent growth to maintain its momentum through much of 2022. This occurred as unusually high occupancy, while slowly being whittled away, remained for long enough in 2022 to mitigate the effect of poor demand and an active new construction pipeline.
New units delivered outpaced net absorbed units by more than 300,000 new units last year. And yet, it took until the fourth quarter for national average occupancy to return to the pre COVID-19 pandemic level of early 2020. The occupancy cushion provided by a peak in late 2021 that was three hundred basis points higher than the pre-COVID national occupancy rate was a much needed flotation device for the industry last year.
ALN’s monthly newsletter from December of last year provides a deeper look at this history and is worth a revisit for some important background context. In it, a point was made that because 2023 new supply was already largely baked in by late 2022, any material improvement in the national occupancy trend would depend upon an improvement in apartment demand. Due to the seasonality of the industry, the spring and summer months of 2023 provided the best hope for such an improvement – certainly more so than the winter period of late 2022 and early 2023.
Given that it is now August, the current moment is the perfect opportunity to revisit the occupancy data. As always, numbers will refer to conventional properties of at least fifty units.
View the full monthly Markets Stats PDF

Takeaways Episode 45
National Context
As with the last look at the topic, the best place to begin is with the national data. October of 2021 was the last month in which national average occupancy rose. Since then, there have been three months with no change, the most recent being June and July of last year, and eighteen months of decline. In the first seven months of 2023, national average occupancy has fallen by 1.5% – more than double the decrease from the same portion of 2022. For some additional context, the total 2022 decline was 2.7%.
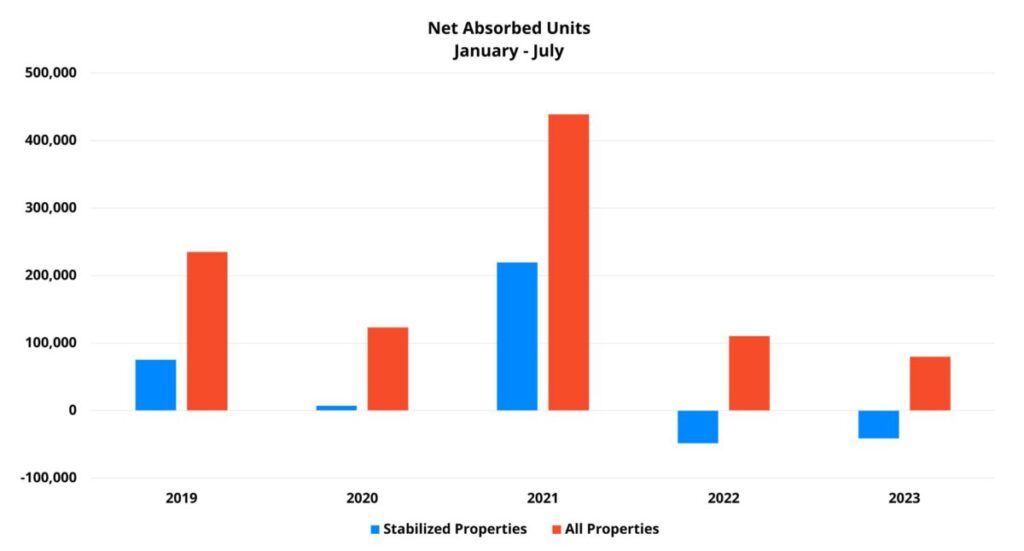
In 2022, the new construction pipeline continued its blistering pace in the back half of the year while monthly net absorption turned negative from August through November. This year not only has demand consistently underperformed 2022, but the new construction pipeline is set to deliver considerably more units. Approximately 300,000 new units have been delivered through July, with at least 200,000 more expected to be delivered before the end of the year.
Given apartment demand performance so far this year, the eroding financial position of consumers, macroeconomic headwinds, and the return of student loan payments in October, it seems unlikely that the last five months of 2023 will represent a marked improvement in net absorption relative to the finish to 2022.
With national average occupancy finishing July right at 90%, this year is poised to close below the 90% threshold. How far below will depend on net absorption performance. Last year, national net absorption through July stood at around 110,000 units and ended the year at approximately 50,000 units after the monthly losses from August through November. This year, even without a repeat of negative net absorption to finish the year, average occupancy could struggle to stay above 88%.
Overall Average Occupancy vs Stabilized-Only Average Occupancy
When reporting average occupancy, ALN includes both stabilized properties and properties in lease-up, as well as all price classes. Consequently, ALN’s reported average is often lower than numbers reported elsewhere.
Including lease-up properties naturally lowers the average, but arguably provides a more accurate picture of the market. It is true that, given time, lease-up properties will stabilize, and their previously low average occupancy will more closely resemble the typical existing property. But it is also the case that recently stabilized properties have other properties just behind them in the pipeline that will be entering the market and will themselves be in a lease-up phase.
Also, isolating only the stabilized property average does not reflect the competition between the two groups. With a finite number of prospective residents, new properties fill up due to household creation, population growth, or by earning residents from existing properties. For operators in the market, the average occupancy for properties to enter the year already stabilized may have ended July at 94% – but that does not reflect the full picture with competition heating up with recently delivered stock. Indeed, national net absorption for those properties to enter 2023 already stabilized was negative by more than 41,000 units through July.
Same Destination, Different Route
Breaking down the national data by market size brings some interesting findings. For one, the average occupancy as of the end of July was strikingly similar for primary, secondary, tertiary, and micro markets when grouped into those four categories. Each finished with half a percent of 90% on either side of the threshold. The primary, secondary, and micro market groups were each a hair below 90% while the tertiary market group managed to finish July just above 90%.
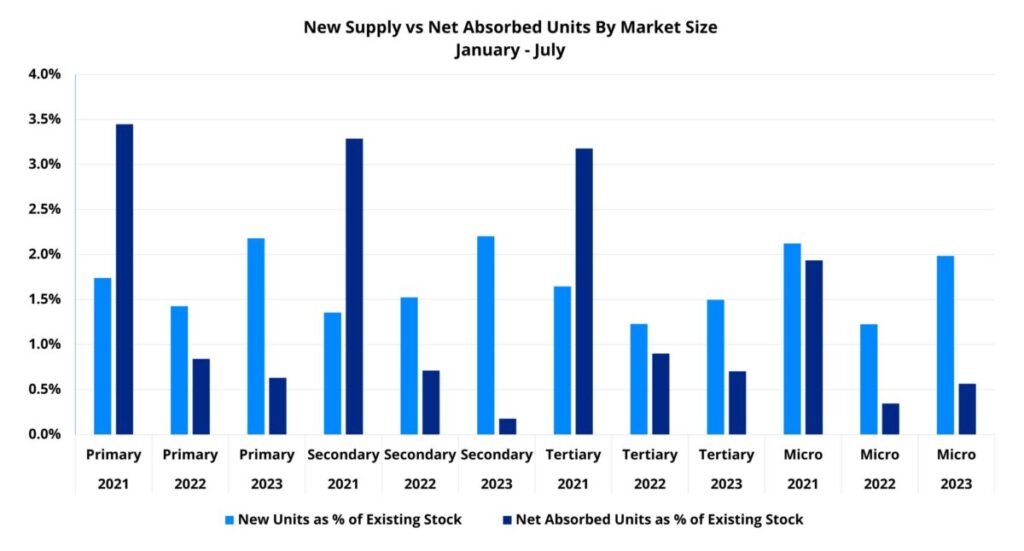
Another interesting aspect of the data was how similar the volume of new supply has been once a size adjustment is made. New deliveries through July accounted for between 1.5% and 2.2% of existing stock for each of the four groups. Unsurprisingly, the tertiary market subset – with the highest average occupancy – had the lowest share of new units to existing units at 1.5%.
The difference has emerged once layering in size-adjusted demand. For the primary and micro market categories, a 160-basis point decline in average occupancy so far this year came with new supply as a share of existing stock of around 2% and net absorbed units as a share of existing stock of 0.6%. Tertiary markets benefitted from the lowest size-adjusted new supply volume at 1.5% and also from the highest size -adjusted demand result with net absorbed units representing 0.7% of existing units.
On the other end of the spectrum, secondary markets experienced the largest average occupancy decline in the period with a loss of just more than 2%. This came after that group saw new supply just above 2% of existing stock while net absorbed units accounted for only 0.2% of existing stock. In other words, these markets saw the most pronounced new supply pressure once adjusted for market size, and also experienced the most pronounced size-adjusted demand shortfall.
Takeaways
Stated simply, multifamily average occupancy is in the midst of an extended slide and the ride is not yet over. There are other relevant perspectives that could not be addressed here for the sake of space. Specifically, market-level variance and differences among properties of different sizes. These are topics that will be addressed in the upcoming Takeaways video series episode that accompanies each newsletter release.
The industry faces a two-fold challenge at the moment. The first is that new supply is creating much of the downward pressure on occupancy and the new construction pipeline will not be slowing deliveries until at least 2025. Most of the properties set to be brought to market this year and next have already broken ground.
The other is that a level of new supply not seen in decades is being paired with apartment demand that has been well below the norm for almost two full years – and counting. As with the glut of new supply, there is not much reason to expect relief on the demand front in the near term. Some of the myriad issues facing multifamily demand were mentioned earlier and have been discussed thoroughly in previous newsletters and blog posts. Just accounting for the seasonal component of multifamily demand would indicate that the modest improvement in the spring and summer period is likely winding down with the typically softer fourth and first quarters still ahead.
Given these dynamics, the industry is almost certain to see national average occupancy dip below 90% in the next couple of months. Without a crystal ball no one can say for sure how long occupancy will stay in sub-90% territory, but there is certainly plenty of reason to think it will not be a fleeting visit.
Disclaimer: All content and information within this article is for informational purposes only. ALN Apartment Data makes no representation as to the accuracy or completeness of any information in this or any other article posted on this site or found by following any link on this site. The owner will not be held liable for any losses, injuries, or damages from the display or use of this information. All content and information in this article may be shared provided a link to the article or website is included in the shared content.