

Examining Price Class Differences as Low Demand Persists
Apartment demand remains in the doldrums despite moderate improvement in recent months. Across price classes, net absorption through May has resembled that of the same portion of 2020 – at best. Average occupancy across the price classes finished May at the lowest point of the last five years for the month. And yet, rent growth has generally not receded to the same degree.
All numbers will refer to conventional properties of at least fifty units for year-to-date figures through May.
View the full monthly Markets Stats PDF
Net Absorption and Average Occupancy
Of the four price classes, only Class D was in negative territory for net absorbed units through May. A net loss of a little more than 13,000 leased units was the worst performance for this subset of properties in the last five years. This period included the net loss of around 4,800 leased units in the same portion of last year and net absorption of only about 7,000 units in the first five months of 2020. As a result of this year’s loss, average occupancy for the Class D group fell by 0.8% to finish at a little above 92%. As with demand itself, this average occupancy was the lowest of the last five years for May for a group more accustomed to average occupancy in the 94-96% range.
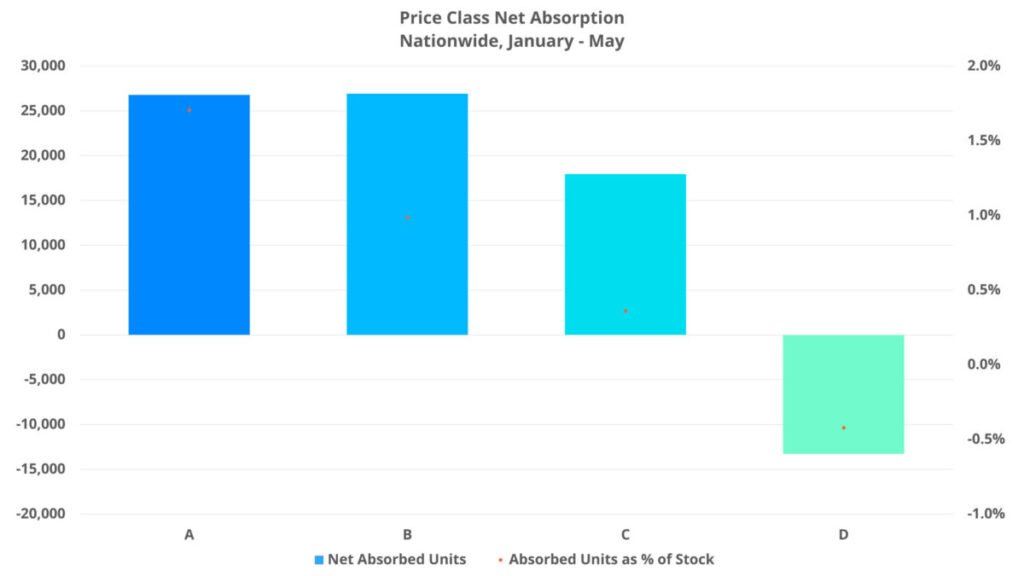
On the other end of the spectrum, the Class A group managed net absorption of nearly 27,000 units in the period. This did at least surpass the corresponding 2020 total but was not enough to offset nearly 75,000 new units delivered. The almost 3% decline in average occupancy that resulted from new supply outpacing absorption by such a wide margin was the largest occupancy decline of any price class in the period. It was also the worst decline for the first five months of the year for any recent year.
From a demand perspective, the two middle price tiers found themselves in between the highwater mark of the Class A group and the trough of the Class D group. Net absorption of approximately 27,000 units for Class B properties was also an underperformance relative to last year but was at least higher than for the same period in 2020. Class C properties added only about 18,000 net leased units so far this year. This was more than in 2020 by a paper-thin margin but was also more than last year’s roughly 11,000 net absorbed units. Each of the two middle price tiers finished May with average occupancy slightly above 92%.
Average Effective Rent and Lease Concessions
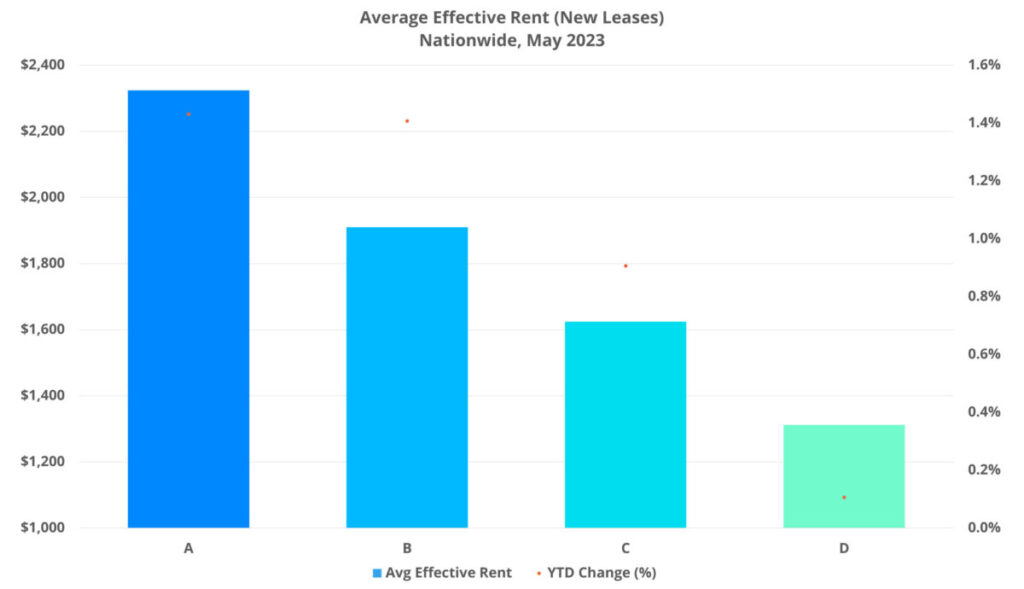
After adjusting for the difference in total units between the Class A and Class B groups, Class A net absorption was nearly twice that of the Class B group. Despite this, average effective rent growth for new leases through May was equal between the two. Each added about 1.4% to the average. Given the current environment for the industry, such a gain was not one to be sneezed at.
After keeping pace with the top two tiers through this portion of the calendar for the last few years, rent growth in the workforce housing segments has especially cooled this year. A 0.9% gain for Class C units was the lowest since the first five months of 2020. For Class D, a 0.1% gain was the lowest of the last five years – including the 0.9% appreciation from 2020.
When it comes to lease concessions, only Class A has seen a decline in availability in recent months. The decrease was a small one, less than 3%, but the remaining three tiers each had notable increases. May ended with around 17% of Class A properties offering a discount for new leases. For the Class B subset, a 10% increase in availability from the start of the year meant that the period ended with around 15% of properties offering a lease concession for new residents.
Within the Class C and Class D groups, a murkier demand picture resulted in more pronounced moves toward discounts despite overall availability remaining lower than in the top two tiers. An increase of just more than 20% in availability brought the share of Class C properties offering a lease concession to about 13%. Class D properties saw an almost 50% increase in discount availability so that approximately 11% of properties were offering a lease concession to close the period.
Market Notes
There were some particular pain points within the top two price classes. Seventeen markets around the country saw the average effective rent decline for Class A properties. For Class B properties, that number was thirteen. Tallahassee Class A led the way with a 6% decline in average effective rent, followed by a nearly 4% decline in Albany, Georgia. For Class B, a 4% decline in both Amarillo, Texas and Evansville, Indiana were the largest declines in the period.
As would be expected given the lower averages at the group level, there were significantly more markets around the country to see negative effective rent growth in the period within the bottom two price tiers. For Class C, the number was twenty-five markets. Smaller markets such as South Bend, Indiana, Honolulu, and Boise led the way with losses ranging from 2% to nearly 6% for South Bend. Larger markets like Portland, Las Vegas, and Austin were near the top of the list as well with declines of between 1% and 1.5% for each.
For Class D properties, fifty markets suffered negative rent growth through May. Arizona and Nevada were well-represented at the top of the list. Tucson, Flagstaff, Las Vegas, Austin, and Phoenix each lost around 3% in average effective rent and a 2% decline in Reno was seventh highest of any market for Class D.

Takeaways Episode 45
Takeaways
One aspect of price class performance so far this year that jumps out of the absorption data is that to the extent that 2023 has seen better net absorption than in any recent year, it has only been better than in 2020. This puts into context just how widespread the tepid apartment demand has been so far this year after what was a down year in 2022.
For Class A and Class B, the subsets that predominantly deal with new supply, the back half of the year is likely to bring further challenges. With more than 500,000 new units expected to be delivered in 2023, a deluge of deliveries will be paired with the seasonal softening for the industry that generally occurs around October as well as the presumed resumption of student loan payments in September.
Rent growth has been harder to come by across the board than in any year since 2020. For the workforce housing segments, lower average occupancy and a lack of new units to push the average up would seem to preclude a significant jump in growth in the second half of the year. For Class D in particular, the question now is more around whether annual net absorption can get above zero. That outcome appears increasingly unlikely.
The challenges facing the industry vary by price class, but one common thread has been persistently low demand relative to the long-term average. The spring months did show some improvement, but the summer will need to bring with it another jump in absorption to offset what is likely to be a challenging fall and winter period to end the year for each price class.
Disclaimer: All content and information within this article is for informational purposes only. ALN Apartment Data makes no representation as to the accuracy or completeness of any information in this or any other article posted on this site or found by following any link on this site. The owner will not be held liable for any losses, injuries, or damages from the display or use of this information. All content and information in this article may be shared provided a link to the article or website is included in the shared content.
Empower Your Budgeting Process with Accurate Multifamily Data
Making data-driven decisions is no longer an option – it’s a must. From on-site personnel to Owners (and everywhere in-between), we offer platforms designed to help multifamily professionals gain valuable insights into market trends and behavior, property performance, and more.