Apartment Demand Was a Positive in 2024
Incredibly, another year is about to be in the books. The massive quantity of new multifamily supply this year was arguably the headline metric for 2024. Right behind, though, would be the substantial improvement in apartment demand. This year continued an upward trend that began in 2023, but on a more impressive scale.
All numbers will refer to conventional properties of at least fifty units. Price class represents the current classification for properties.
View the full monthly Markets Stats PDF
National Apartment Demand
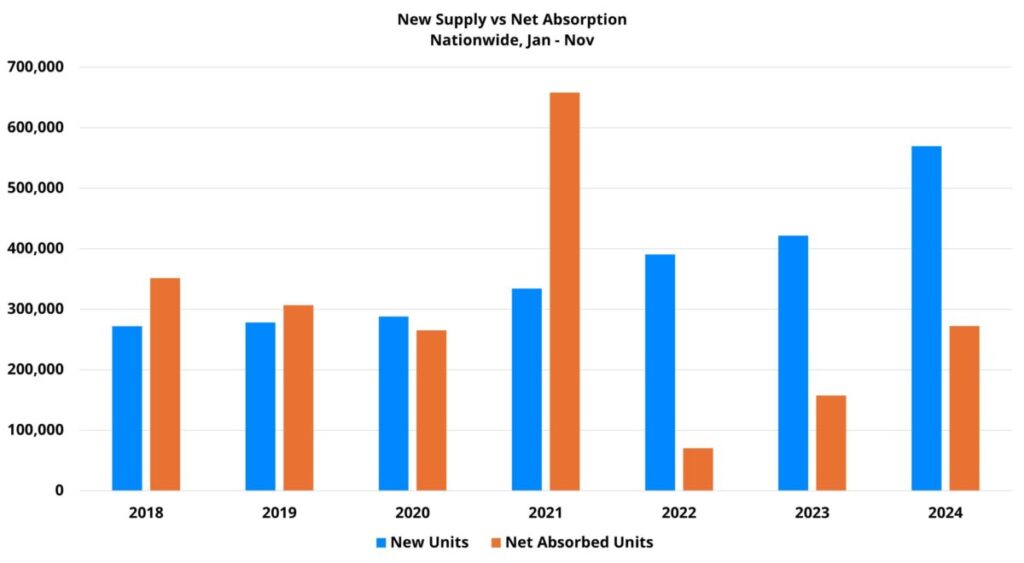
Through November of 2022, national net absorption totaled an anemic 70,000 units. That level of demand provided the trough for the 2020 through 2024 period. In 2023, notable improvement brought national net absorption to about 157,000 units through November. In the same portion of 2024, that total rose 73% to approximately 272,000 net units.
While the improvement over the last two years has been impressive in its consistency and scale, it is worth pointing out that this year’s net absorption was lower than in 2018 and 2019. That is despite conventional multifamily stock in those years being lower than in 2024 by more than two million units. This is a reminder of the sheer scale of new supply in recent years, but also that further ground remains to be made up on the apartment demand front.

Apartment Demand by Price Class
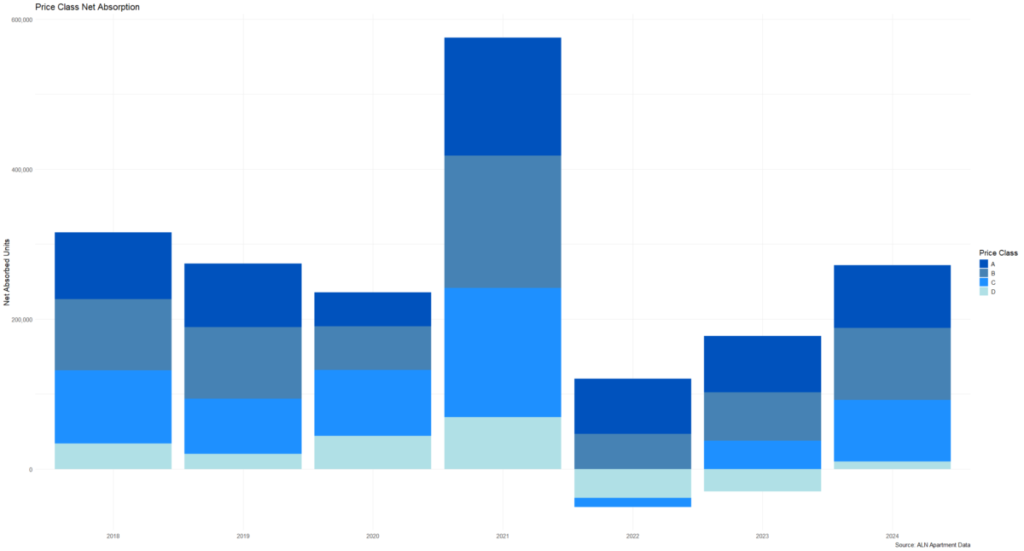
An aspect of demand performance this year that has been encouraging has been the broad-based nature of improvement across price classes. Each of the four price tiers has improved year-over-year. Furthermore, all but Class D have essentially returned to their pre-pandemic levels.
Class A net absorption this year rose to just more than 83,000 units compared to around 75,000 net units in the same portion of 2023. This year’s total was only about 2,000 units below the 2019 value. Similarly, Class B net absorption this year topped 95,000 units after managing only roughly 65,000 units through November of last year. This year’s Class B demand almost exactly matched 2019.
The improvement from last year has been even more robust in the workforce housing segments. Net absorption for the Class C subset of more than 83,000 units this year more than doubled last year’s approximately 37,000 units. Class C absorption this year was also higher than in 2019 – unique among the price classes. For Class D, net absorption of around 9,500 units through November was well below the 2019 total of about 19,500 units. Even so, this year represented a strong rebound from the net loss of 30,000 leased units in the same period of 2023.
In the ALN newsletter from this time last year, attention was drawn to lackluster demand for Class C and Class D properties. One question posed was whether these segments could manage demand improvement without negative rent growth.
Class C rent performance has been stronger this year than last alongside the surge in absorption. For Class D, average effective rent growth for new leases this year was at 0% to close November. The likelihood is for a small decline once the annual figure is in for 2024, but it will have come with serious improvement in demand.

Regional Demand Differences
The Sunbelt continued its dominance this year for multifamily demand. Ten of the top fifteen markets in net absorption year-to-date were Sunbelt markets, including all of the top six markets. Those leaders were Dallas – Fort Worth, Los Angeles – Orange County, Atlanta, Houston, Austin and Orlando.
When adjusting for market size by calculating net absorbed units as a share of existing conventional stock, the Sunbelt remained a standout. Nine of the top fifteen markets in the size-adjusted metric were in the Sunbelt – led by Abilene, TX and Myrtle Beach, SC. The Mountain West was also well represented with areas like Boise, Rapid City, and Salt Lake City among the demand leaders.
As was mentioned in a recent newsletter, the Great Lakes region has performed well on the rent growth front this year, but not generally because of leading apartment demand. No market in that region appears near the top of the list for net absorption or size-adjusted net absorption. For the former metric, Detroit was the top market in the region at eighteenth nationally. For the latter metric, Fort Wayne was the top market at twenty-fifth nationally.
A couple of Sunbelt states stood out this year even amongst a strong region for apartment demand. The first was Texas. As already mentioned, Austin, Dallas – Fort Worth and Houston were all among the national leaders in net absorption. Even San Antonio, the laggard of the state’s primary markets, was within the top twenty-five markets in net absorbed units. Smaller markets in the state such as Abilene and Victoria performed well on a size-adjusted basis.
The other standout state was North Carolina. Both Charlotte and Raleigh – Durham cracked the top ten markets nationally for net absorption through November. The smaller markets in the state were less consistent, but both major markets had a good year.
Takeaways
The most attention-grabbing development for multifamily performance this year was probably the historic new supply that is expected to represent the peak for this development cycle. However, the apartment demand picture has been no less important.
While some ground remains to be made up between this year’s net absorption and that of the last few pre-pandemic years, the industry has been on an encouraging trajectory. After bottoming out in 2022, multifamily demand has been on a steady two-year climb back up the mountain.
Another step in the right direction has been the workforce housing segments joining the recovery party. Last year, the bounce back in demand was really a feature of the top of the market while the Class D segment was still shedding leased units. This year, Class C and Class D apartment demand made major progress.
A significant shortfall between net absorbed units and delivered units was created over the last two years. New supply is expected to slow in 2025, but not by a drastic margin. Another year of growth in apartment demand would go a long way toward beginning to winnow that shortfall.
Let’s Talk About Multi-Family Data For Your Business
Unlock the power of multifamily data with insights tailored to drive your business forward—schedule a call with our experts today!
Disclaimer: All content and information within this article is for informational purposes only. ALN Apartment Data makes no representation as to the accuracy or completeness of any information in this or any other article posted on this site or found by following any link on this site. The owner will not be held liable for any losses, injuries, or damages from the display or use of this information. All content and information in this article may be shared provided a link to the article or website is included in the shared content.

