

Final Look at 2023 Price Class Performance
With 2024 right around the corner, it is the time of year to take stock of 2023 multifamily performance and what it may portend for next year. National apartment demand improved from 2022 but was not enough to offset a very active new construction pipeline and the result was a second consecutive year of average occupancy decline. Average effective rent growth remained positive but will finish the year at its lowest level since 2020 after massive gains in 2021 and 2022.
Of course, below the national metrics individual markets and segments of the industry featured very different results this year. One of the key perspectives below the national metrics where differences emerged was price class.
All numbers will refer to conventional properties of at least 50 units.
Class A
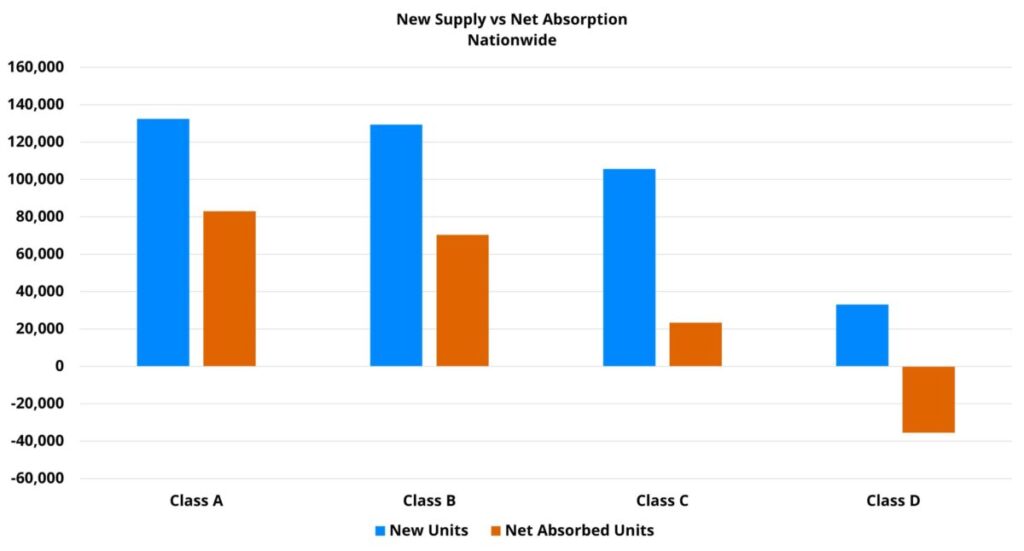
Properties operating at the top of the market saw the strongest demand in 2023. Net absorption of just over 83,000 Class A units around the country represented a modest improvement over the 2022 total of about 77,000 net units. Relative to the other price classes, Class A net absorption as a share of existing stock was the highest by a wide margin, but this top subset was the only price tier to not exceed its total from last year in the size-adjusted demand metric.
View the full monthly Markets Stats PDF
Nearly 133,000 new units delivered through November was the most new supply of any recent year in aggregate units. However, new units delivered as a share of existing stock was actually slightly below the average derived from the last five years. This reflected an important takeaway from 2023 – multifamily new construction activity was more geographically spread out and was therefore more distributed across the price classes than in past years.
A 2.4% decline in national average occupancy for Class A properties through November was smaller than last year’s 3% drop through the same portion of the calendar. Nevertheless, it made 2023 the third year of the last four to see average occupancy decline for the Class A segment. When considering only those properties that entered the year already stabilized, the decline was a much more modest 0.1% to just over 93%. The overall average occupancy rate for Class A properties closed November at 84%.
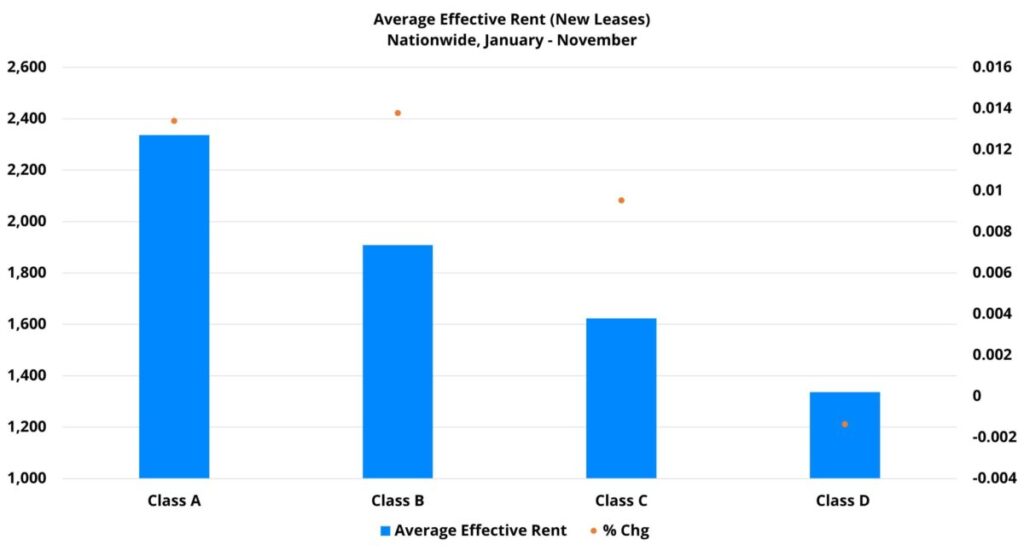
A 1.3% average effective rent gain so far this year was the lowest result since a 4% decline in 2020 and fell well short of the 7% gain from the same period in 2022. Part of the rent growth story was a double-digit increase in the availability of lease concessions for new residents.
Class B
New supply played more of a role for the Class B segment this year than in any recent year. Approximately 130,000 new units entered the market nationally in the price Class B range – equaling 4.7% of preexisting Class B stock. To add some context around this year’s new supply, the average over the last five years through November was 97,000 new units.
In the face of elevated deliveries, Class B net absorption improved over 2022 to a greater extent than was the case for Class A properties. Just over 70,000 net absorbed units marked a 47% improvement over the same portion of 2022. Interestingly, through the wild swings of the disruption of the COVID onset in 2020, the peak demand of 2021, the trough demand of 2022, and the notable improvement this year – the annual average for net absorbed units in the 2020 through 2023 period has been almost exactly the average from the 2017 through 2019 period.
Despite the increase in new supply, the 1.9% decline in average occupancy through November of this year was smaller than last year’s loss thanks to the improvement in demand. Class B average occupancy finished November at a hair under 89% – the lowest of any November in more than five years. For Class B properties that entered 2023 already stabilized, average occupancy finished the period a little above 93% along with the Class A group.
Rent growth was much harder to come by this year in the Class B space as well. A 1.2% gain through November was well short of last year’s increase of more than 7% and was the lowest of any year of the last five except 2020. The move toward concessions was even more pronounced than at the top of the market with an increase of 34% in availability.
Classes C and D
Because there was new supply in more outlying submarkets across the country, there were some properties that entered their markets with an average effective rent per square foot percentile rank outside the top one-third of properties – the cut off for Class A and Class B designations for ALN price class. As a result, the workforce housing segments saw an increase in new supply of about 25,000 combined units relative to last year.
In addition to unusual new supply, downward pressure on average occupancy was also due to soft demand for both of these price tiers. The issue was most acute for Class D properties. A net loss of around 36,000 leased units so far this year was only slightly better than last year’s net loss of about 40,000 net units. For Class C, about 23,000 net absorbed units was a notable improvement from last year’s loss of approximately 18,000 leased units.
A 1.7% decrease in occupancy brought the Class C average to 91% to close November. A 2.2% decline brought the Class D average to 91% as well. Each finished the month right around 93% for only stabilized properties. For both groups of properties, average occupancy ended the period lower than in any November in more than five years.
As would be expected, rent growth has been the most tepid within these price tiers. The Class C group managed to remain in positive territory with a 1% gain in average effective rent for new leases after an 8% jump in the same portion of 2022. Class D was the only price class to lose ground in the period with a small decline of 0.1%.
Lease concessions have become a major part of the story for these properties. An increase in discount availability of 67% for Class C properties this year resulted in the highest rate of availability since 2020. For Class D, a 92% increase brought the availability of new resident discounts to their highest point in more than five years – including the pandemic period.
Takeaways
One major throughline across the price classes in 2023 was the apparent effect of the most active new construction pipeline in decades. While Class A and Class B units bore the brunt of new multifamily supply, the workforce housing segments were not entirely unscathed. Despite improvement across the board in demand compared to 2022, average occupancy will finish 2023 in negative territory for all four price classes due to the new supply.
In terms of differences between the price classes, demand was clearly more robust for Class A and Class B properties. This translated to the rent growth side of the equation as well and was reflected in the smaller increases in lease concession availability.
Deliveries are not expected to slow much until 2025. Looking ahead to 2024, the new construction pipeline will continue to play a major role in industry performance. Class A and Class B properties will need to see continued improvement on the demand front to reverse the average occupancy losses of 2022 and 2023. For Class C and Class D properties, a question next year will be whether demand can continue to perk up without rent growth turning negative.
The Key to Data-Driven Decisions
Unlock unparalleled insights with our comprehensive platforms. Schedule your personalized demo and witness the power of accurate, reliable multifamily data today!
Disclaimer: All content and information within this article is for informational purposes only. ALN Apartment Data makes no representation as to the accuracy or completeness of any information in this or any other article posted on this site or found by following any link on this site. The owner will not be held liable for any losses, injuries, or damages from the display or use of this information. All content and information in this article may be shared provided a link to the article or website is included in the shared content.