

An Update on Rent Growth
After a tough winter for multifamily, the industry has come out the other side and now finds itself squarely within the spring and summer months. This portion of the calendar is typically a stronger one for apartment demand and for rent growth. Net absorption, while still low compared to historic norms, nonetheless improved in both March and April after spending seven consecutive months in negative territory. Much was made during the winter about the sharp downward move in rent growth and it continues to be a common topic of discussion.
All numbers will refer to conventional properties of at least fifty units.
Taking a Step Back
Before having a look at rent performance in the last few months and what might be expected through the remainder of 2023, it is helpful to take a step back and add some context to the current moment.
View the full monthly Markets Stats PDF
In the eighteen months from the start of 2021 through the first half of 2022, the national average effective rent for new leases rose by 22%. Extending that out to a two-year period to include all of 2022 brought that appreciation to 24%. In other words, within a two-year timeframe, rent growth was equal to between six and eight years of typical increase given a baseline of 3-4% annual growth.
The rent growth was widespread as well. This was not a case of a small subset of markets skewing the national average. On the contrary, of more than 140 markets across the United States, only three failed to top 10% average effective rent growth from the start of 2021 to the end of 2022. 65% of markets managed a 20% gain or more.
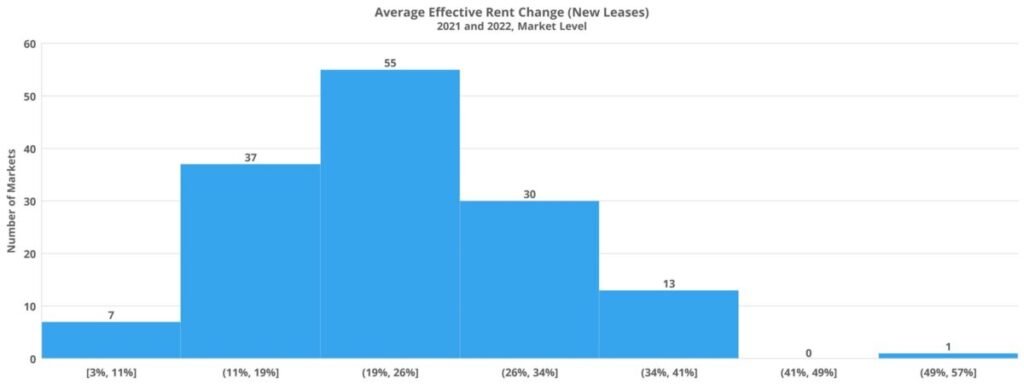
Similarly, all four market tiers – from the largest primary markets to the smallest tertiary markets – saw rent growth exceed 20% in that two-year period. The picture was much the same from a price class perspective. Class D properties were the only group not to exceed 20% rent growth, but still topped 18%.
Of course, not all was roses during that time for owners and operators. As rents were climbing, so were costs. Insurance rates, eviction moratoria, supplier costs, labor costs – just to name a few. Across the board, apartment communities became more expensive to own and operate. Even so, the historic rent growth of the period provides the backdrop for the subsequent cool off.
Demand Winds Began to Shift in 2022
After declining slightly during the winter period in late 2021 and early 2022, rent growth picked back up in March of 2022. Beginning in that month, monthly national average effective rent growth for new leases rose by 1% or more for five straight months. The August increase of 0.8% broke the streak, and then a 0.2% gain in September began a new paradigm in the post-pandemic era.
One aspect to note in the monthly data is that rent growth continued well above the norm for a full nine months after the peak in national average occupancy. In November of 2021 national average occupancy stood just above 94% and has been on an almost uninterrupted descent ever since. A brief exception came during the middle of 2022 when occupancy was virtually unchanged from May through July.
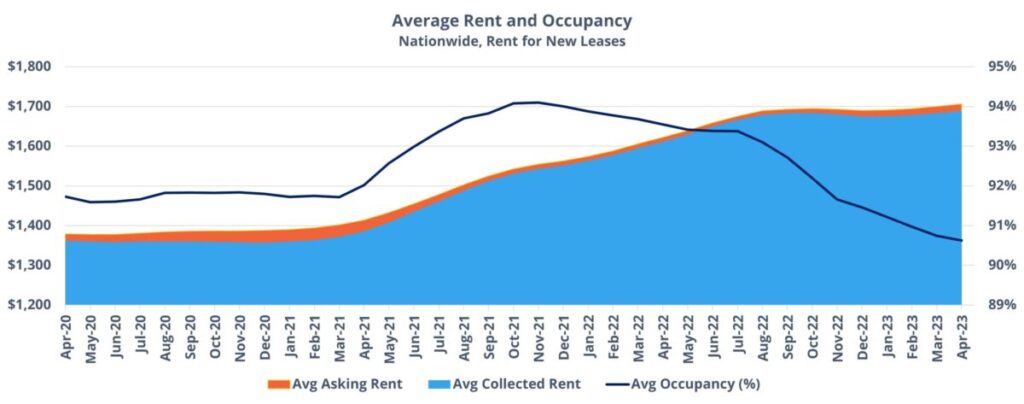
Rent growth maintained its momentum even as occupancy was steadily declining – thanks in part to the unusually high occupancy peak itself. Although clearing moving consistently downward, occupancy was higher nationally than when going into the pandemic in early 2020 until November of 2022. For most of that year, average occupancy was significantly higher than the pre-COVID baseline.
In addition to benefiting from excess occupancy attributable to the dazzling demand of 2021, it appeared to take a while for the new multifamily demand reality to sink in. In February of 2022, it was apparent that absorption had tailed off more than could likely be laid at the feet of seasonal effects. And yet, possibly due to the common reliance on trailing twelve-month data, much of the analysis as late as the second quarter was still quoting twelve-month net absorption totals that looked great thanks to the 2021 portion of that period.
Rent Growth in Recent Months
The 0.2% gain in September would be the last monthly rent gain at the national level in 2022. In the fourth quarter, October saw no change and was followed by a 0.3% decline in both November and December. These were the first monthly declines in national effective rent since 2020. As the calendar changed to 2023, rent growth returned to the positive. January was unchanged, but the average in February rose 0.2% followed by a 0.3% increase in both March and April.
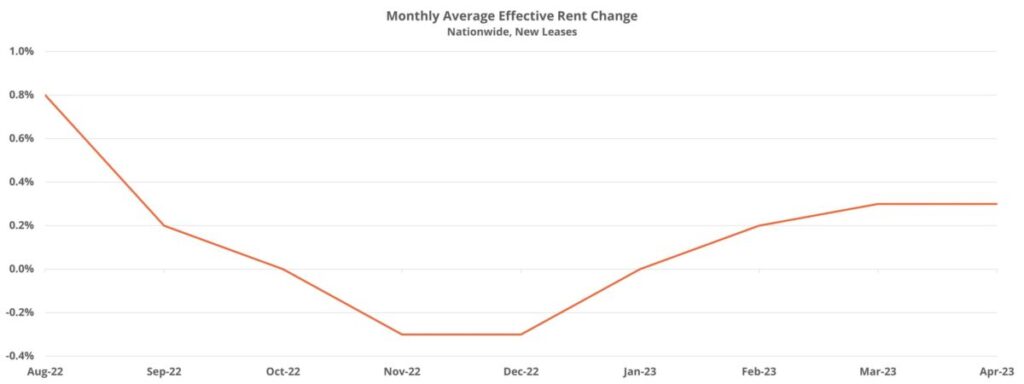
In the end, following a period of enormous rent growth and during the weaker portion of the calendar, national average effective rent for new leases gained 0.6% in the eight months since the cool down began. What is more, roughly 25,000 net leased units were shed in that same period. In other words, rent growth has undeniably been hard to come by in recent months, but the situation has hardly been a crisis.
In the first four months of 2023, the national average effective rent has gained 0.8%. Broken out by price class, the top three tiers have all been right around that average while Class D has moved slightly downward to the tune of 0.1%. The affordability crunch worsened across the board over the last couple of years, but especially so in the workforce housing segments. For now, Class C continues to keep pace with the top two tiers, but Class D rent growth has uniquely not reemerged coming out of winter.
Market Highlights so Far in 2023
At the market level, leaders so far this year have tended to be those areas that were not at the tip of the spear for growth in the 2021 and 2022 period. Columbia and Springfield in Missouri along with Midland – Odessa in Texas were the three areas to top 5% average effective rent growth through April. Other markets near the top of the list include Lincoln, Abilene, Roanoke, Madison, and Omaha. Each of these added between 3.5-4.5%.
On the other end of the spectrum, were a lot of markets among the leaders in rent growth over the last couple of years. Both Tallahassee and Honolulu suffered a decline of approximately 2.5% from January through April while South Bend and Boise saw decreases of close to 2%. Austin, Tucson, Las Vegas, Phoenix, and Asheville were other areas in the Sunbelt that found themselves in negative territory so far in 2023.
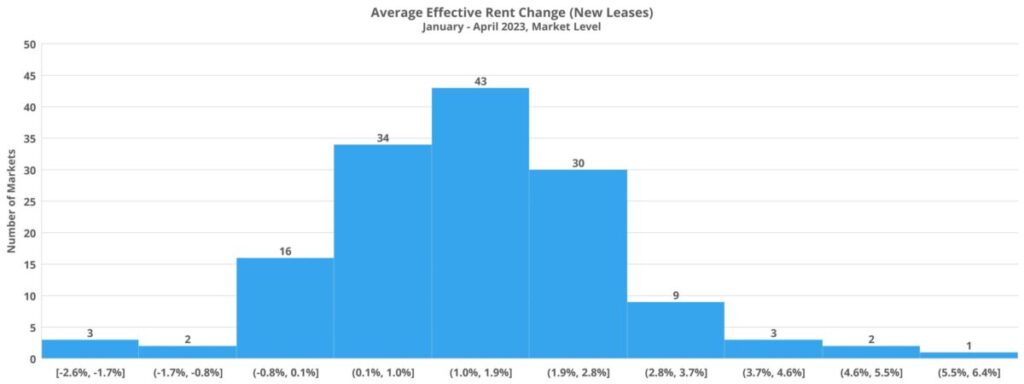
Despite some markets being in the category, average effective rent declines have not been the rule so far this year. Only nineteen ALN markets ended April with a lower average than they entered the year with – representing 13% of national markets. Almost one hundred markets have exceeded the national gain of 0.8% in the period.
Headwinds for 2023 Rent Growth
However, headwinds aside from stubbornly low demand remain for rent growth. The new construction pipeline is expected to deliver more new units than last year’s 400,000. Apartment demand has improved in recent months but remains lower than usual. In a typical year going back to the middle of last decade, national annual net absorption averaged roughly 300,000 units. Last year that total was only approximately 50,000 units and this year is all but certain not to reach 300,000 units. Even if it did, there would be a much larger gap between delivered units and net absorbed units than the industry has been accustomed to.
The rent increases of recent years, and inflation more broadly, have vastly altered the financial position of households relative to 2021. According to the Board of Governors of the Federal Reserve System, consumer debt service as a share of disposable income rose all of last year and is now back to its pre-pandemic level. Total outstanding credit card balances have been on a sharp upward trajectory since early last year and the Federal Reserve Bank of New York has reported that household credit card debt closed 2022 at a record high. Debt-fueled consumer spending is manageable in the near term as long as the labor market remains tight.
While the latest jobs report was largely positive and national unemployment ticked down slightly to 3.4%, the layoffs that began in the tech sector have now begun to spread to the finance sector and some of the large retailers. After the latest Federal Reserve rate hike in May it seems as though there is a reasonable chance for a pause in further hikes, and even the possibility of a small rate reduction later in the year. A lack of more rate increases would probably help the unemployment rate remain low, but the Fed aim for some time has been a considerable increase in the unemployment rate to help cool inflation.
Takeaways
The rent growth of 2021 and the first half of 2022 was astounding, and it lasted longer than the demand data would have indicated. The subsequent cool down happened rapidly. A monthly gain of 1% in July turned to a 0.2% gain just two months later. And yet, the bottom in the winter period, even as the nation was shedding net leased units, turned out to be a 0.3% decline in both November and December. 2023 is already back in positive territory.
Macroeconomic headwinds and geopolitical uncertainty provide the background for 2023 while within the industry, a near-term supply glut poses a challenge for rent growth. The lack of supply, fairly sticky prices, and elevated interest rates in the single-family sector are all making the jump to homeownership more difficult for many buyers. This should provide some level of support for Class A multifamily demand.
Also, many of the markets with an especially large number of deliveries expected this year are consistent high in-migration markets that need the supply in the longer term. Despite these mitigating factors, the volume of new supply is going to mean lower average occupancy and higher lease concession availability. Rent growth in 2023 will be harder to come by in concert with the aforementioned bigger picture hurdles.
It is likely that the industry is going to be more reliant on seasonal boosts this year. More typical seasonal patterns do appear to be emerging after being absent from 2020 through 2022. This means that demand should improve in the coming months and keep rent growth in positive territory. The question will be what the picture looks like as the fall and winter months arrive.
It’s Budget Season Again!
Property owners and managers must make informed financial decisions for their budgeting process, and the secret to unparalleled success is harnessing accurate, reliable data. Explore the reporting, current and historical data, and the power of ALN OnLine today.
Disclaimer: All content and information within this article is for informational purposes only. ALN Apartment Data makes no representation as to the accuracy or completeness of any information in this or any other article posted on this site or found by following any link on this site. The owner will not be held liable for any losses, injuries, or damages from the display or use of this information. All content and information in this article may be shared provided a link to the article or website is included in the shared content.