Does (Market) Size Really Matter?
New construction activity has obviously been focused in the large markets, as has industry attention in general at times. As the current cycle continues to age, secondary and tertiary markets have been getting increased attention from the owner/investor side of the industry. As we approach the final quarter of 2018, let’s look at some key performance metrics nationwide for primary, secondary and tertiary markets* over the last 12-months.
View the full monthly Markets Stats PDF
Markets of All Size – Occupancy and Net Absorption
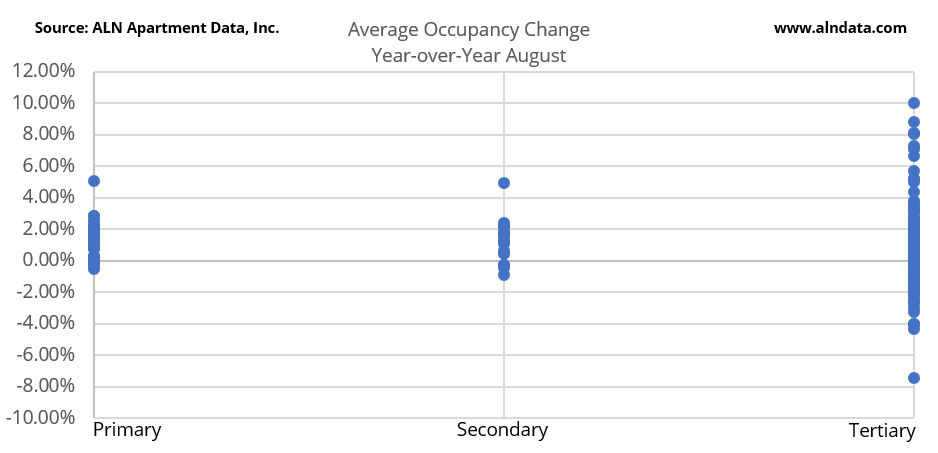
As of the end of August, all three market designations had roughly the same average occupancy – about 93%. Over the last 12 months, primary markets have seen average occupancy gain of 1.3%. This is due in large part to around 178,000 new units being delivered during the same span.
Demand was healthy, with 263,000 net new units rented during the year. This was not far enough beyond the new supply to make a jump in average occupancy due to there being about 8.2 million units in these ALN primary markets.
With just under 20,000 new units and over 32,000 net units absorbed**, secondary markets managed an average occupancy gain of about 1.2% to end August at the 93% mark. Markets like Birmingham, Louisville and Milwaukee were the engines for the occupancy gains with new demand far outweighing new supply in the 12-month period.
Markets of All Sizes Are Available in ALN OnLine! Request a Webinar!
Net absorption surpassed new supply in the tertiary markets as well. Around 33,000 new units were added in these areas, but 43,000 units were absorbed. This was enough to drive a 1.1% improvement in average occupancy. What is interesting about the tertiary markets is the geographic spread of the strong absorption.
Demand wasn’t centered in just a specific area where a local economic event could affect conditions. Individual tertiary markets in states like Louisiana, Arkansas, Hawaii, Idaho, South Carolina and South Dakota absorbed more than 5% of their capacity over the last year.

Average Effective Rent Growth
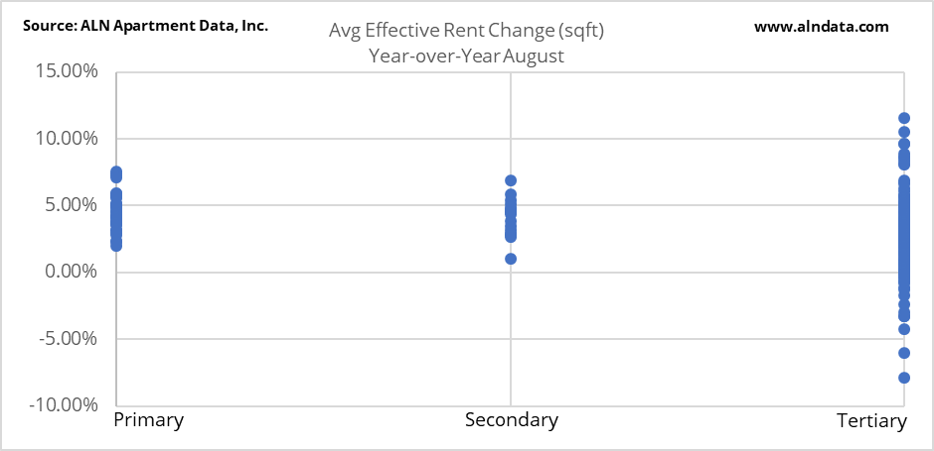
Average effective rent in primary markets appreciated 4.6% in the period, to end August at $1.56 per square foot. A few markets stood out. Phoenix, Orlando, Miami-Ft. Lauderdale and Las Vegas all surpassed 7% annual growth. Areas such as DC, Portland and Austin were below average, but still came close to 3%. Much of the rent growth in the primary markets across the country can be attributed to the influx of new units.
The secondary markets performed almost as well. An improvement of about 4% brought the average effective rent in these geographies to $1.07 to end August. Notably, Jacksonville was the only market to do better than 6% growth, but both the San Joaquin Valley and Tucson areas managed to top 5%. Tulsa was the only secondary market to fail to reach a 2% gain.
Effective rent rose 2.9% in the tertiary markets, bringing the average to $1.02 per square foot. In tertiary markets especially, we’ve seen rents rise because of two different conditions. One is the significant increase in construction activity in some of these markets. The 33,000 new units introduced in the previous 12-months is an increase from about 18,000 in the 12-months prior. In markets with an overdue increase in units, these new units are pushing up prices. Conversely, some tertiary markets are still badly under-supplied. In these areas, rents continue to climb simply due to the supply/demand imbalance.

Takeaways
In terms of occupancy and absorption, markets of all sizes are still doing very well. Average occupancies are approaching the mid-90%’s and demand continues to outpace supply even as new units continue their deluge. So, does market size matter when it comes to performance? It’s clear that companies are correct in viewing smaller markets as opportunities. Consider demand as a percent of new supply. For primary markets, it sits at 147%. For secondary markets, that figure rises to 160% and tertiary markets are at 130%.
Rent growth was strong across the board, but especially the primary and secondary markets. There is a substantial gap between the average rent in primary markets versus the secondary and tertiary areas.
As rents begin approaching their ceiling in the larger markets, it’s clear fruit is on the vine in the smaller markets, especially those that are under-supplied. Given the larger variance in performance among the smaller markets, it’s just a matter of choosing the right ones.
* ALN assigns markets to one of these three categories based on unit count
**Absorption refers to the net change in rented units

