
Multifamily Finds Breathing Room, Not a Full Recovery
With the first half of the year complete, 2026 multifamily performance is coming into clearer view. Much of the calendar’s traditionally strongest period for leasing activity and rent growth has now passed. While the year has brought both positive and negative developments, the improvement so far owes more to slower deliveries than to pristine demand conditions.
The year is shaping up as a step in the right direction for an industry challenged over the last few years, but 2026 is unlikely to deliver a full recovery.
Methodology note: All figures refer to conventional properties with at least 50 units. Average effective rent refers to new-lease rents.
View the full monthly Markets Stats PDF
New Supply Relief Takes Center Stage
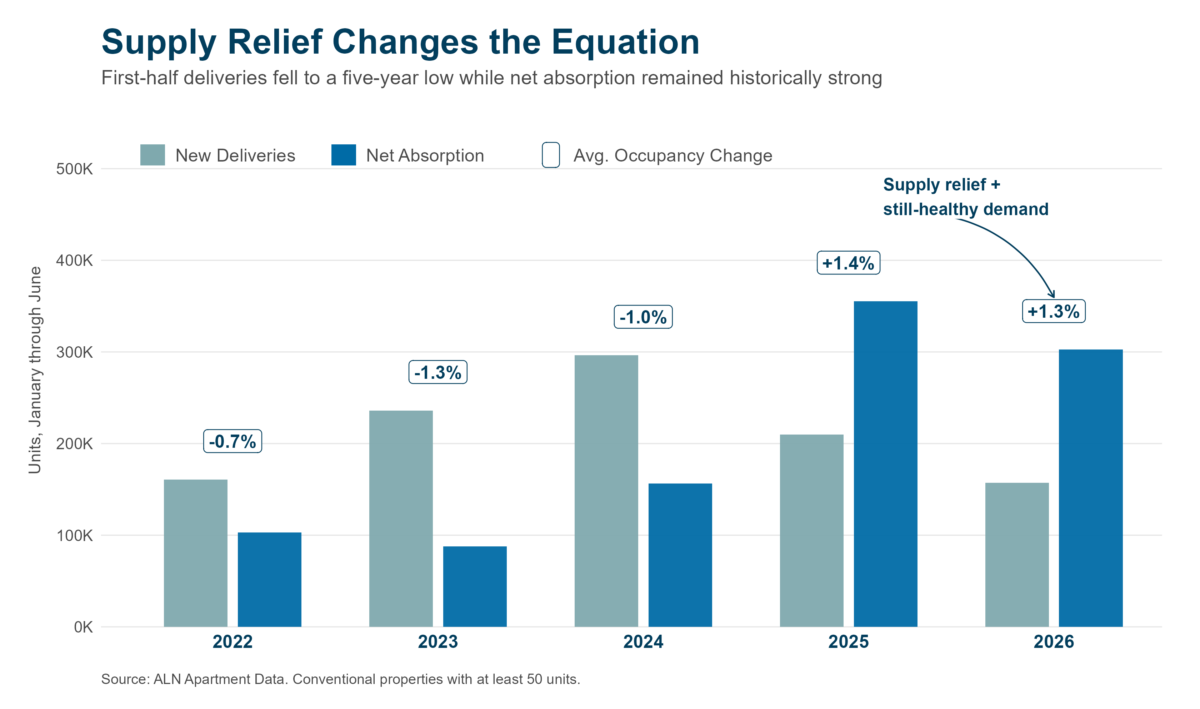
The first half of the year brought a major shift in the relationship between new supply and net absorption. New deliveries totaled about 157,000 units, down from an average of approximately 250,000 units during the first half of the previous three years. First-half new supply was the lowest in more than five years.
The Sunbelt continued to lead, accounting for nine of the top 12 markets for new units delivered through June. The exceptions were New York City, Columbus, and Boston. The decline in new supply has given the multifamily industry much-needed breathing room and has arguably been the most consequential development of 2026.
Robust net absorption has also supported the improvement in supply-demand fundamentals, though with some key caveats. Just more than 300,000 net units were absorbed nationally in the first six months of 2026. That was down 15% from 2025 but still marked the second-highest first-half total of the last five years.
The slowdown relative to 2025 was concentrated in the workforce housing portion of the market. Realized demand rose year-over-year in Class A and Class B properties, while Class C and Class D net absorption fell by 38% and 57%, respectively.
This emerging dichotomy between price classes is a key asterisk next to the headline national absorption total. Absorption momentum also appears to be cooling for the first time since 2022, though some slowdown was expected after last year’s pace.
Lower new supply and healthy absorption produced a 1.3% average occupancy gain in the first half of the year. That nearly matched the 1.4% improvement from the same period last year and brought national average occupancy to just under 91%. For properties already stabilized 12 months ago, average occupancy ended June at about 93%.
Concessions Still Weigh on Rent Growth
The primary caveat to multifamily absorption is also central to the rent-growth discussion: lease concessions. The industry has become increasingly reliant on lease concessions, even as new supply has slowed. This increased reliance calls into question the durability of apartment demand and creates a major headwind for rent growth.
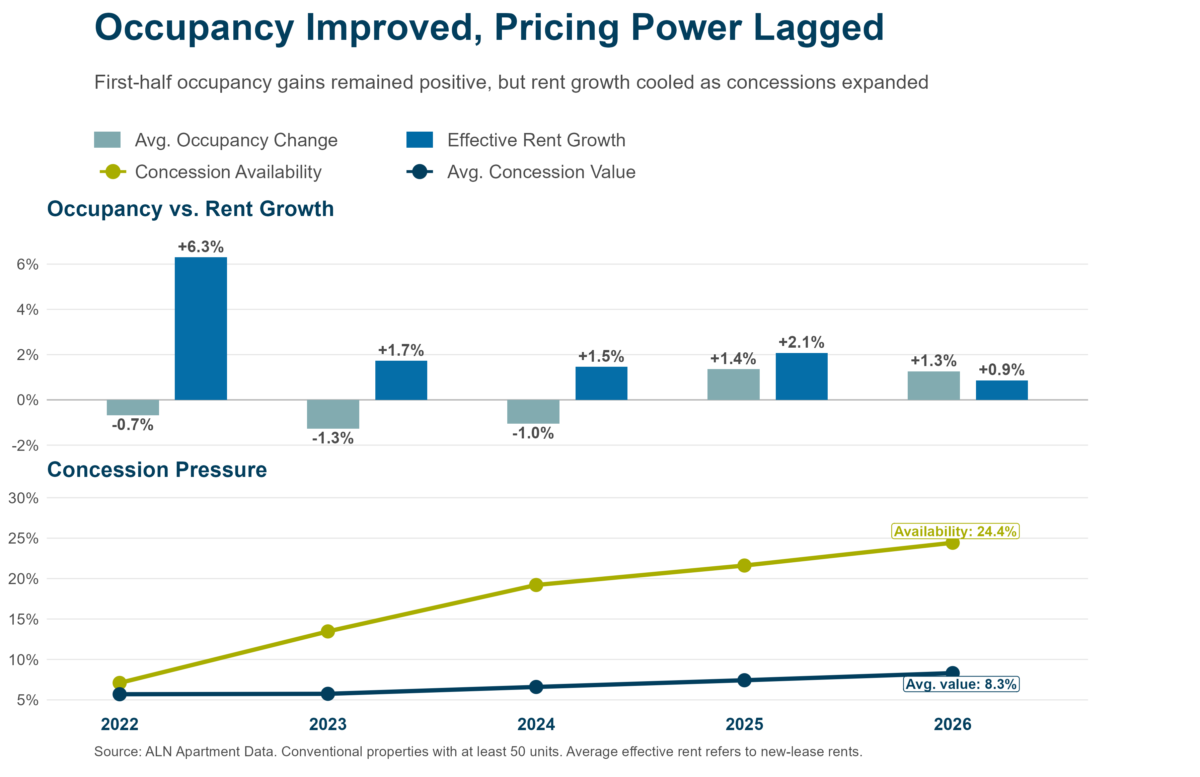
Approximately one-quarter of properties were offering a discount to new residents at the end of June. That represented an 8% increase from the start of the year and the fourth consecutive January-through-June period in which concession availability rose.
The average discount value rose 4% in the first half of the year to 8.3% of annual rent, equivalent to 4.3 weeks free on a 12-month lease. Considerable variation exists beneath these national averages. The concession environment has largely been driven by new supply, which has disproportionately affected the Sunbelt and Mountain West.
San Antonio (55%) and Austin (54%) were the only primary markets to end June with lease concession availability above 50%, while Dallas–Fort Worth barely missed that threshold at 49%. Other national leaders included Las Vegas (47%), Denver (46%), Houston (45%), Tampa (42%), and Phoenix (40%).
These markets stand in stark contrast to areas such as Buffalo, Chicago, Detroit, Cleveland, Philadelphia, and Dayton, where an average of just 10% of properties were offering discounts on new leases.
The top five primary markets by average concession value – Austin, Nashville, Denver, Charlotte, and Phoenix – averaged discounts equal to 11% of annual rent at the end of June. The bottom five primary markets – Chicago, Detroit, Baltimore, Dayton, San Bernardino – averaged just 5% of annual rent.
Against that backdrop, national average effective rent rose just 0.9% in the first half of the year despite positive absorption and improved occupancy. That gain was less than half of last year’s 2.1% increase for the same period and marked the weakest first-half effective rent growth of the last decade, aside from 2020.

Join us for the latest insights on lease concessions, market performance, and regional recovery trends. Reserve your spot today!
Takeaways
The first half of 2026 brought meaningful positives for the multifamily industry. New supply fell to roughly 50% of its level in the same period of 2024. Net absorption slowed from last year’s blistering pace, as expected, but the decline was not precipitous. Together, slower supply and still-healthy absorption allowed average occupancy to gain ground for a second consecutive January-through-June period.
However, challenges remain. Rent growth remains elusive in many markets around the country. Lease concessions continued to expand in both availability and average value through the spring and early summer. Ideally, leasing activity would have been strong enough to reduce both measures before the traditionally weaker fourth quarter arrives, when concessions typically expand again.
New supply will also remain a factor in the back half of the year, even as net absorption likely slows from peak-season highs. ALN is tracking about 145,000 units currently under construction that are expected to enter the market by year-end.
If these national trends largely hold through the rest of the year, 2026 is likely to deliver a second consecutive year of average occupancy improvement, weaker annual effective rent growth than in 2025, and possible new decade highs in both concession availability and average concession value. That would leave plenty of room for improvement heading into 2027.
Disclaimer: All content and information within this article is for informational purposes only. ALN Apartment Data makes no representation as to the accuracy or completeness of any information in this or any other article posted on this site or found by following any link on this site. The owner will not be held liable for any losses, injuries, or damages from the display or use of this information. All content and information in this article may be shared provided a link to the article or website is included in the shared content.