Third Quarter: Demand Slowed, but Rents Continued Their Climb
The 2021 multifamily bounce back has been like nothing seen in decades. Dazzling apartment demand has propelled lease concessions downward and average rent to stratospheric levels despite an increase in new supply compared to previous years. Of course, beneath the national metrics, some important differences emerge. As always, all numbers will refer to conventional properties of at least 50 units.
National Apartment Demand
Last year, due to the disruption associated with the COVID-19 pandemic, our highly seasonal industry broke out of some seasonal norms. Though rent growth remained elusive throughout the year, the recovery in apartment demand began in the back half of the year and that wave carried all the way through the generally more tepid winter months. This year, at least from the perspective of demand, a more-typical pattern has reemerged – though the numbers involved have been eye-popping.
View the full monthly Markets Stats PDF
In the second quarter of this year, net absorption nationally was about 250,000 units. In the third quarter, that number fell to just below 210,000 net units. Obviously, what jumps out from those numbers is the scale. In the four years prior to 2021, national net absorption for July through September averaged about 107,000 units – barely half of this year’s total.
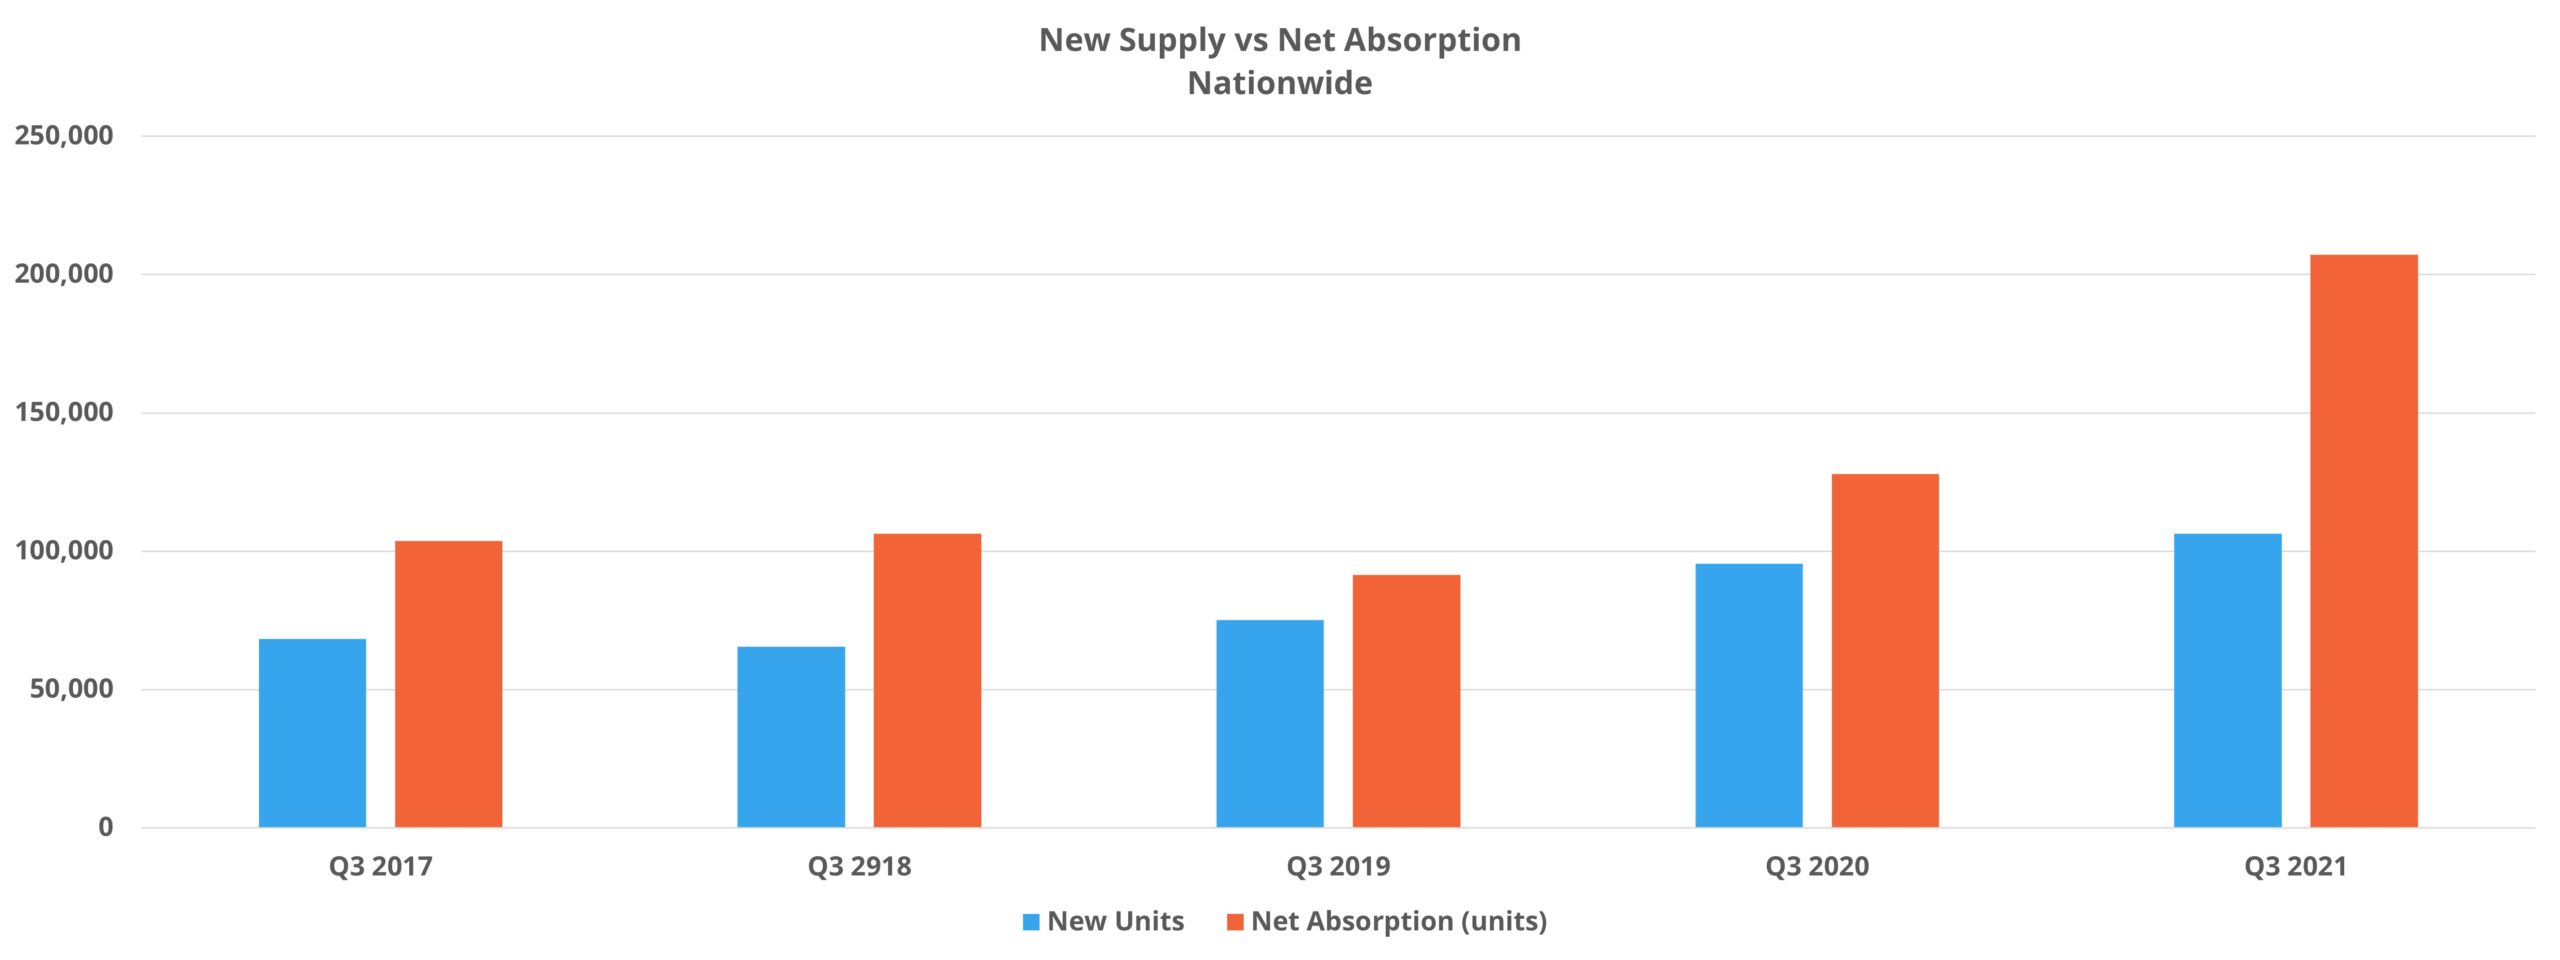
Net absorption for multifamily is usually, but not always, lower in the third quarter than the second. The 16% decrease between the two periods this year fits back into that pattern. Yet demand remained so strong in the third quarter that the 16% decline compared to the second quarter was better than the corresponding 29% decline in 2019 and the 19% drop-off in 2018 despite the bar set in Q2 2021 being so high. 210,000 net absorbed units was enough to propel national average occupancy up by 0.8% to just under 94% — even with more than 106,000 newly delivered units.
Encouragingly, all four price classes outperformed previous years for the quarter. The top two price tiers managed the widest margins. Class A properties absorbed more than 71,000 net units compared to about 27,000 and 44,000 net units in 2020 and 2019 respectively. Class B properties absorbed around 62,000 net units compared to approximately 32,000 and 28,000 net units in 2020 and in 2019.
National Rent Growth
Since 2017, national rent growth for the third quarter was strongest in 2018 at 1.3%. This year, average effective rent rose by 5.4% in the period. As with apartment demand, third quarter rent growth is typically lower than in the second quarter. This year, though, the 5.4% gain was comfortably past the 4.6% mark from the previous quarter.
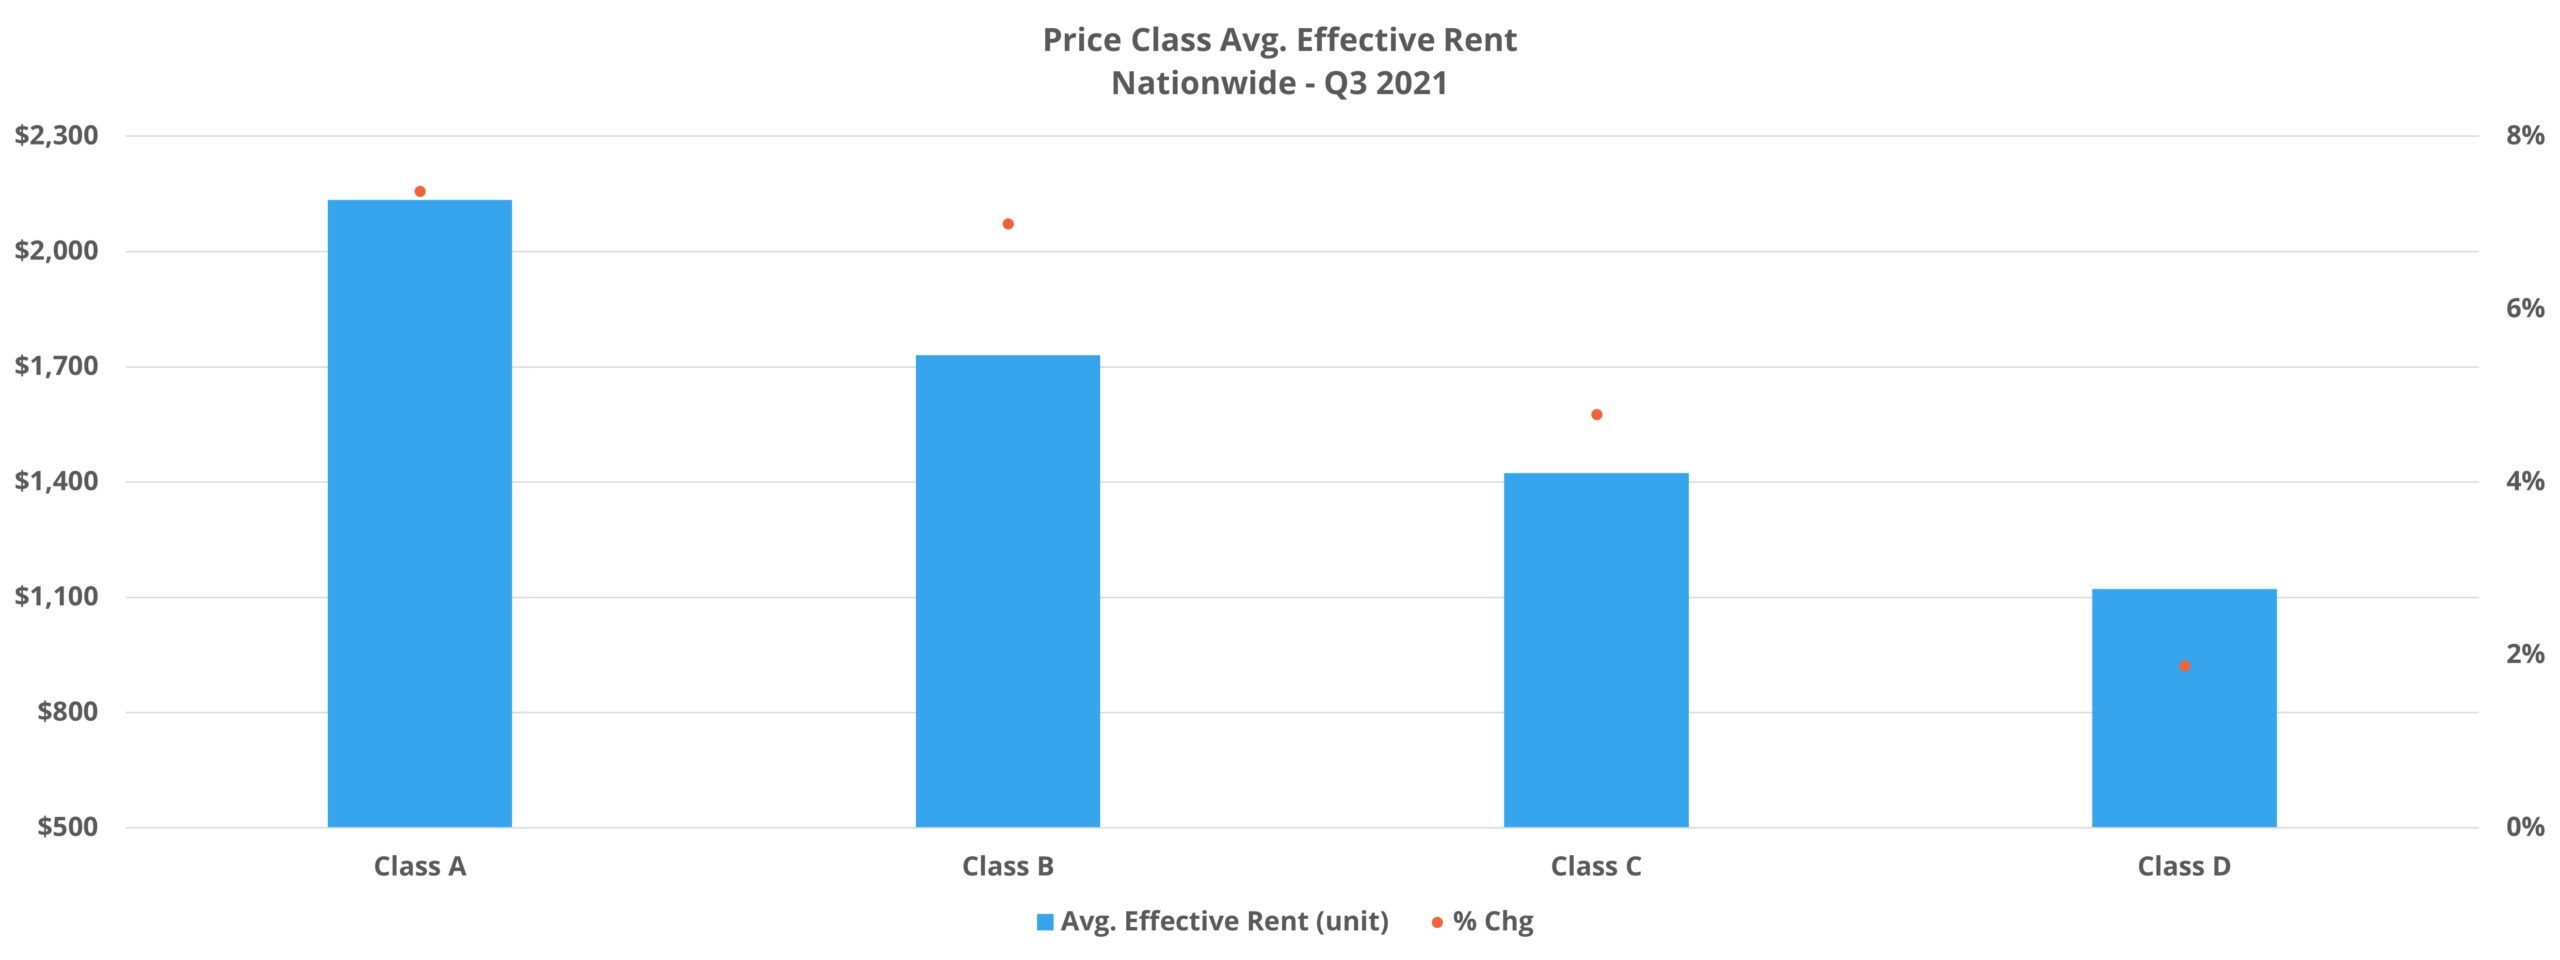
Once again, the top two price classes largely drove the result, but the Class C and Class D spaces certainly were not left out of the growth. Class A rent growth in the quarter was 7.4%, while the Class B subset realized a 7% gain. Class C growth was at outlier levels as well at 4.8%. The Class D increase of 1.9% was somewhat closer to something resembling normalcy, but even that was more than double the mark from Q3 2019. Just to reiterate, these rent growth numbers were in the third quarter alone.
Average market rent rose by 4.8% in the quarter, so part of the rent growth story was the movement in lease concessions. After a 34% decrease in the period, only 9% of conventional properties nationally were offering a new lease discount at the end of September. Additionally, a 10% decline in the average discount value brought the average concession package to 3.5 weeks off an annual lease. Both concession availability and the average concession value declined across the price classes, except for a 3% bump in the average discount value for Class D properties.
Market Notes
Dallas – Fort Worth, Houston, and New York were the market leaders in net absorption for the third quarter – led by more than 18,000 previously unoccupied units being leased in DFW. Los Angeles – Orange County and San Francisco – Oakland rounded out the top five and were joined in the top 10 by areas like Washington DC, Austin, Boston, and Atlanta. When considering units absorbed as a percent of vacant units, other markets emerged. State College – Altoona in Pennsylvania, Northwest Arkansas, Fargo, North Dakota, and Southeast Washington were among the leaders.
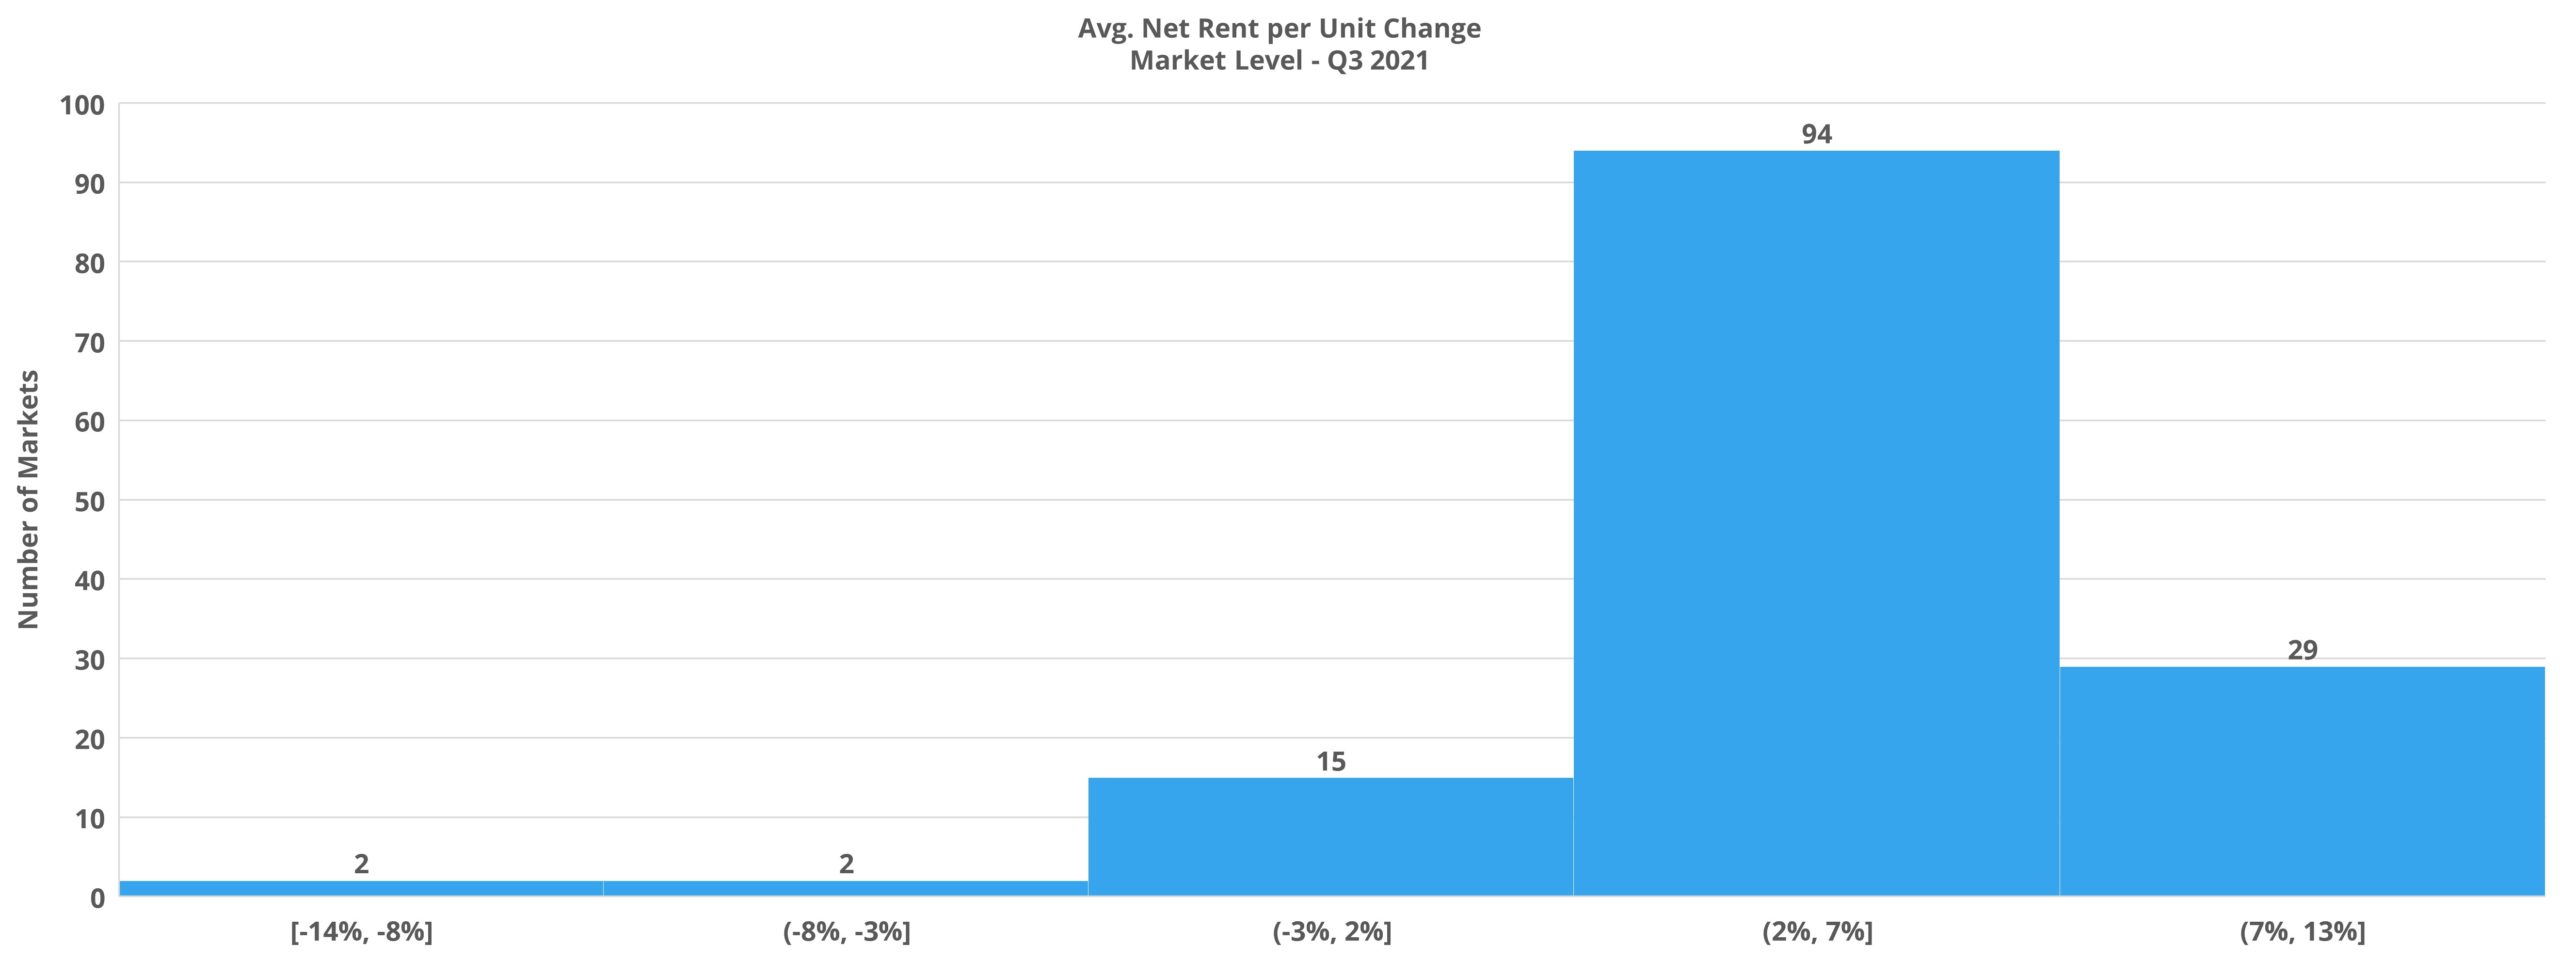
Four of the top 10 markets for average effective rent growth in the quarter were in Florida, led by the 11% gain in Tampa. Orlando, Palm Beach, and Jacksonville each added 9% or more to average effective rent. Other markets of note included Austin, with a 10% gain, and a 9% gain in Albuquerque, Las Vegas, and Phoenix. Markets across the Lower Atlantic, South, and Southwest accounted for 18 of the top 20 markets with regard to Q3 rent growth. San Diego and Salt Lake City snuck into the top 20 with average effective rent appreciation of just over 7% each.
Smaller markets made up the majority of areas near the bottom of the list for quarterly rent growth, but some primary markets found themselves there as well. Minneapolis – St. Paul continued to lag other large markets with a 1.8% increase in the period. Other Great Lakes markets like Cincinnati – Dayton, Milwaukee, and Cleveland – Akron finished the quarter right around the 2.5% mark.
Takeaways
The third quarter was in many ways a continuation of conditions that have been in place for almost a year now. Apartment demand, while lower than in the second quarter, continued to blow previous years out of the water. The new construction pipeline, despite myriad challenges, has continued to deliver units at a higher volume than in recent years. Unlike net absorption, rent growth has continued to increase in trajectory, even in the face of seasonal headwinds.
While it is true that the top two price tiers, and indeed the largest markets, continue to power these results, the rebound remains broad-based. Class C rent growth especially stood out at 4.8% in the quarter. It is within this segment in particular that rent growth of the magnitude seen in 2021, and in so short a period, becomes a double-edged sword. Certainly, such strong demand and rent growth reflect strong fundamentals but rent growth to this level will further exacerbate affordability issues and invite increased public and political scrutiny. This is already being seen in some markets.
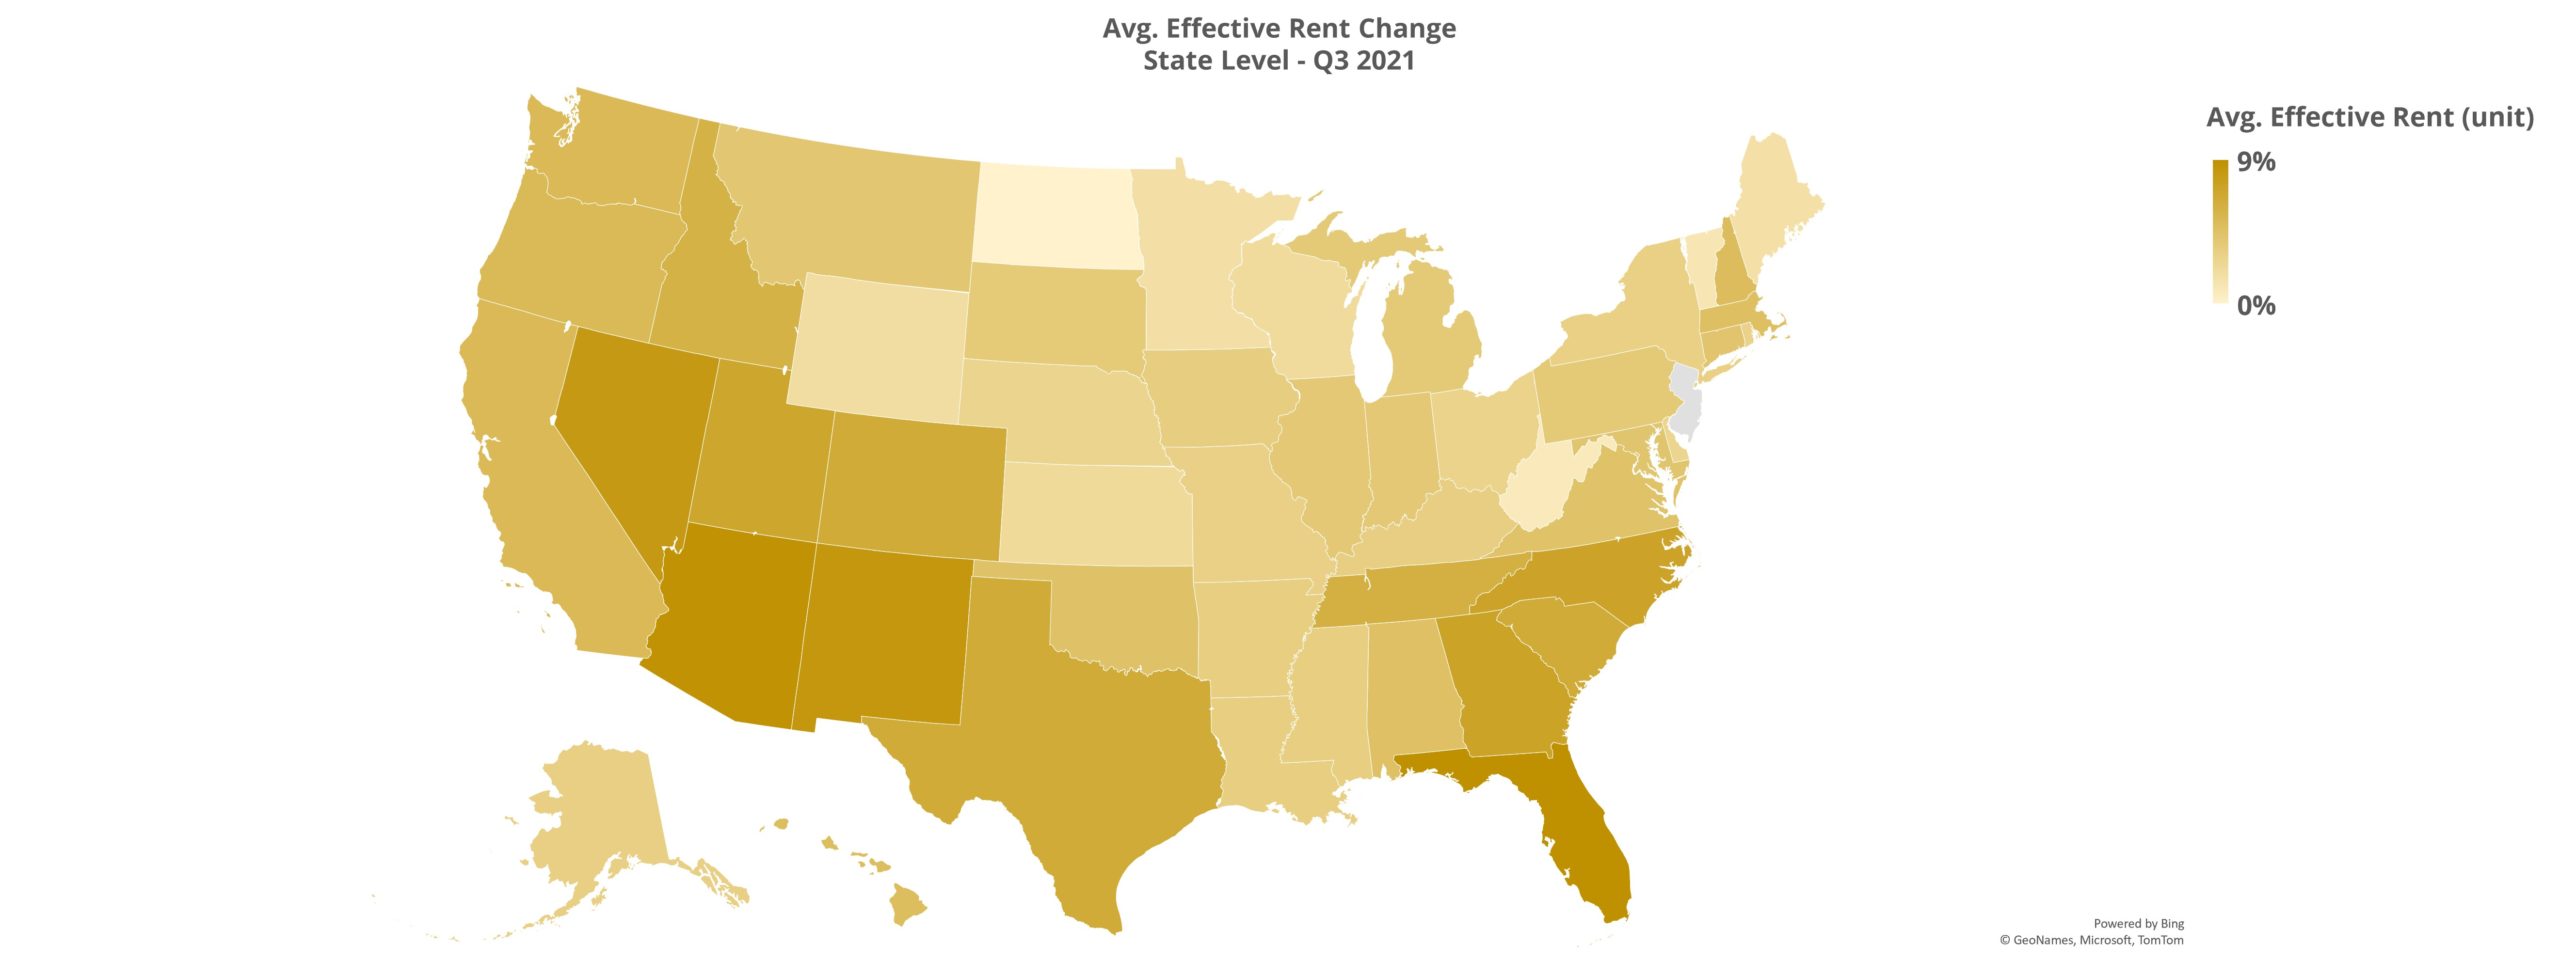
Clear regional differences have persisted. Markets across the Lower Atlantic, the Mountain West, and large markets across the South continue to lead the recovery – specifically in rent growth. It is, of course, no coincidence that these are the areas of the country that have enjoyed strong population growth relative to the rest of the country in recent years.
As we move into the fourth quarter, there is little reason to expect rent growth to dramatically slow. Seasonal effects are likely to make an impact given that apartment demand did begin to slow late in the third quarter. Even so, national rent growth will likely climb at an atypical pace through the end of the year.
Search, Analyze & Compare
ALN OnLine is a web portal that allows our clients to search properties, access submarket and markets trends, new construction, and more. Since 1991, we have continued to refine our business practices and methodology in order to offer our clients the absolute best in multifamily data.

ALN OnLine is a web portal that allows our clients to search properties, access submarket and markets trends, new construction, and more. Since 1991, we have continued to refine our business practices and methodology in order to offer our clients the absolute best in multifamily data.
Disclaimer: All content and information within this article is for informational purposes only. ALN Apartment Data, Inc. makes no representation as to the accuracy or completeness of any information in this or any other article posted on this site or found by following any link on this site. The owner will not be held liable for any losses, injuries, or damages from the display or use of this information. All content and information in this article may be shared provided a link to the article or website is included in the shared content.

