

Strong Demand, Uneven Pricing Power
Apartment demand has strengthened substantially over the last few years. A slowdown in deliveries over the last year, coupled with further absorption increase, has allowed occupancy to improve sharply. Yet both market and effective rent growth slowed.
The apparent disconnect brings an important aspect of market cycles into focus. The relationship between new supply and net absorption can, and typically does, improve before pricing power is restored. A question facing the industry now is: why has healthy absorption produced significant occupancy improvement but only modest, and very uneven, new-lease rent growth?
Methodology note: All figures refer to conventional properties with at least 50 units. Rent measures include asking and effective rents for new leases.
View the full monthly Markets Stats PDF

Join us for a look at today’s multifamily market and a look ahead into 2027. Space is limited, so don’t wait to save your spot – register today!
Rent Growth Slows Sharply
National average asking rent per unit rose just 1% over the last year, the narrowest gain in more than five years for the period and nearly 75% below the previous 12-month increase. Average effective rent grew only 0.7% to $1,790 per month, an 80% slowdown from the prior period and the weakest gain in more than five years.
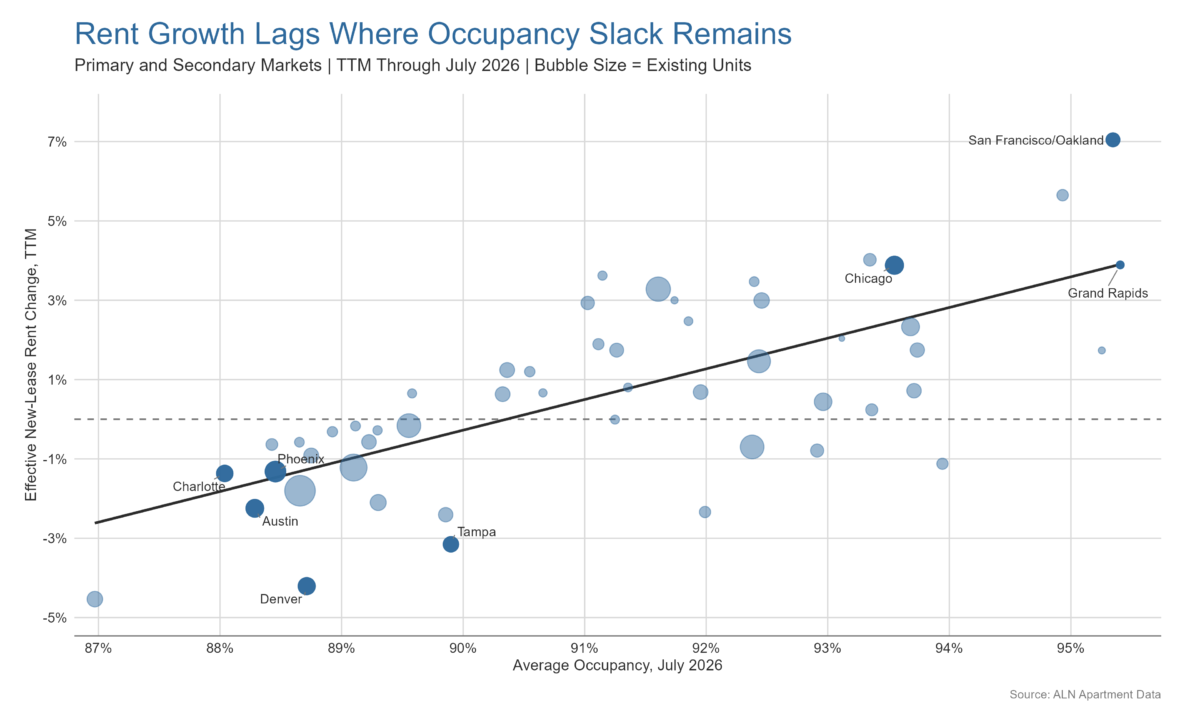
The strongest gains were more geographically scattered than in recent years. Smaller markets across Texas, the Gulf Coast, and the Midwest were particularly well represented, while many large Sun Belt markets that led rent growth in 2021 and 2022 remained absent. San Francisco/Oakland was a conspicuous exception among the mostly smaller-market leaders, with effective rents rising approximately 7%. Twenty-one of the top 25 markets also had effective rents below the national average, though lower-cost markets did not universally outperform.
Price-class differences were similarly pronounced. New-lease rent growth remained strongest in Class A and weakened progressively down the price spectrum, with Class C essentially flat and Class D in decline. Absorption showed a similar split, remaining much stronger in Classes A and B than across the workforce segments.
Occupancy Gains Do Not Guarantee Pricing Power
The current multifamily recovery highlights the familiar market-cycle dynamic that rent growth is much more closely associated with occupancy level than with occupancy change.
Average occupancy can gain more than 440 basis points in 12 months after net absorption nearly doubles new units delivered and average effective rent can still decline 1.4%. This exact scenario played out in the Charlotte market over the last year. One reason was that strong absorption came alongside widespread and generous lease concessions. Another was that market occupancy was only 88% even after the recent improvement.
Other examples of this general profile over the last year included Phoenix, Austin, Orlando, Denver and Tampa. Absorption fills the vacant units created by earlier deliveries. Until enough excess available stock has been removed, operators may still lack the leverage to increase rents, even when leasing velocity and occupancy are moving in the right direction.
Supply pressure has also receded from its peak in many markets, but the timing of the peak matters. Units under construction represent additional inventory still moving toward the leasing market, while active lease-ups represent recently delivered units already competing for renters. Together, they provide a fuller picture of the supply burden a market is working through.
A useful illustration of the influence of deliveries over time, especially during a surge in new supply, can be seen when comparing the Boise and Charlotte markets. Each had roughly the same peak in new supply pressure as measured by under construction and active lease-up units as a share of existing stock. That metric peaked for both markets at about 26%.
Over the last year, both markets have since seen net absorption outpace new units delivered and have posted robust occupancy gains. Boise, however, recorded a 4.3% increase in average effective rent, compared with a 1.4% decline in Charlotte. Boise also ended the period with average occupancy nearly 300 basis points higher.
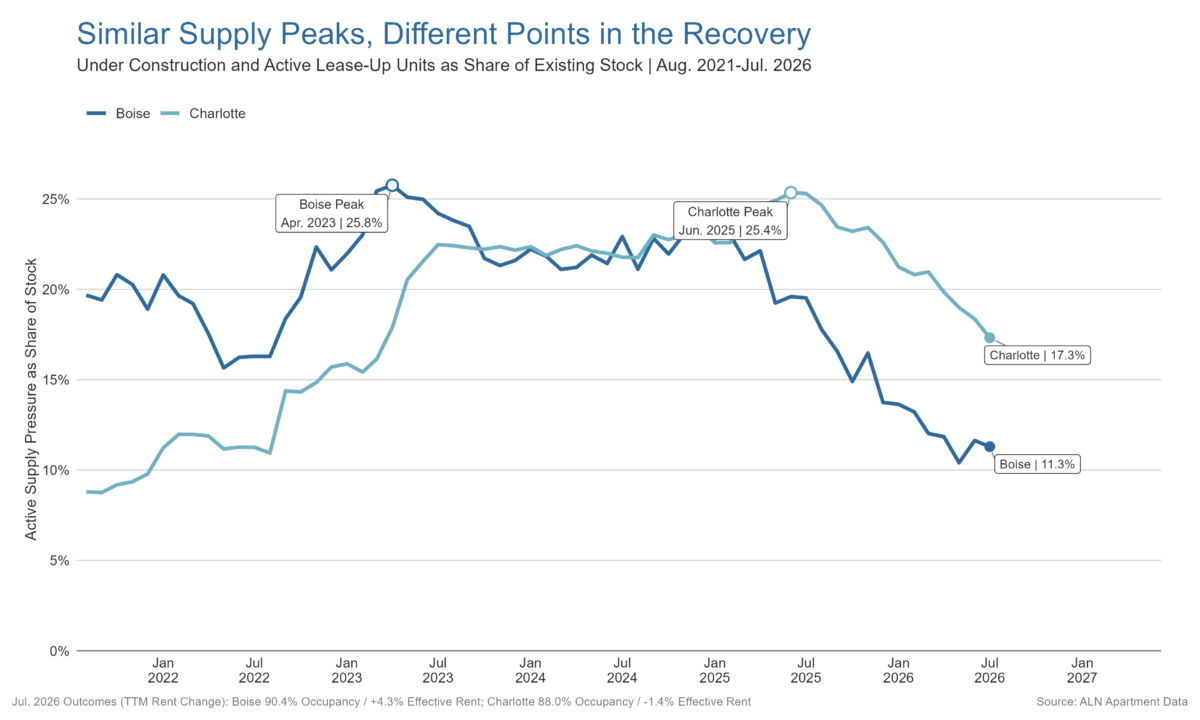
Recent rent performance should not be attributed to any single factor. Still, the timing of peak supply pressure appears directly relevant. Boise reached its peak more than two years earlier than Charlotte, giving the market considerably more time for strong absorption and slowing deliveries to work through excess availability. The Charlotte market is showing many of the same directional improvements, but those gains have had less time to translate into tighter vacancy and stronger pricing power.
Demand Has Not Spread Evenly
Another factor behind slowing average effective rent growth is that aggregate absorption has not spread evenly through the apartment stock. Recently stabilized properties captured the largest number of absorbed units, while active lease-ups captured the next-largest amount despite representing a smaller inventory pool. Properties stabilized for at least 24 months lost occupied units on a net basis over the last year.
This divergence by vintage helps explain how realized demand can look strong while many established properties operate in a very different environment. The multifamily sector is successfully absorbing the recent supply wave, but that is not the same as a broad recovery across seasoned stock. Markets with fewer recent deliveries may consequently have lower net absorption simply because they have fewer vacant units available to absorb. With less occupancy slack, that demand can translate more readily into pricing power.
Rent Performance Diverges Across the Price Spectrum
Related to vintage, rent performance has differed considerably by price class. Class A average effective rent growth of 3% during the last year led all tiers despite the gain representing a 25% decline from the prior 12-month period. Class B managed a roughly 1% gain, while Class C was essentially flat and Class D effective rent declined more than 2%.
Importantly, the same pattern remains after limiting the analysis to only stabilized properties. This indicates that the difference in price class absorption is not solely due to recently delivered inventory at the top of the market.
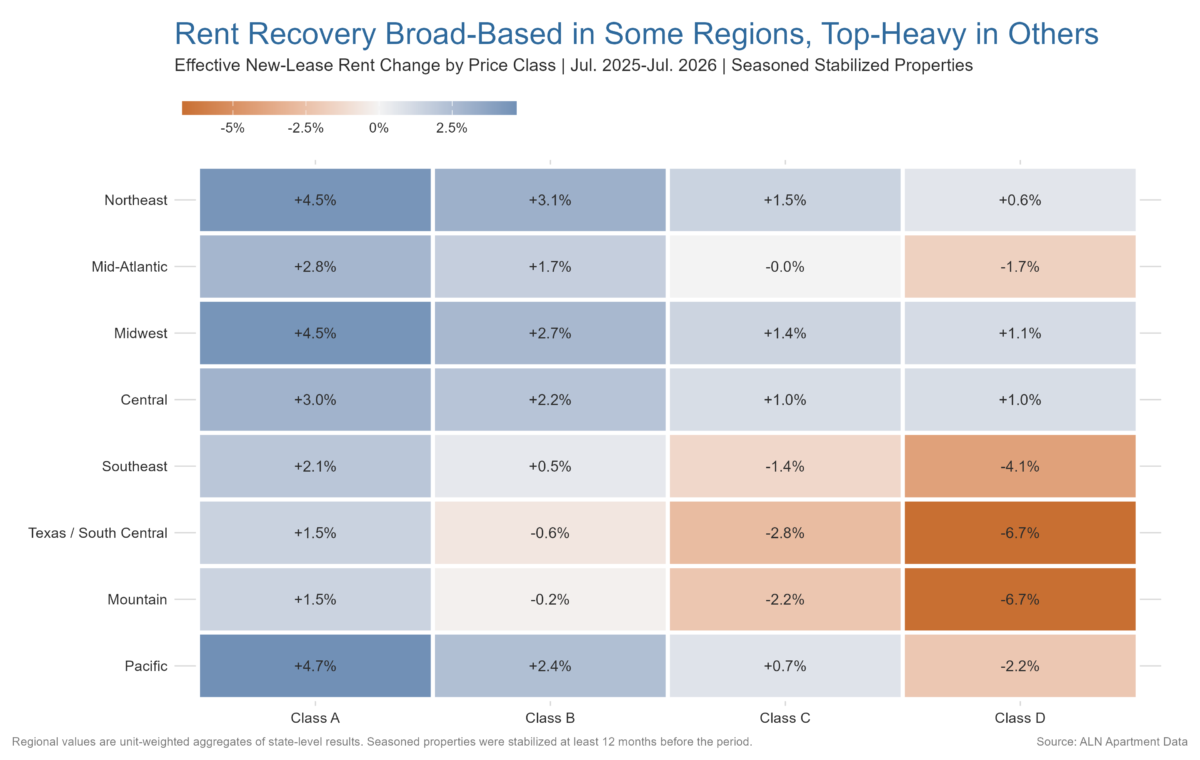
Geography increases the divide. Average effective rent rose 1.6% for Texas Class A properties during the last year while falling 7% for Class D. Florida showed similar progression from a 3.3% Class A gain to a 5.3% Class D decline. By contrast, Illinois average effective rent growth remained positive across the board.
In tighter markets, price class rent differences have been a matter of degree rather than direction. In many Sun Belt markets, the divide currently separates segments with rent growth from those experiencing outright declines.
The rent performance spread is not fully explained by occupancy conditions. Asking rents have generally continued to rise at the top of the market, while workforce housing segments have faced greater pricing pressure. Increased concession use in Classes C and D has widened the effective-rent gap further.
The result is an environment in which broad averages can conceal very different operating conditions. Improving overall occupancy can coexist with positive Class A rent growth and with significant Class D weakness within the same market.
Takeaways
Current multifamily performance is making clear that improving occupancy is not the same as restored pricing power. In markets with meaningful vacancy, strong absorption can be actively repairing balance without yet translating into an opportunity for aggressive rent growth.
At the current point in the cycle, a deeper look at market segments is much more informative than market averages. The same market can simultaneously have positive Class A rent growth, modest Class C performance, and considerable declines for Class D. Attributes such as property vintage, price class and lifecycle are especially important.
Supply pressure is receding unevenly. Some markets are three years removed from their peaks. Others are only one year removed. Conditions will likely continue to look different in those markets. Additionally, some markets are set to have relatively unchanged upcoming supply or even further declines while others will be ramping up again.
The next signs of a broader recovery would be absorption spreading back into seasoned stabilized inventory, and rents stabilizing farther down the price class spectrum. A broader reduction in concession use would provide additional evidence that operators are regaining pricing leverage across more segments of the market. At that point, strong apartment demand would be translating into broader rent momentum rather than simply improving market balance.
Disclaimer: All content and information within this article is for informational purposes only. ALN Apartment Data makes no representation as to the accuracy or completeness of any information in this or any other article posted on this site or found by following any link on this site. The owner will not be held liable for any losses, injuries, or damages from the display or use of this information. All content and information in this article may be shared provided a link to the article or website is included in the shared content.
Don’t wait! Save your spot right now for ALN’s 2026 Pulse Check with Jordan Brooks, Director of Analytics!