
The Multifamily Recovery Held Its Ground in Q3
The third quarter of 2026 looked softer than the second across a variety of multifamily metrics. Net absorption slowed, occupancy gains moderated, and concessions became more prevalent. Considered in isolation, recent performance could suggest the ongoing industry recovery has plateaued.
But quarterly comparisons are tricky because multifamily is a very seasonal sector, and because the current cycle is being shaped heavily by the changing new supply environment. In evaluating the latest quarterly results, a question arises.
Did the period represent a pause in the apartment recovery, a step backward, or simply a different phase of improvement? The evidence points more toward consolidation than deterioration.
Methodology notes: All figures refer to conventional properties with at least 50 units. Rent measures include asking and effective rents for new leases.
View the full monthly Markets Stats PDF
Q3 Cooled from Q2
Both net absorption and new units delivered declined from the second to the third quarter nationally. Absorption fell from about 159,000 units to 107,000 units and deliveries declined from about 79,000 to 71,000 units.
The larger slowdown in absorption also slowed the pace of occupancy improvement. After gaining 62 basis points in the second quarter, national average occupancy rose only 30 basis points in the third. National occupancy closed September just under 91%, making the last two quarters the first to consecutively close above 90% consecutively since the first half of 2023.
Average effective rent growth lost a bit of momentum in the third quarter. A gain of approximately 0.9% fell just short of the 1% gain from the previous quarter. Part of that story was the lease concession environment.
The average discount value remained unchanged at just more than four weeks off an annual lease, but availability ticked up to 26% of conventional properties offering a discount for new residents.
Taken together, these developments make clear that the third quarter was not an acceleration from the second. However, comparing the late summer period to the spring leasing season puts the most recent quarter at a methodological disadvantage. That the third quarter did not outperform the second tells little about the underlying position of the sector.
Recent Q3s Provide Better Context
The quarter held up reasonably well compared to the same portion of the calendar in recent years. Using 2022-2025 as a benchmark, third-quarter 2026 performance was encouraging.
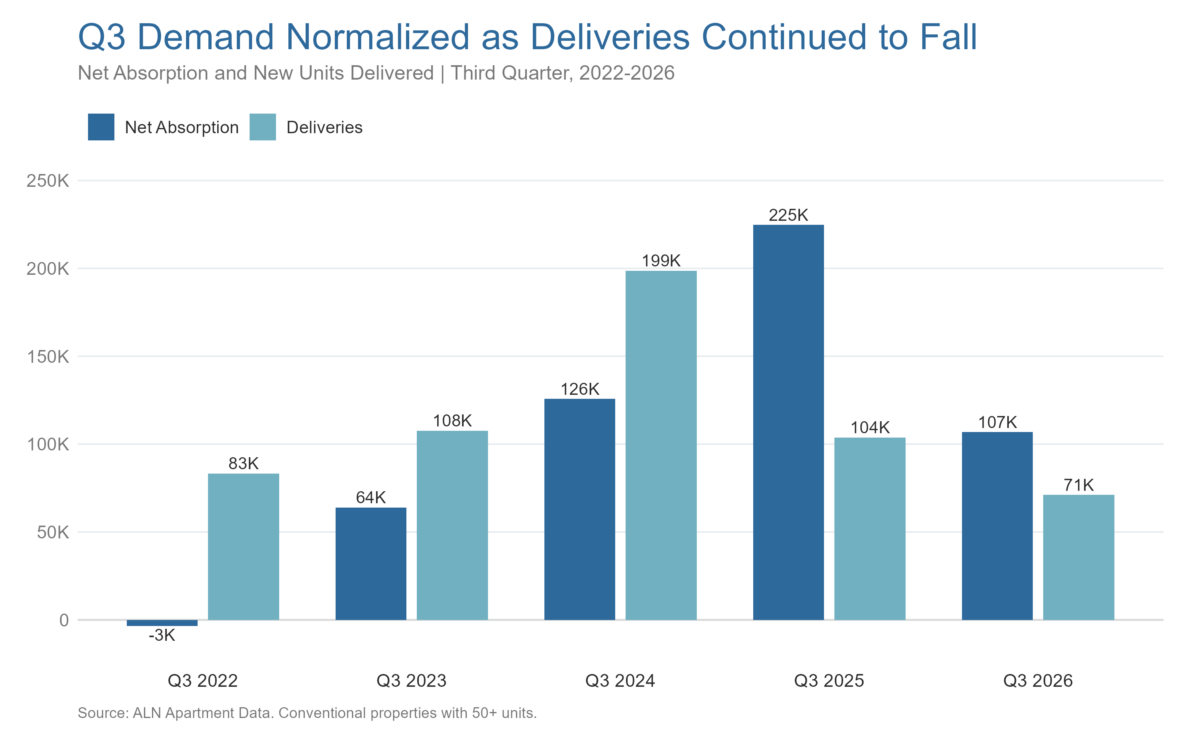
Average third-quarter absorption in that period was 103,000 units compared to this year’s 107,000 units. Average third-quarter new supply in that period was around 123,000 units versus the 71,000 units delivered this year.
Similarly, average occupancy change for the third quarter from 2022-2025 was a 10-basis point decline. This year, the third quarter managed a 30-basis point gain. Effective rent growth was the exception, with this year’s 0.9% gain matching the benchmark average.
However, 2022 and 2023 were unusually weak years for multifamily performance broadly. It should not be taken as an unmitigated win that this year outperformed a benchmark period in which half of the data points came from those two years.
Comparisons between Q3 2026 and Q3 2025 indicate some loss of momentum. For example, net absorption fell 52% year over year. That slowdown deserves attention because improved market performance has recently been driven by both robust demand and winnowed new supply.
That decline was partially mitigated by a 32% drop in deliveries. The decrease in new supply allowed average occupancy to continue improving, though at a more modest pace. The margin between net absorption and deliveries in the quarter fell from 121,000 units in Q3 2025 to 36,000 units in Q3 2026.
Taken together, the evidence points less to a sudden weakening in demand than to demand that has normalized seasonally while the amount of new supply it had to absorb continued to fall.
Every Market Is Changing. Find the Data That Moves Your Business Forward.
Whether you’re evaluating properties, monitoring market conditions, or identifying new business opportunities, ALN Apartment Data provides the research and tools to help you understand the multifamily markets that matter to you.
Rent Growth Broadened Faster Than Other Fundamentals
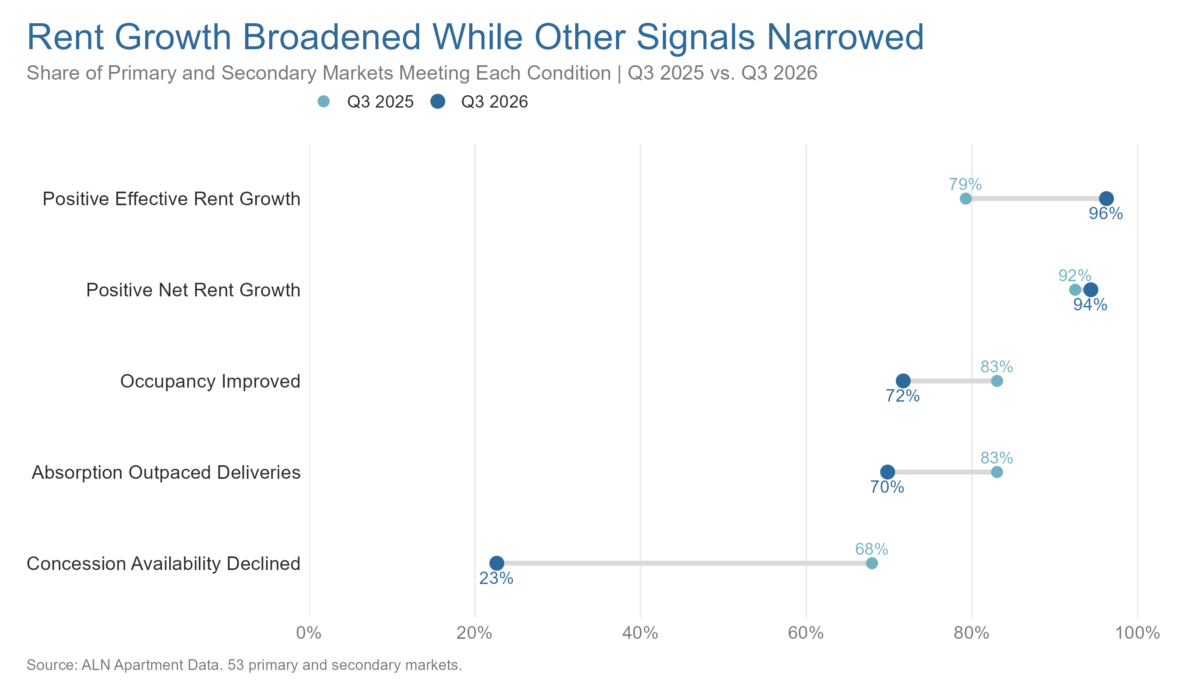
The quarter brought some promising changes below the national data. 96% of primary and secondary markets across the country recorded positive effective rent growth in the quarter. Another 94% of markets managed positive net rent growth, accounting for changes in both occupancy and rent. The only two markets not to see positive effective rent growth in the period were Seattle and Pittsburgh.
After a prolonged period of rent performance struggles, this broadening of pricing improvement – even over a relatively short time window – is a positive sign. Despite widespread rent gains in the quarter, though, other performance metrics were more mixed. About three-quarters of primary and secondary markets saw improved occupancy in the third quarter, while absorption outpaced new supply in about 70% of markets.
Concessions remain one area where the recovery has yet to take another meaningful step forward. Only about one-quarter of markets saw concession availability decline during the quarter, and the national share of properties offering concessions continued to rise.
A sustained decline in concession availability – either nationally or across a meaningful share of markets – would represent an important next stage in the recovery. Q3 did not provide that signal. Q3 2025 briefly moved further in that direction, with 68% of primary and secondary markets seeing concession availability decline, but that improvement did not prove durable. This year, only 23% of markets saw a decline.
What was encouraging was how rent performance held up despite the continued reliance on incentives. Operators did not materially deepen discounts during the quarter. Rather, more properties began using them. Even so, effective rent growth remained positive across nearly all primary and secondary markets.
Pricing improvement, in other words, has become much more widespread than improvement in concession availability. That suggests the recovery has continued to advance but has not yet reached the point where operators can broadly pull back on incentives without sacrificing leasing activity.
Lease-Up Pressure Fell, but 2027 Supply Is Still Coming
Lower deliveries continue to provide breathing room for an industry that needs it after a prolonged period of elevated supply. The decline in deliveries since the 2024 peak has allowed strong absorption to begin whittling away at the excess lease-up stock that had accrued during the 2022-2024 period.
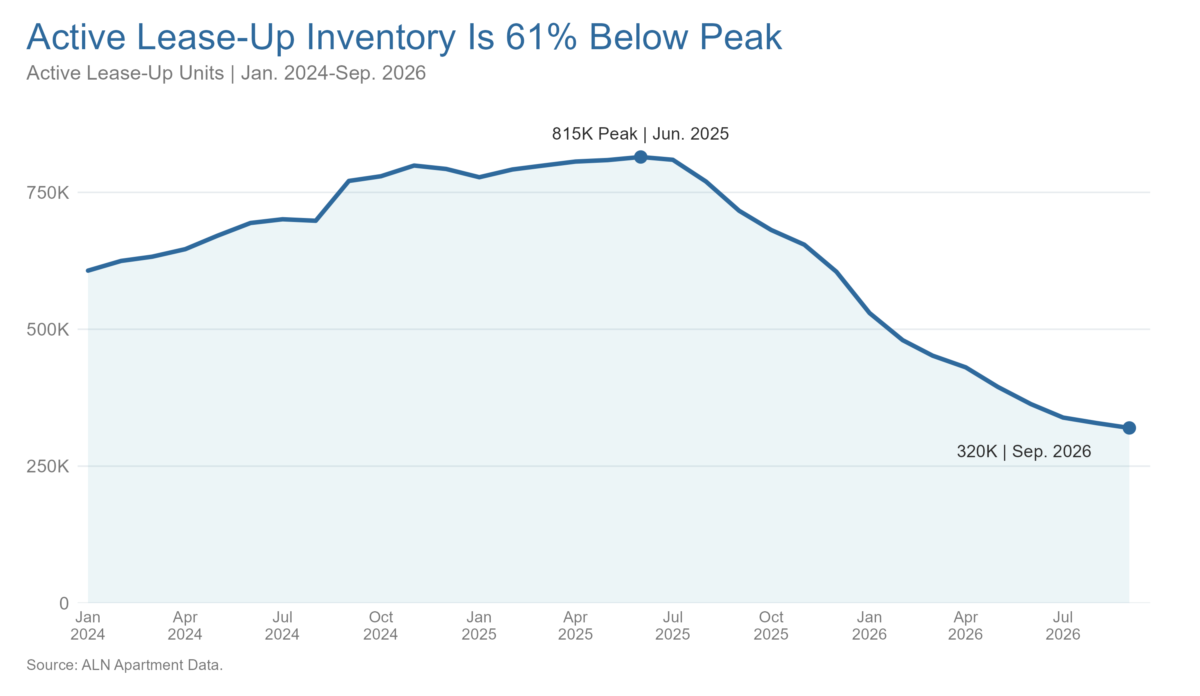
The downward trajectory in the number of units in active lease-up has been a real positive over the last year or so. The peak occurred in June 2025 with more than 800,000 units in active lease-up. By June 2026 that number was down to approximately 363,000 units.
The immediate competitive burden facing operators in the form of lease-up stock fell another 12% in Q3 as the total declined to about 320,000 units – down 55% from a year ago. Despite this improvement, the forward pipeline suggests supply pressure will remain a market force for the multifamily industry.
About 731,000 units were under construction at the end of the quarter – up 17% from a year ago. Nationally, expected deliveries for conventional properties of at least 50 units total approximately 313,000 for 2026 and about 383,000 for 2027. The 2027 total would be a 23% year-over-year increase from 2026 but would still represent a much more manageable quantity of new supply relative to the 2024 peak of more than 600,000 units.
Crucially, next year’s new units will be entering the market in a very different context than was the case for new supply over the last couple of years. The significant winnowing of lease-up stock means that new properties entering the market in 2027 should face more favorable leasing conditions. Supply pressure appears set to become a more concentrated force at the market level rather than a broad national dynamic.
Takeaways
The third quarter was less a new acceleration in the multifamily recovery than a period of consolidation. Demand cooled from the spring and from the same period in 2025, but the quarter did not represent a meaningful step backward.
Deliveries continued to moderate, lease-up stock continued to dissipate, and positive rent growth was widespread at the market level. However, lease concessions remain pervasive and next year’s anticipated increase in new supply provides a real test for continued tightening of market conditions.
The next question is whether those improving conditions can extend beyond the newer properties that have captured much of the recent demand and into the much larger base of mature stabilized inventory. That will be an important measure of whether the current recovery is becoming broader and more durable. It will also be the focus of this month’s Takeaways video.
Disclaimer: All content and information within this article is for informational purposes only. ALN Apartment Data makes no representation as to the accuracy or completeness of any information in this or any other article posted on this site or found by following any link on this site. The owner will not be held liable for any losses, injuries, or damages from the display or use of this information. All content and information in this article may be shared provided a link to the article or website is included in the shared content.