
Strong Demand Masks Stress in Existing Multifamily Stock
The first quarter of 2026 delivered a mixed but revealing set of signals for multifamily. New supply continued to ease relative to demand, but pricing power weakened rather than improved. On the other hand, rather than turning a corner, rent performance deteriorated. Conditions also varied meaningfully by market, property age and stabilization status.
All numbers refer to conventional properties of at least 50 units.
View the full monthly Markets Stats PDF
The Good News
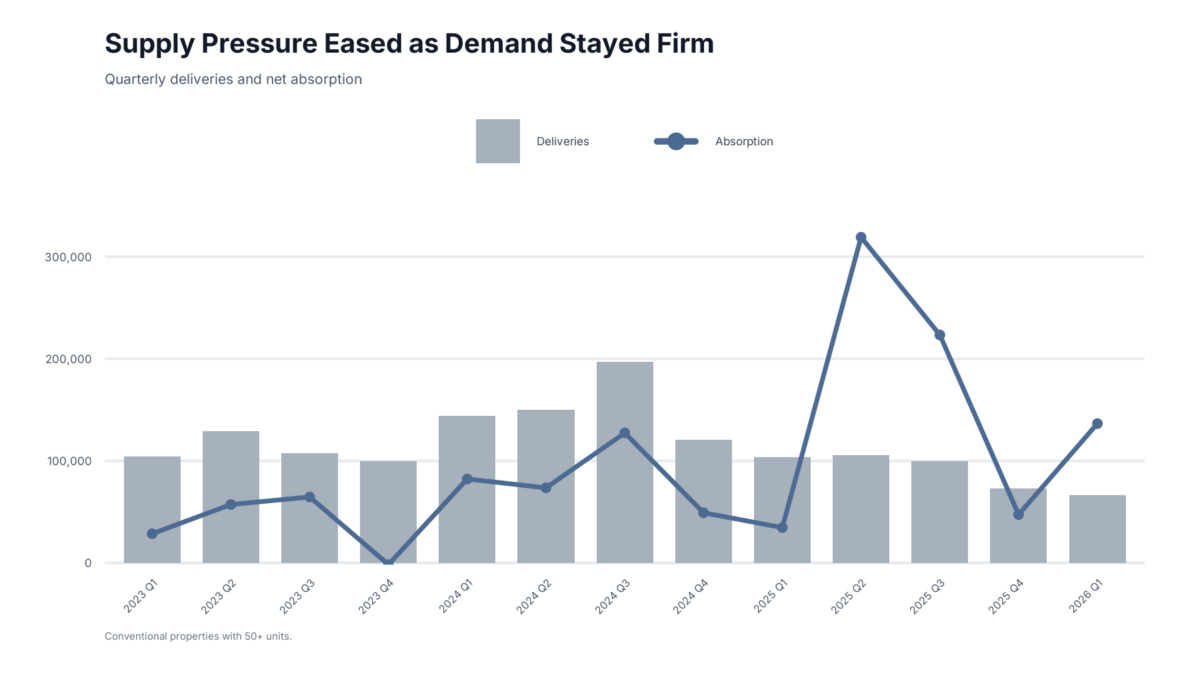
The good news in the quarter was that momentum in top-line national absorption continued into the new year. Net absorption of more than 130,000 units was the highest of the last decade and represented a dramatic increase from last year’s roughly 35,000 net absorbed units in the opening quarter.
Apartment demand entered 2026 with strong momentum after a three-year upswing capped by more than 600,000 net absorbed units nationwide in 2025. That pace did not appear likely to continue into 2026. The key question was whether demand would remain strong enough to improve fundamentals as new supply declined.
The first quarter, which is typically a seasonally soft period for multifamily demand, surprised to the upside. As a result, the demand side of the supply-demand equation looked encouraging at the national level through the first three months of the year.
The other side of that equation matched expectations coming into the year. A little less than 70,000 new units were delivered in the period – down from more than 100,000 units in the same portion of 2025. This year’s opening quarter deliveries were the fewest in more than five years. This pullback in deliveries provides much-needed breathing room for an industry still working through the effects of an exceptional supply wave over the past several years.
The combination of lower new supply and higher net absorption lifted national average occupancy by 0.6 percentage points to 90%. This was the first occupancy improvement for a first quarter in more than five years. For properties that entered 2026 already stabilized, average occupancy declined by 0.1 percentage points to just over 92%.
Caveats for Robust Demand
The national net absorption total was a headline-worthy number, but the strength was far from broad-based. The bifurcation maps onto price class fairly well, but the more important dividing line was property age and stabilization status.
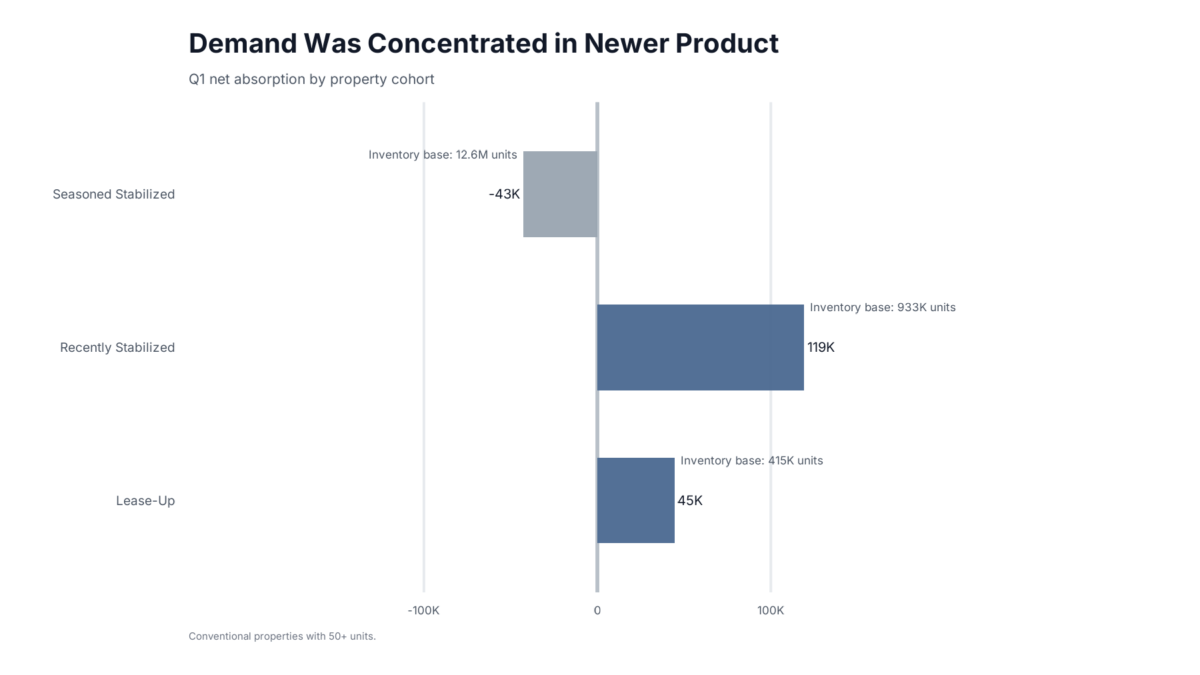
For properties that stabilized within the last 18 months, net absorption in the first quarter was nearly 120,000 units. Properties still in lease-up accounted for a little more than 40,000 net absorbed units during the quarter. The basket of properties made up of those two groups totaled about 1.35 million units. That is where the positive realized demand has been.
Properties that were stabilized more than 18 months ago suffered a net loss of more than 40,000 leased units in the period. That basket of properties includes more than 12.6 million units. Across most of the multifamily stock, positive absorption was absent in the first quarter. That does not make 2026 unusual, but it is a critical caveat to the strong national absorption figure.

Planning on attending or exhibiting at Apartmentalize? Come see us in Booth 1900 to talk about data and how we can help your business!
Request a Strategy Demo
Market tier mattered less than geography. Seasoned stabilized properties struggled across primary, secondary, tertiary, and micro markets alike. Geographic differences, however, were pronounced.
For seasoned stabilized properties, absorption weakness was most acute in Florida and Texas, especially in those states’ primary markets. Dallas – Fort Worth and Houston were in a category of their own. DFW posted a net loss of about 6,400 leased units during the period, while Houston lost about 5,500. Tampa, Orlando, and Austin also posted weak absorption in this segment.
Those same markets performed well in newly stabilized properties and in properties still in lease-up. These areas illustrate the effects of sustained elevated supply. Generous and widespread lease concessions for new properties, combined with demand that remains insufficient to absorb all available units, have allowed newer assets to capture leasing activity at the expense of existing stock.
Rent Growth Underperformed
As with apartment demand, rent growth is typically muted during the first few months of the year. Even so, the first quarter underperformed recent years on effective rent growth for new leases.
National average effective rent declined by 0.1% during the quarter to $1,765 per month. Although modest, it was the first first-quarter decline in national average effective rent in the past five years. Over a slightly longer horizon, national average effective rent has declined by 1.2% over the past six months. That six-month stretch also corresponds with the weakest seasonal period of the calendar for multifamily rent performance.
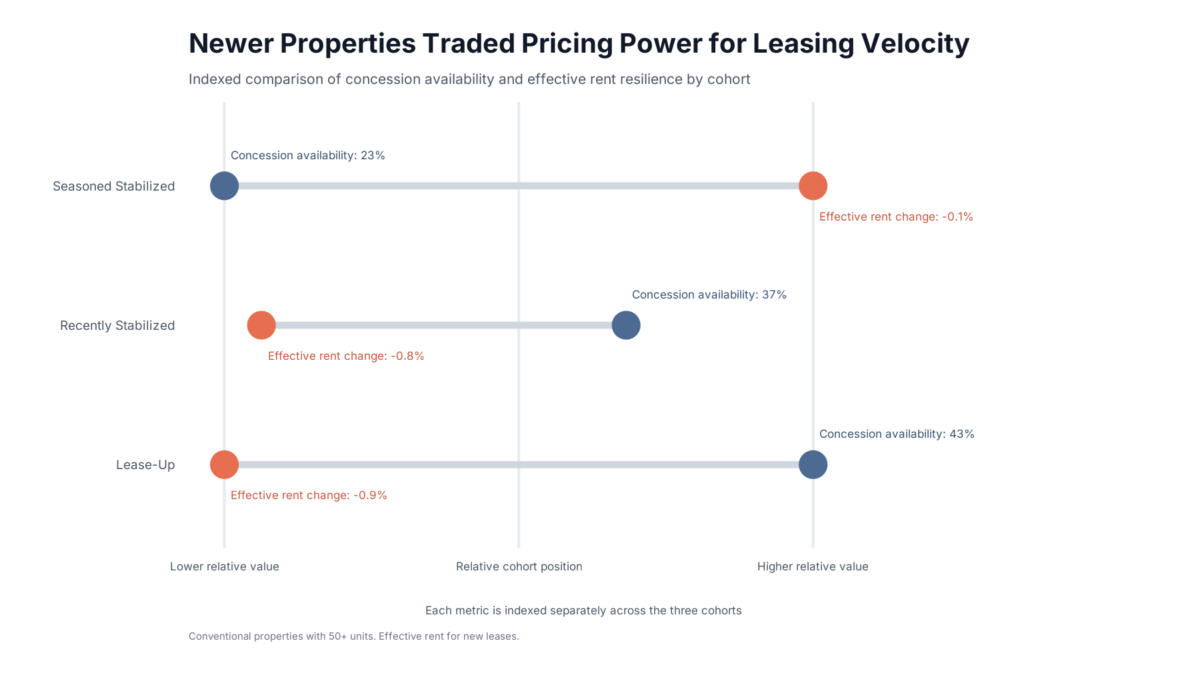
The inverse of the absorption bifurcation occurred in rent performance. Average effective rent declined most sharply in newer assets: down 0.9% in lease-up properties and 0.8% in properties stabilized within the last 18 months. This compares with just a 0.1% decline in properties stabilized more than 18 months ago.
Lease concessions were a major driver of that pattern. Strong absorption in newer properties has been supported in part by widespread concessions. Nearly 45% of lease-up properties ended March offering a discount to new residents, and nearly 40% of recently stabilized properties did the same. That compared with fewer than one-quarter of properties that stabilized at least 18 months ago.
Discount depth also mattered. Among lease-up properties offering concessions, the average discount at quarter-end equaled 6.4 weeks free on a 12-month lease. The corresponding figure was 5.9 weeks for recently stabilized properties and 4.0 weeks for properties stabilized more than 18 months ago.
One question entering 2026 was whether demand could remain robust as operators reduced lease concessions. It is still too early in the year for a definitive answer, but first-quarter results suggest realized demand remained closely tied to concession activity.
Takeaways
The first quarter of 2026 brought improved national fundamentals, but the improvement was narrow and uneven. New supply receded meaningfully from recent highs, and national net absorption was exceptionally strong. However, that absorption was very concentrated in newer properties, and it came alongside significant lease concessions.
Rent growth remained elusive. That is not unusual for this point in the calendar, but lease concessions remained a major headwind beyond normal seasonality.
Looking ahead, stronger net absorption in the second quarter could ease some concession pressure, but a meaningful unwinding will likely take longer. In the meantime, effective rent growth may remain clustered in markets that have avoided substantial new supply in recent years.
Disclaimer: All content and information within this article is for informational purposes only. ALN Apartment Data makes no representation as to the accuracy or completeness of any information in this or any other article posted on this site or found by following any link on this site. The owner will not be held liable for any losses, injuries, or damages from the display or use of this information. All content and information in this article may be shared provided a link to the article or website is included in the shared content.