

A Retrospective on the Third Quarter
Summer is in the rearview mirror and autumn has arrived. For the multifamily industry, that means the traditionally more robust portion of the calendar for apartment demand and rent growth has now come and gone for 2023. However, as the final quarter of the year begins to unfurl, it does so on the back of the best quarterly demand in multifamily since 2021.
As usual, all numbers will refer to conventional properties of at least fifty units.
View the full monthly Markets Stats PDF
New Supply and Net Absorption
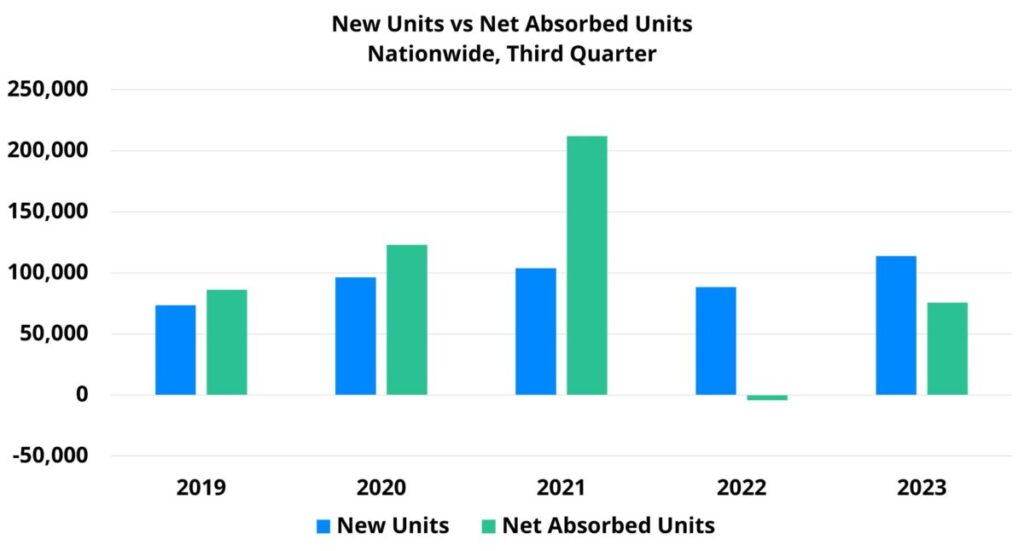
The third quarter of 2023 marked an incredible fourth consecutive quarter with national multifamily deliveries above 100,000 units. Approximately 115,000 units delivered was less than the roughly 130,000 units delivered in the second quarter, but new supply in the period was nevertheless the third highest among the last dozen quarters.
The market leaders in recent deliveries include most of the usual suspects. Dallas – Fort Worth has been in a category of its own with around 9,500 new units delivered in the third quarter. Houston, Austin, and Atlanta were also near the top of the list. In the top ten were Florida markets such as Jacksonville and Orlando as well as gateway markets like New York, Washington DC, and Los Angeles.
Takeaways Episode 45
Once adjusting for market size, some other areas come into focus for new supply in the period. The more than 1,100 new units introduced across the state of Montana in the period equaled about 10 percent of existing conventional stock there. Markets like Augusta-Portland, ME, Rapid City, SD, Sioux Falls, SD, and Myrtle Beach were other leaders in size-adjusted new supply in the third quarter.
Quarterly new supply was substantial, but so was apartment demand. After a rocky start to the year, net absorption has steadily improved quarter-over-quarter in a much more standard seasonal pattern than was present in the 2020 through 2022 period. More than 75,000 net absorbed units in the third quarter was the most of any quarter since the final three months of 2021. For comparison, national net absorption in the same portion of 2022 was negative by more than 4,000 units.
A strong August and September dramatically changed the tone of the quarter and the year. After steady but relatively muted improvement in the spring was followed by a step back in demand in early summer. Then, more than 60,000 net units were absorbed across the country in August and September – 43% of year-to-date absorption.
Average Effective Rent and Lease Concessions
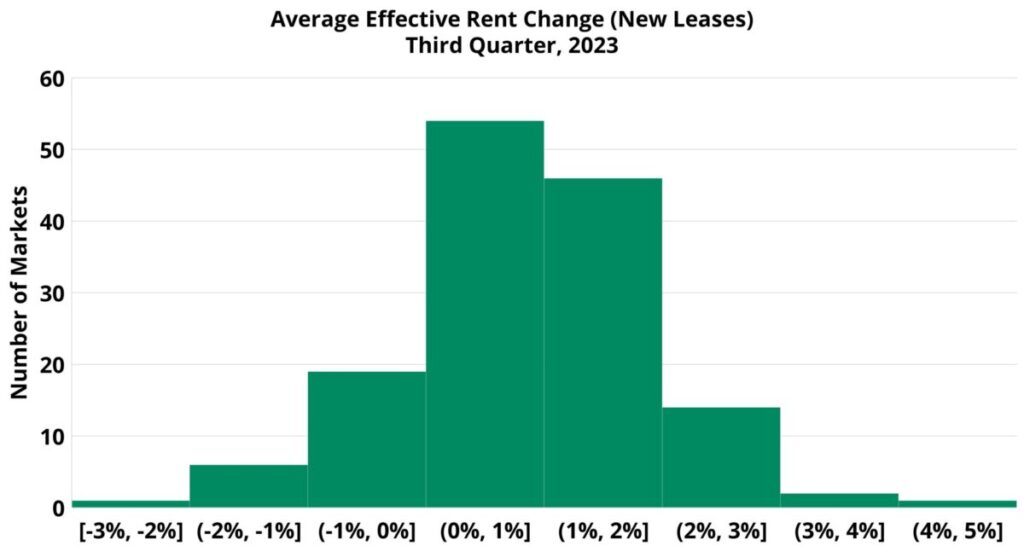
Improved apartment demand in the third quarter came as rent growth cooled. A 0.4% increase in the national average effective rent for new leases was significantly lower than the 1.3% gain from the second quarter and was lower than all but two quarters in the last three years. Average effective rent growth was negative in the final three-month period of 2019, 2020, and 2022. Given seasonal trends and the current state of the environment facing the multifamily industry, the third quarter’s gain may well be the last increase of 2023.
In general, smaller markets without much new supply in the period and above average occupancy rates led the way in rent growth. Anchorage, AK (5%), Lexington, KY (3%), Columbia, MO (3%), and Augusta-Portland, ME (3%) fit that bill. One exception would be Rapid City, SD where a quarterly average effective rent gain of 3% came along with some new supply and a below average occupancy rate.
Those markets that struggled with rent performance in the period tended to be those with a fair bit of new supply and occupancy levels below the national average. Boise (-1%), Orlando (-1%), Austin (-2%), and Fort Myers – Naples (-3%) were examples of that dynamic. One exception was Fayetteville, NC where a 2% average effective rent decline occurred in a period with no new supply and a market average occupancy above the national rate.
Lease concession availability continues to play a more prominent role in the industry. A fifth straight quarterly increase in the availability of discounts for new leases meant that approximately 15% of conventional properties were offering a lease concession for new residents to end September. This availability rate was the highest to end a quarter since the opening period of 2021, when lease concessions were still receding from their 2020 peak.
Takeaways
Within the context of the last two years, the third quarter was fairly positive for multifamily. The deluge of new supply that will not be slowing nationally until at least 2025 continued apace, but there was also a material improvement in apartment demand in the period. Rent growth, while tepid, at least remained in positive territory. Similarly, although national average occupancy did decline slightly, the third quarter was the third straight quarter in which the decline in average occupancy winnowed relative to the prior period.
Despite the fact that the third quarter arguably surprised to the upside, serious headwinds remain for the multifamily industry in the coming months. The continued tightness of the labor market means that Federal Reserve interest rate policy may remain more hawkish to close 2023 and open 2024 than was hoped earlier this year. Ramifications will be felt throughout the economy.
Student loan payments, an out of sight, out of mind expense for most of the forty-three million borrowers across the country over the last three years have now returned. The industry has yet to see what the effect will be of residents paying both student loans and the rent increases of the last few years at the same time. Given the cracks that have begun to emerge in the financial position of households, there is sure to be some level of deleterious effect.
And then there is seasonality. So far, this year has featured a much more typical seasonal pattern in multifamily demand and rent growth. Were that to be the case to end the year, aside from any other exogenous influences, further softening would be anticipated over the next four or five months.
Even with some challenges ahead, 2023 annual performance metrics will end up rosier than they otherwise would have thanks to a solid third quarter.
The Key to Data-Driven Decisions
Unlock unparalleled insights with our comprehensive platforms. Schedule your personalized demo and witness the power of accurate, reliable multifamily data today!
Disclaimer: All content and information within this article is for informational purposes only. ALN Apartment Data makes no representation as to the accuracy or completeness of any information in this or any other article posted on this site or found by following any link on this site. The owner will not be held liable for any losses, injuries, or damages from the display or use of this information. All content and information in this article may be shared provided a link to the article or website is included in the shared content.