

Results Mixed in the First Quarter
This year’s opening quarter included multiple interesting developments that will have ramifications for multifamily performance as 2025 unfolds. Outside the industry, in just the first few days of April, seismic U.S. trade policy changes are just beginning to make their early impact felt. As has been the case for the last handful of years, there will be no shortage of crucial drivers of multifamily performance to monitor this year.
A recent ALN blog post detailed a notable shift in demand by price class. This month’s newsletter will feature a broader review of first quarter industry performance and what it may portend for the rest of the year.
All numbers will refer to conventional properties of at least fifty units.
View the full monthly Markets Stats PDF
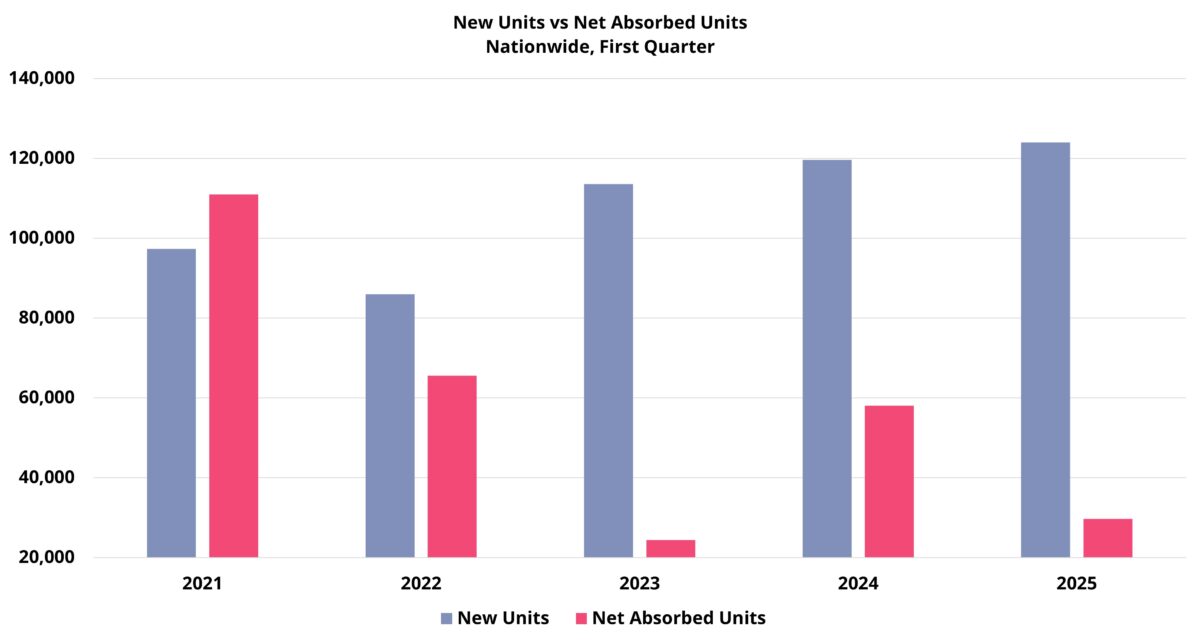
Supply Rose, Demand Dropped
Approximately 124,000 new units were delivered nationally in the opening quarter of the year. This level of new supply represents the high-water mark for this cycle and was about 4% higher than last year’s total in the period. 2025 is now the third consecutive year in which first quarter deliveries exceeded 100,000 units.

Join Jordan Brooks on May 28, 2025 at 10:00 AM Central for an exclusive webinar exploring key national trends.
For the most part, the markets that have been new supply leaders in recent years led the way in deliveries in the quarter. About 8,000 new units in Dallas – Fort Worth market topped all markets in the period but was also about 2,500 units lower than last year. Austin was just behind with around 7,400 new units. This was a massive quarterly figure for a market of its size and a nearly 2,000-unit increase from last year.
Houston was the other Texas market near the top of the new supply list along with other typical areas like Charlotte, Salt Lake City, and Tampa.
As the supply surge continued to crest, apartment demand stumbled. National net absorption of about 30,000 units was barely half of last year’s 58,000-unit total for the period. The opening months of 2025 have created the first break in the steady upward trend in multifamily demand since the start of 2023.
Properties that entered the year already stabilized suffered a net loss of more than 72,000 leased units in the first quarter. This was the worst opening quarter for stabilized demand in years – by a wide margin. This dovetailed with the struggles for Class B and Class C properties discussed in a recent ALN blog post.
The Sunbelt was well-represented among market leaders in net absorption, accounting for six of the top ten markets. But New York, Philadelphia, Cleveland – Akron, and Indianapolis also stood out.
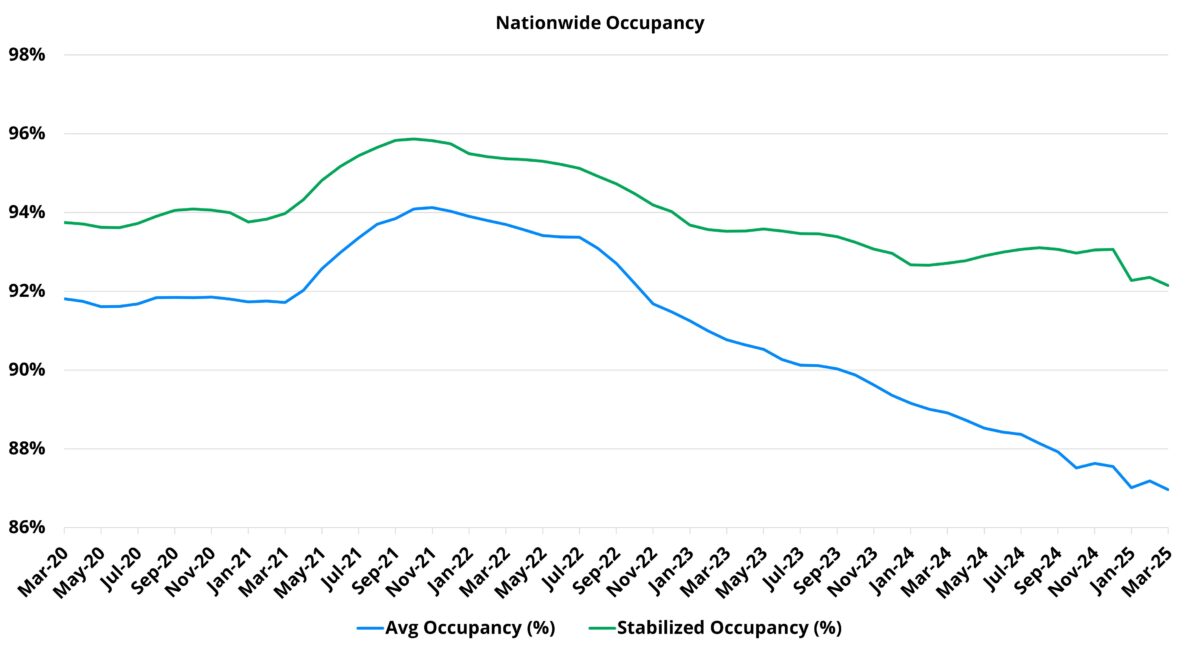
Average Occupancy Remained in Freefall
National overall average occupancy fell sixty basis points to finish the quarter at 87%. This decline in the period was slightly larger than last year’s but slightly smaller than that from 2023. Should demand remain muted this year, any moderation in further occupancy decline will have to come from the expected slowdown in deliveries in the back half of the year.
After demand for stabilized properties regained its footing in 2024 following two straight years of negative net absorption, there was reason for cautious optimism coming into 2025 that stabilized occupancy could begin to recover. The traditionally stronger middle quarters of the year remain, so that optimism should not yet be thrown out. However, early returns have not been encouraging. The massive net loss of leased units drove the stabilized average occupancy down by sixty basis points in the first quarter. This was the largest decline for this portion of the calendar in years.
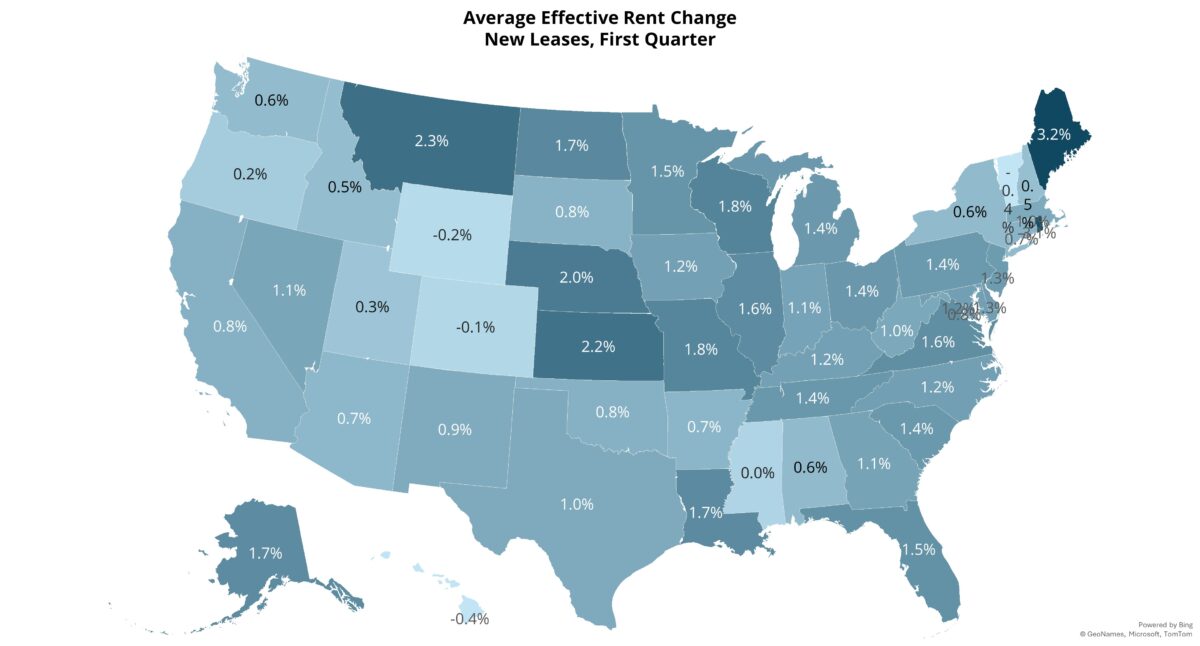
Average Effective Rent Growth Improved
Average effective rent growth for new leases rose by 1.1% nationally in the quarter. This easily surpassed the 0.5% and 0.3% gains from 2023 and 2024, respectively.
The positive rent performance may seem counterintuitive, but coming into 2025 rent growth had been on an upward trajectory for two years. Additionally, market conditions appeared poised for improvement given the encouraging demand trends from last year and the expected decline in new supply for 2025. Even to start this year, national apartment demand was strong in February – it was just sandwiched between two disappointing months.
A tailwind for rent growth to open 2025 was solid Class A apartment demand. Net absorption bettered the opening quarter of four of the previous six years. Average effective rent for the Class A subset rose by 2.4% in the period this year. That was just a hair below 2022 for the largest first quarter gain in recent years. The same was true for the 2.1% increase for the stabilized Class A subset.

Unlock the latest insights and rental market trends anywhere in the United States with ALN Online!
Regional variance was also notable. NAA regions 3 (Great Lakes), 5 (Midwest), and 9 (Southeast Gulf) all finished the period with average effective rent growth considerably above the national average.
The Midwest was one of only two regions where net absorption outpaced new supply. It also finished March among the national leaders in average occupancy, the lowest average effective rent, and had the positive supply and demand balance thanks both to below-average supply and above-average demand. The result was a 1.7% average effective rent gain in the quarter – the highest of any region.
The Great Lakes region fit a similar profile to the Midwest and managed a 1.5% average effective rent increase. For the Southeast Gulf region, Florida markets drove the above-average rent growth despite continued supply pressure thanks to robust demand.
Takeaways
The year has not gotten off to an ideal start for the multifamily industry. Performance metrics have softened even accounting for seasonality. New supply is still expected to slow this year compared to last, but that slowdown will probably not materialize until the second half of the year. Even then, deliveries are likely to be higher than in any recent year except for 2024.
In the face of this continued supply pressure, a step backward for apartment demand presents fresh challenges and could reverse the positive momentum for rent growth. However, too much should not be taken from a single quarter. Longer-term trends have been nearly uniformly positive, and the more reliable portion of the calendar for the industry has now arrived.
Disclaimer: All content and information within this article is for informational purposes only. ALN Apartment Data makes no representation as to the accuracy or completeness of any information in this or any other article posted on this site or found by following any link on this site. The owner will not be held liable for any losses, injuries, or damages from the display or use of this information. All content and information in this article may be shared provided a link to the article or website is included in the shared content.
ALN Apartment Data delivers industry-leading multifamily market intelligence, empowering thousands of apartment industry professionals with accurate, research-driven insights.
Owners and Management Companies
Leverage ALN OnLine for property search, rental market analysis, and competitor benchmarking—ensuring data-driven decision-making. Discover more about ALN OnLine here
Multifamily Suppliers & Service Providers
Supplier Partners nationwide trust Vendor Edge Pro to identify property management companies, target apartment communities, and optimize B2B sales strategies with our curated data and must-have features like sales routing. Get started with Vendor Edge Pro today
Enterprise-Level Multifamily Suppliers scale their business with Compass, the ultimate tool for nationwide property and management company insights, targeted prospecting, and market expansion strategies. Explore Compass now
Not sure how we can help you? Learn more about all of our services for Multifamily Professionals