Rent Growth: How Much is Too Much?
Lingering pandemic issues, supply chain challenges and labor shortages, inflation concerns, and sticky unemployment have all had an impact in the first half of 2021. After a challenging 2020 for the multifamily industry and beyond, these further impediments could have prolonged the flagging conditions in the industry. And yet, thanks to strong fundamentals, pent-up demand, and a perpetual housing supply shortage – the industry has logged numbers not seen in years through the first half of this year.
A brief summary of the national numbers was recently featured on the ALN blog, and so in this month’s newsletter, more space will be devoted to some specific areas of interest through the first half of 2021.
Market Size
There have been some interesting developments this year across the urban-suburban-outlying divide as the multifamily rebound has progressed, especially a lively bounce back in urban regions. Another area where some differences have emerged is between markets of varying size. ALN assigns each market to one of four tiers based on the size of its multifamily presence, with Tier One markets being the 33 largest in the country.
View the full monthly Markets Stats PDF
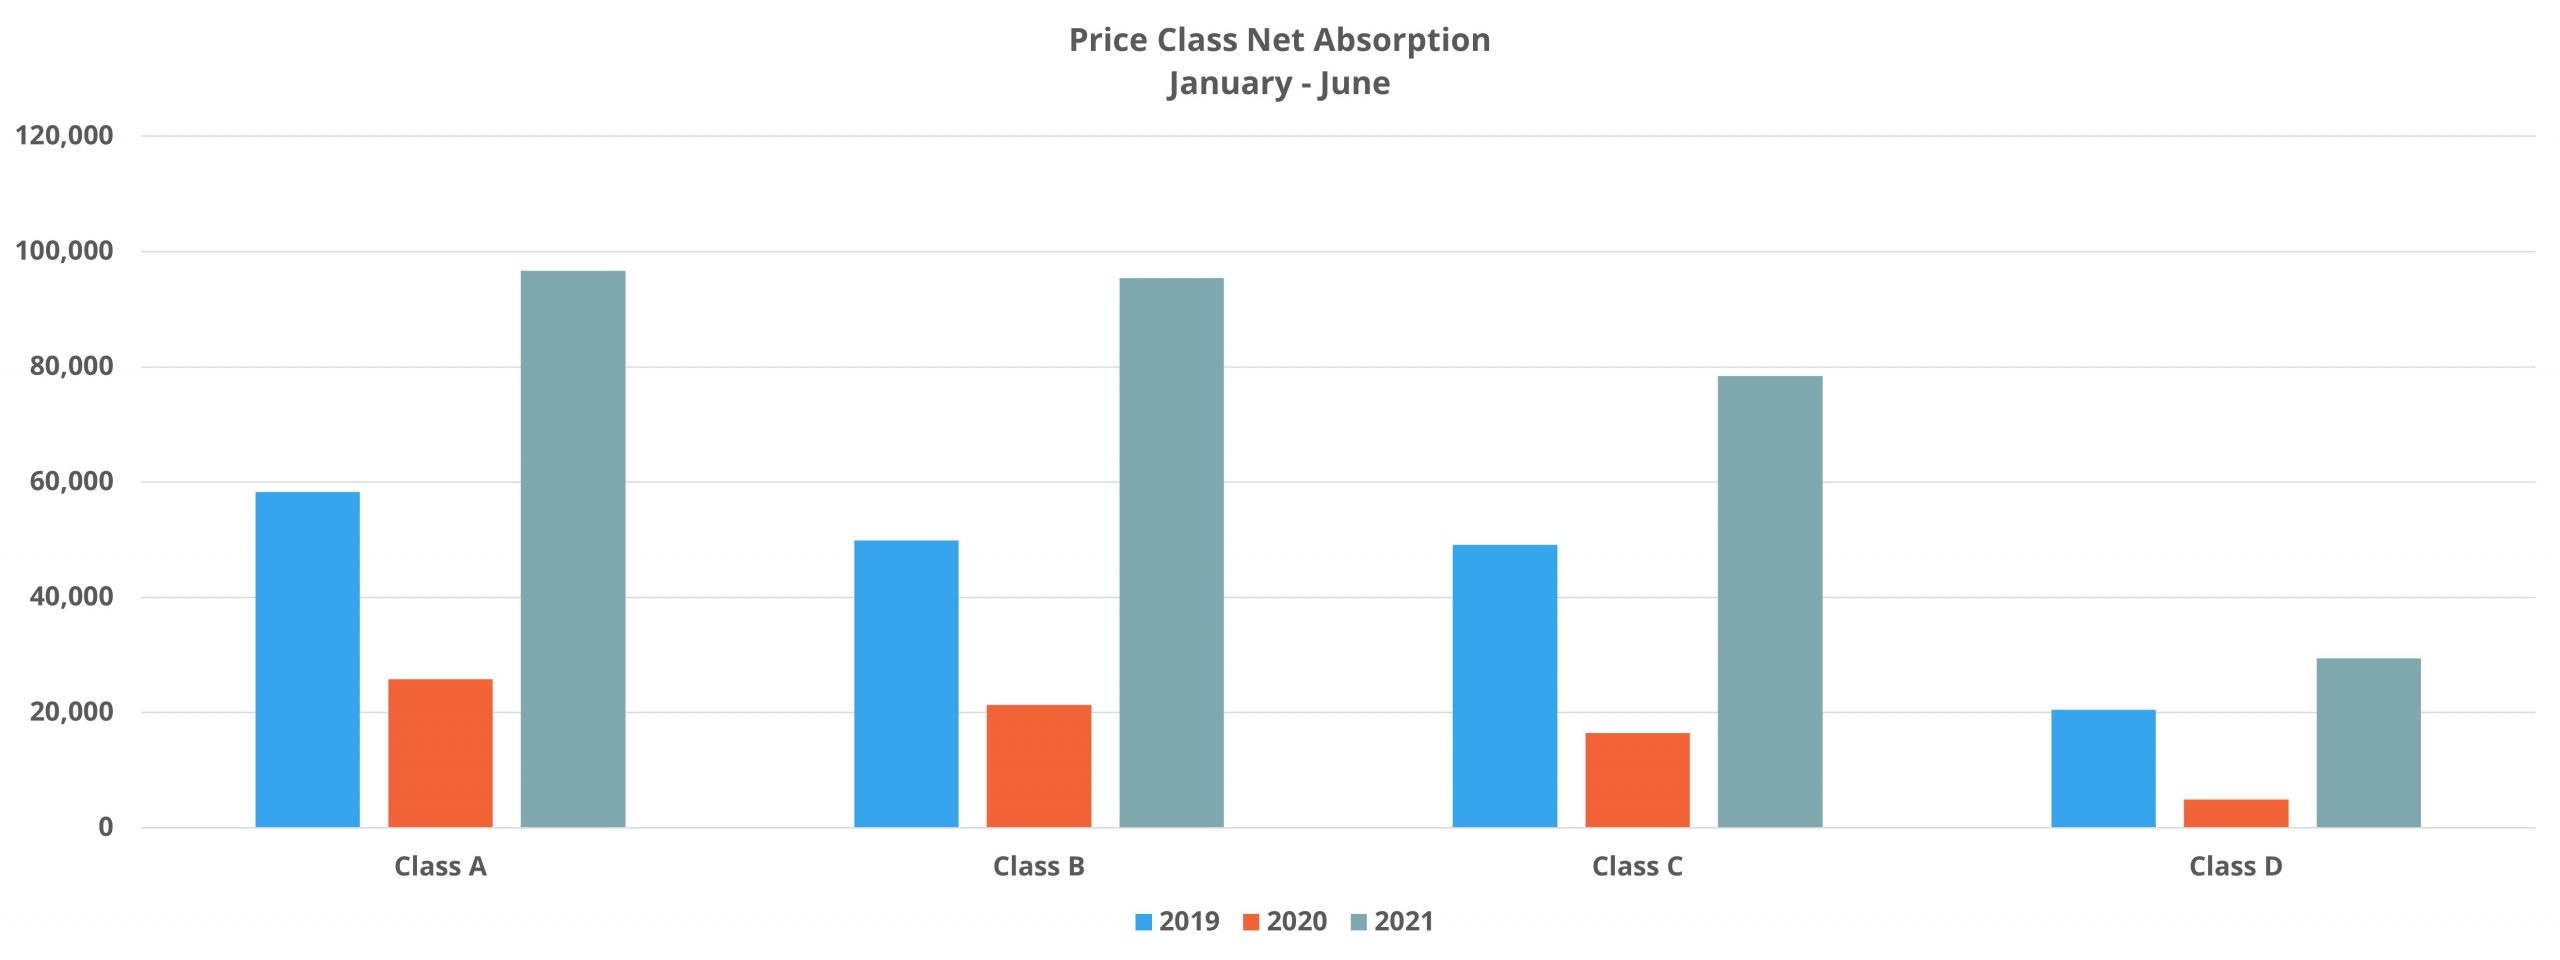
Although apartment demand has been stronger through the first half of this year than in even pre-pandemic 2019 in three of the four market tiers, the over-performance was most pronounced in the larger markets. Tier One net absorption totaled more than 230,000 units through June. This was a 67% increase from the same portion of 2019 in Tier One markets and, in fact, was more than total US net absorption at the midway point of 2019.
The resurgence was even more pronounced in Tier Two markets, with about 40,000 previously unoccupied units leased in the period representing a 75% increase from the 2019 figure. Only the smallest markets, Tier Four, underperformed 2019. Net absorption of just under 4,000 units fell short of the approximately 4,600 from 2019. In particular, energy-heavy areas such as Fargo, ND and Beaumont, TX struggled, as well as the tourist destination of Honolulu.

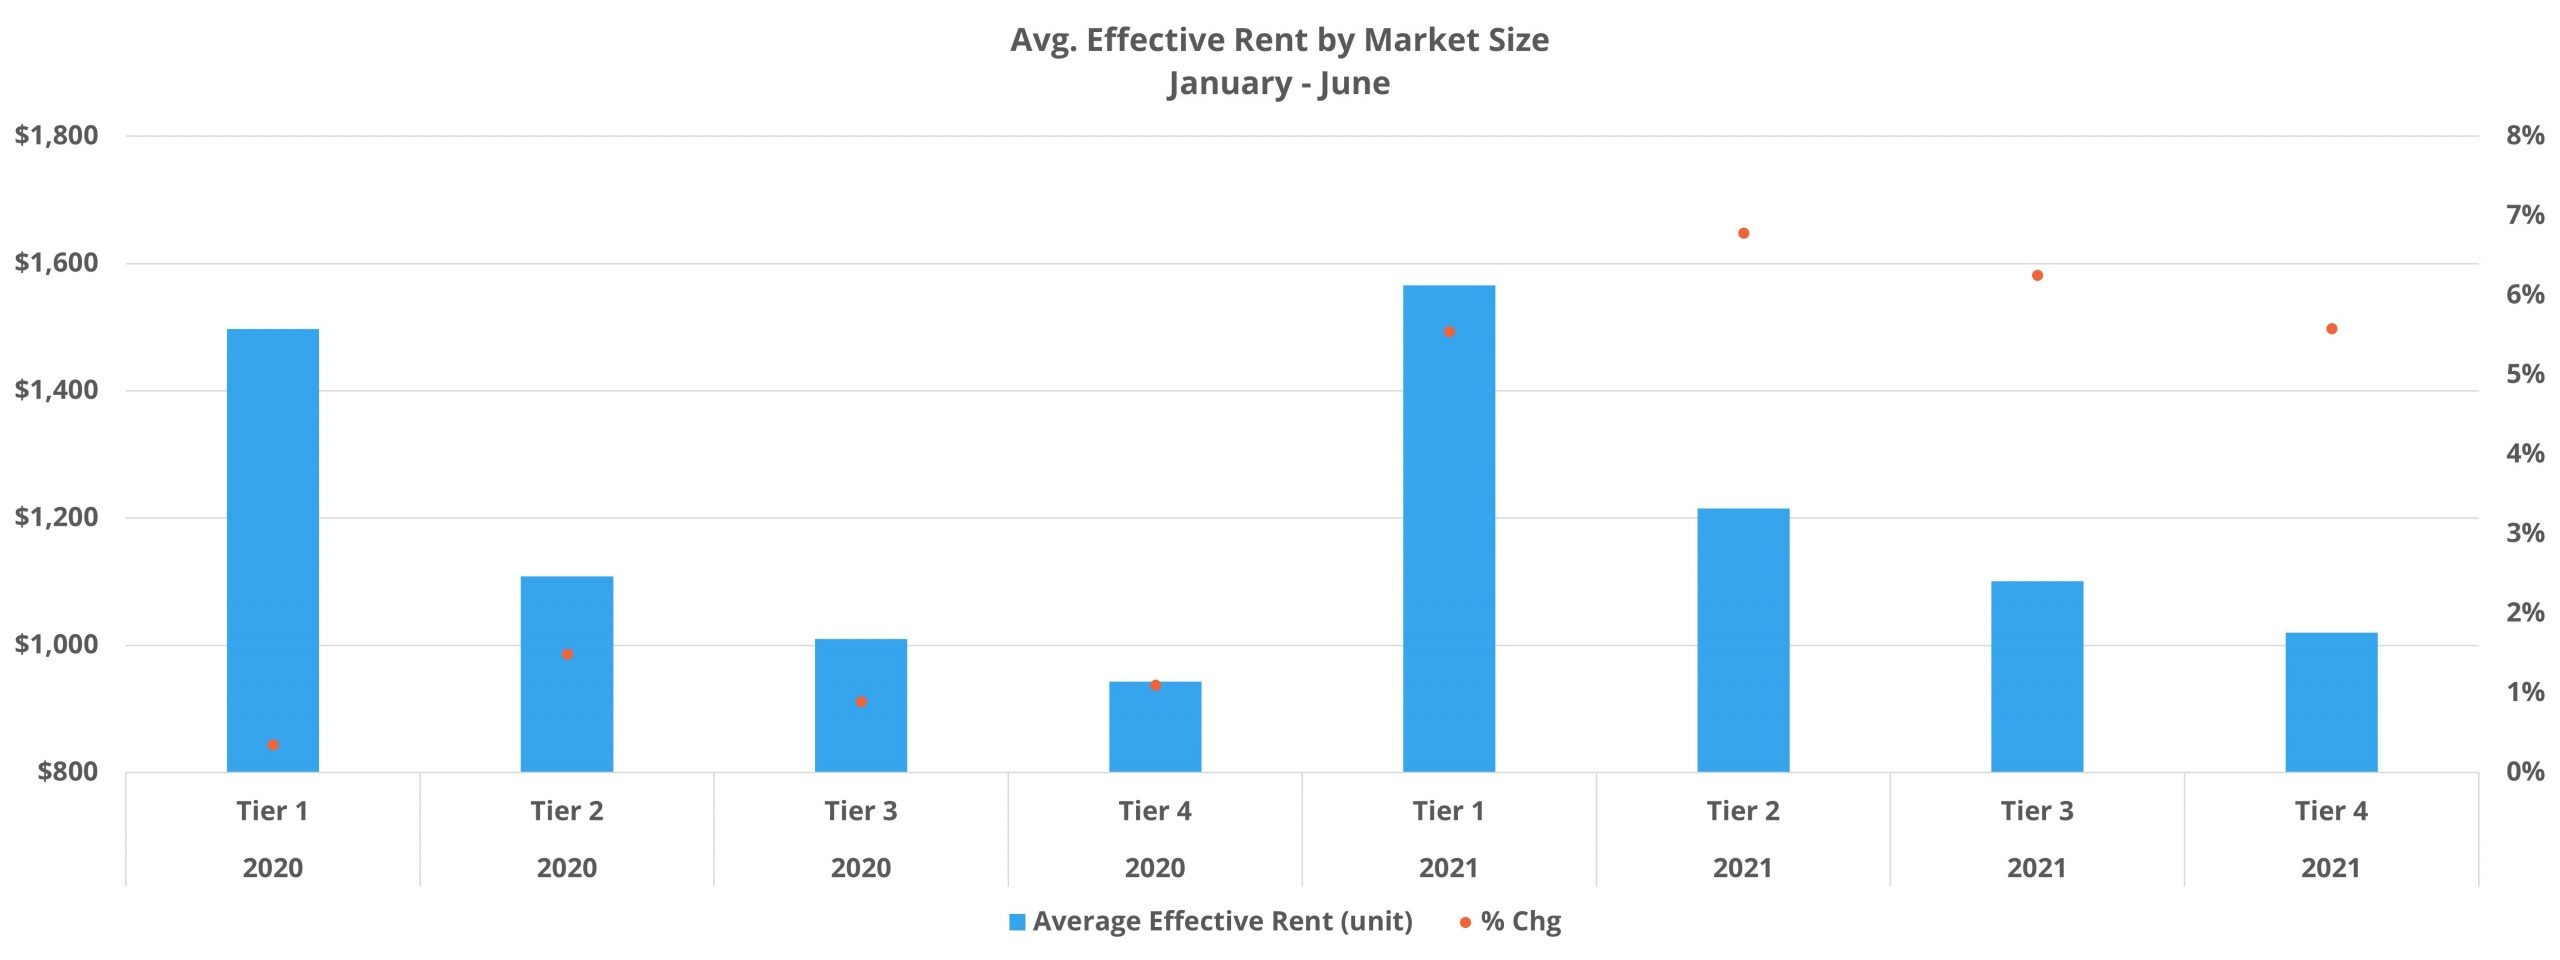
In a continuation of developments from earlier in the year, lease concessions have declined significantly for all four groups in the first half of the year. This holds true both for discount availability and the average discount value. Declining reliance on concessions undoubtedly aided rent growth, but increased aggressiveness on the part of operators as indicated by average asking rent was the more impactful driver. In terms of average effective rent, the largest and the smallest markets managed the smallest gains, though that characterization is especially relative this year. Tier One and Tier Four markets each added around 5.5% to average effective rent so far this year, while Tier Two and Tier Three markets gained almost 7% and just over 6% respectively.
Price Class
Through the first few months of 2021, the Class A segment was leading the way in apartment demand and in average effective rent growth. The top of the market has continued to perform well, but Class B properties also came on strong in recent months.
The Class A and Class B subsets each absorbed around 95,000 net units in the first six months of the year. With Class A properties accounting for a smaller share of overall units, the result was a show of strength for Class A demand. However, when comparing absorbed units this year to the first half of 2019, Class B properties saw a larger increase. A 66% gain for Class A is nothing to sneeze at, but Class B absorption was 91% higher than in the same portion of 2019. Each also added just over 7% to average effective rent – a level not approached for either of the top two price tiers for this portion of the calendar since 2017.

Apartment demand has been higher in the bottom two price tiers compared to 2019 as well, just not to the same extent. Class C properties leased just under 80,000 net units that were previously unoccupied, and Class D properties absorbed around 30,000 net units. As with demand, Class C average effective rent growth was significant at 5% but did not reach the level of the top two groups in the period. Class D properties added 2.5% to average effective rent after an uptick in the average concession package value compared to the start of the year.

In our series Takeaways, ALN Apartment Data Senior Market Analyst, Jordan Brooks, shares more insight into the final thoughts on the April 2024 newsletter article…
Specific Markets of Note
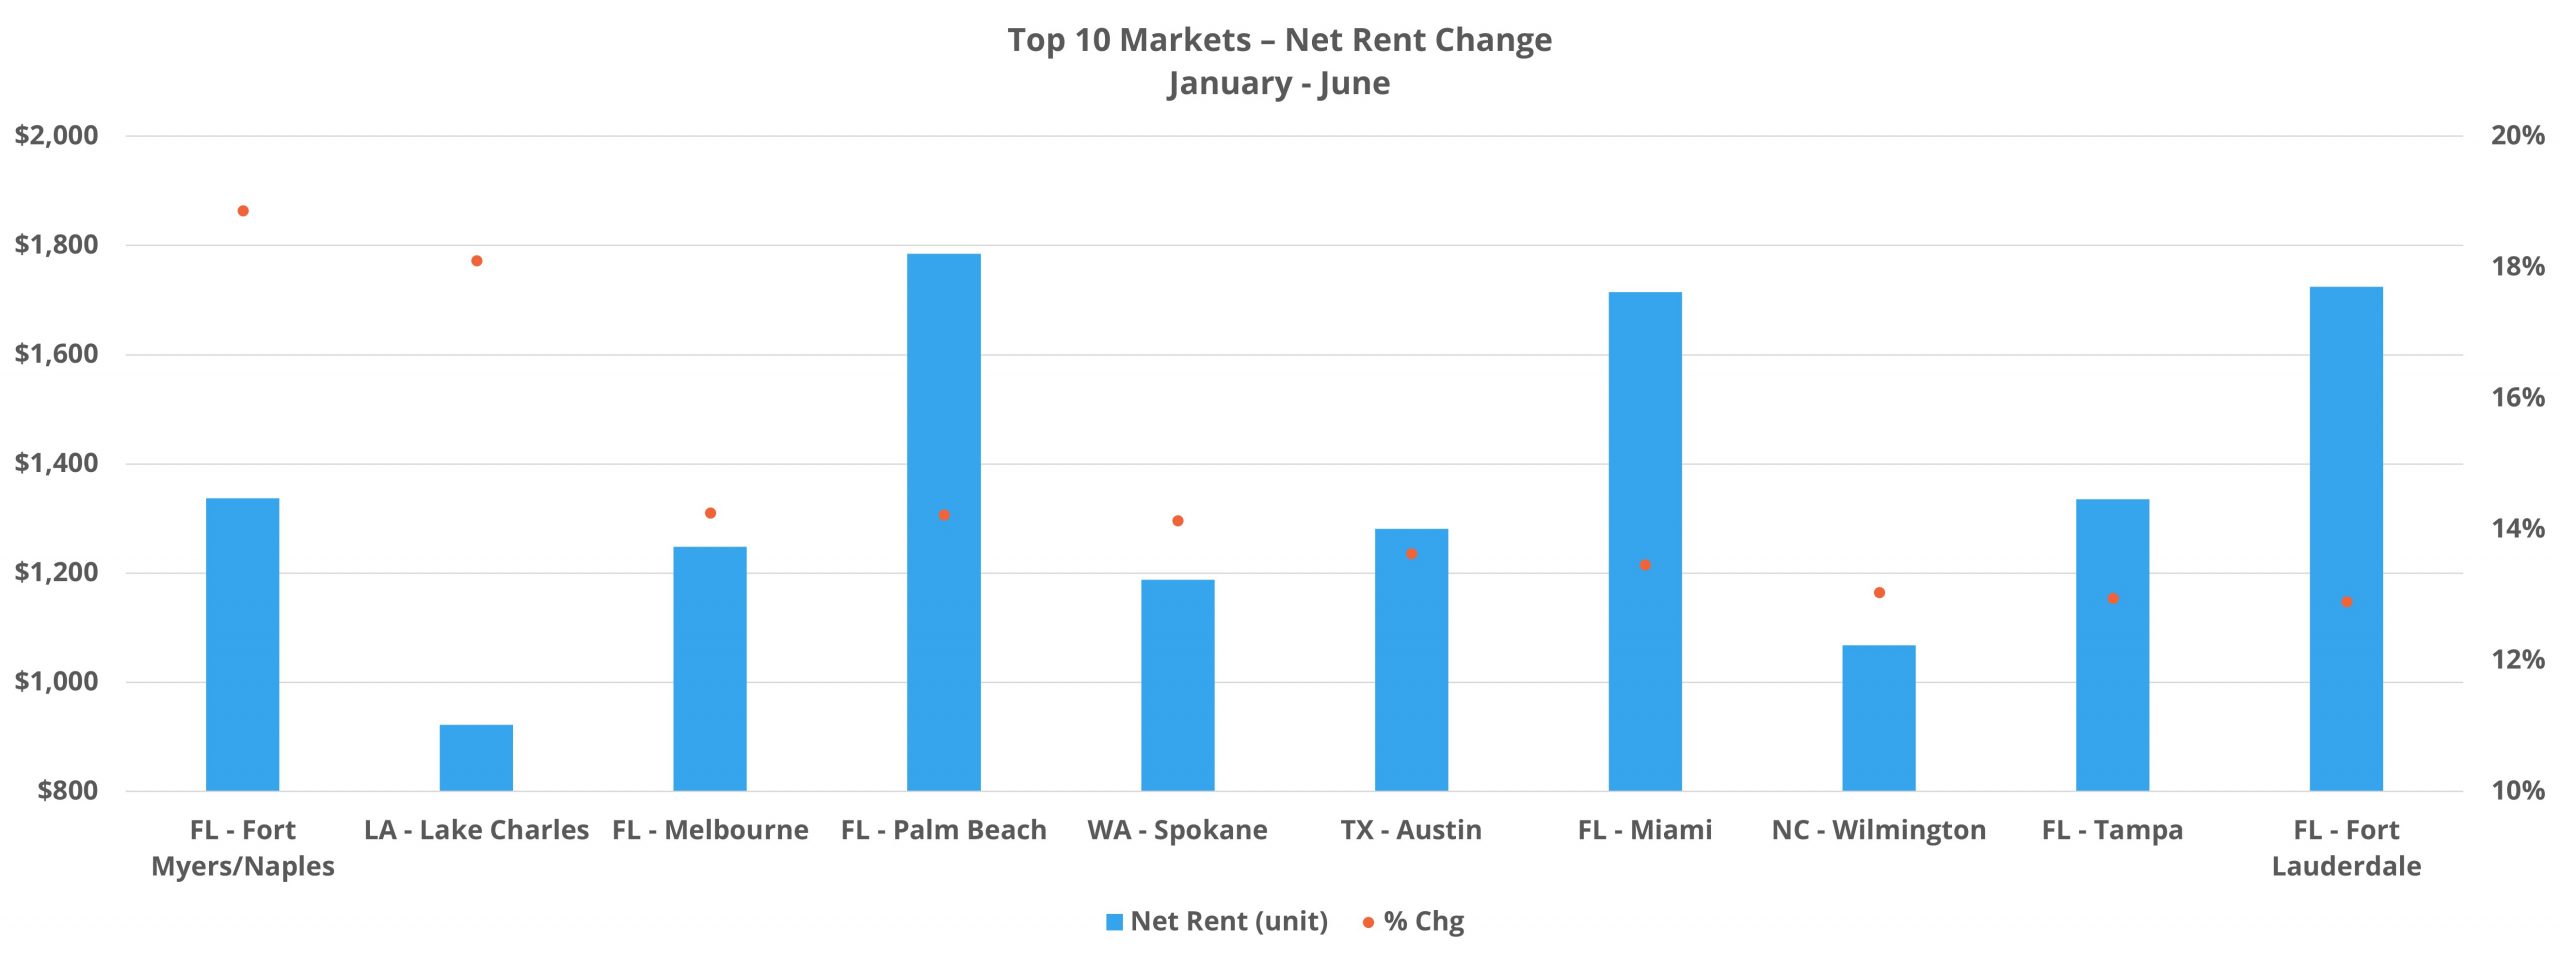
As noted in a recent blog post, Florida markets have had a particularly good year so far on the rent front. Seven of the top fifteen markets for average effective rent growth through June were Florida markets. Apart from these, other areas that have been high growth in recent years have roared back in 2021.
With a 14% effective rent gain in the period, Boise led the way. However, this increase came despite net absorption totaling less than 500 units over the six months and average occupancy actually fell by 3.5% to 91% overall. The occupancy loss and rent gain despite tepid absorption were both due to eight new properties entering the market in the period.
Austin was also a top five market for rent growth in the first half of the year with average effective rent increasing by 12%. Here, average occupancy rose by 1.5% even with an active construction pipeline thanks to net absorption of almost 10,000 units. The number of absorbed units at the midway point of this year was already close to double the annual total from 2020. Furthermore, this year’s rent gain more than made up for the 3.5% loss from last year.

With average effective rent appreciation of 11.5%, Phoenix saw the fifth largest rent gain in the period. A 50% reduction in lease concession availability was a boon for growth, as was a rebound in demand that led to net absorption of just under 8,000 units.
All three of these markets were high growth areas pre-pandemic, largely thanks to West coast migration eastward, and they have been among the leaders in the of rent growth this year.
Takeaways
The first half of 2021 has been quite a turnaround compared to last year. The new construction pipeline has continued to be active and apartment demand has been at a level not seen in a generation. Concessions have continued to decline, both in availability and average value, and rent growth through June was also at the highest level seen since ALN began collecting nationwide data.
Whereas the smaller markets generally weathered the 2020 storm better than the larger ones, it has been the larger markets leading the way this year. When considering 2021 performance through June compared to the pre-pandemic 2019, only the smallest markets have underperformed so far this year. Not all large markets have joined the party though. New York and San Francisco – Oakland were two areas that especially struggled last year, and they continue to be near the bottom of the list for net rent change this year.
In addition to many of the markets across Florida, high growth areas like Austin, Boise, and Phoenix have been among the leaders in the rent growth resurgence that has occurred this year. Net absorption was highest in Dallas – Fort Worth and Houston – making Arizona, Florida, and Texas the states that have especially stood out in the first half of the year in a positive way.
Looking ahead, the construction pipeline will continue to deliver a high volume of new units, and there is little reason to expect apartment demand to significantly decline. This should lead to the continued decline of lease concessions and propel rents higher still. The pressing question is, on what trajectory will rent growth continue to finish the year? Even with the traditionally softer fourth quarter, rent gains are likely to increase affordability pressures – particularly in the Class C space.
Search, Analyze & Compare
ALN OnLine is a web portal that allows our clients to search properties, access submarket and markets trends, new construction, and more. Since 1991, we have continued to refine our business practices and methodology in order to offer our clients the absolute best in multifamily data.

Disclaimer: All content and information within this article is for informational purposes only. ALN Apartment Data, Inc. makes no representation as to the accuracy or completeness of any information in this or any other article posted on this site or found by following any link on this site. The owner will not be held liable for any losses, injuries, or damages from the display or use of this information. All content and information in this article may be shared provided a link to the article or website is included in the shared content.

