Price Class Nationwide Performance
One way to evaluate multifamily performance is to look at the usual metrics through the lens of price class rather than just by geography. This month let’s consider the year-over-year nationwide performance of the ALN price classes—a period from April 2018 through April 2019.
ALN does not assign a typical property class to properties, because that classification is subjective, and can change market-to-market. Every professional in the industry could have a slightly different definition or perception of what a Class A or a Class C property is, depending on any number of factors. As a result, ALN assigns conventional properties with at least 50 units to a price class* depending on each property’s average effective rent per square foot percentile within its market. This allows for a clearer apples-to-apples comparison of market segments around the country.
View the full monthly Markets Stats PDF
The Nation
Before getting into a performance breakdown by price class, some overall nationwide context might be helpful. New construction deliveries slowed during the last 12 months compared to the immediately preceding year. Having said that, the introduction of more than 260,000 new units in a year while this late in the cycle is a major storyline.
Impressively, national net absorption** has continued to climb. In the last 12-months have about 290,000 units have been absorbed. In the previous year, there were just less than 275,000 newly rented units. Thanks to the volume of new units, this strong demand was only able to increase average occupancy by about 40 basis points.

Price Class A
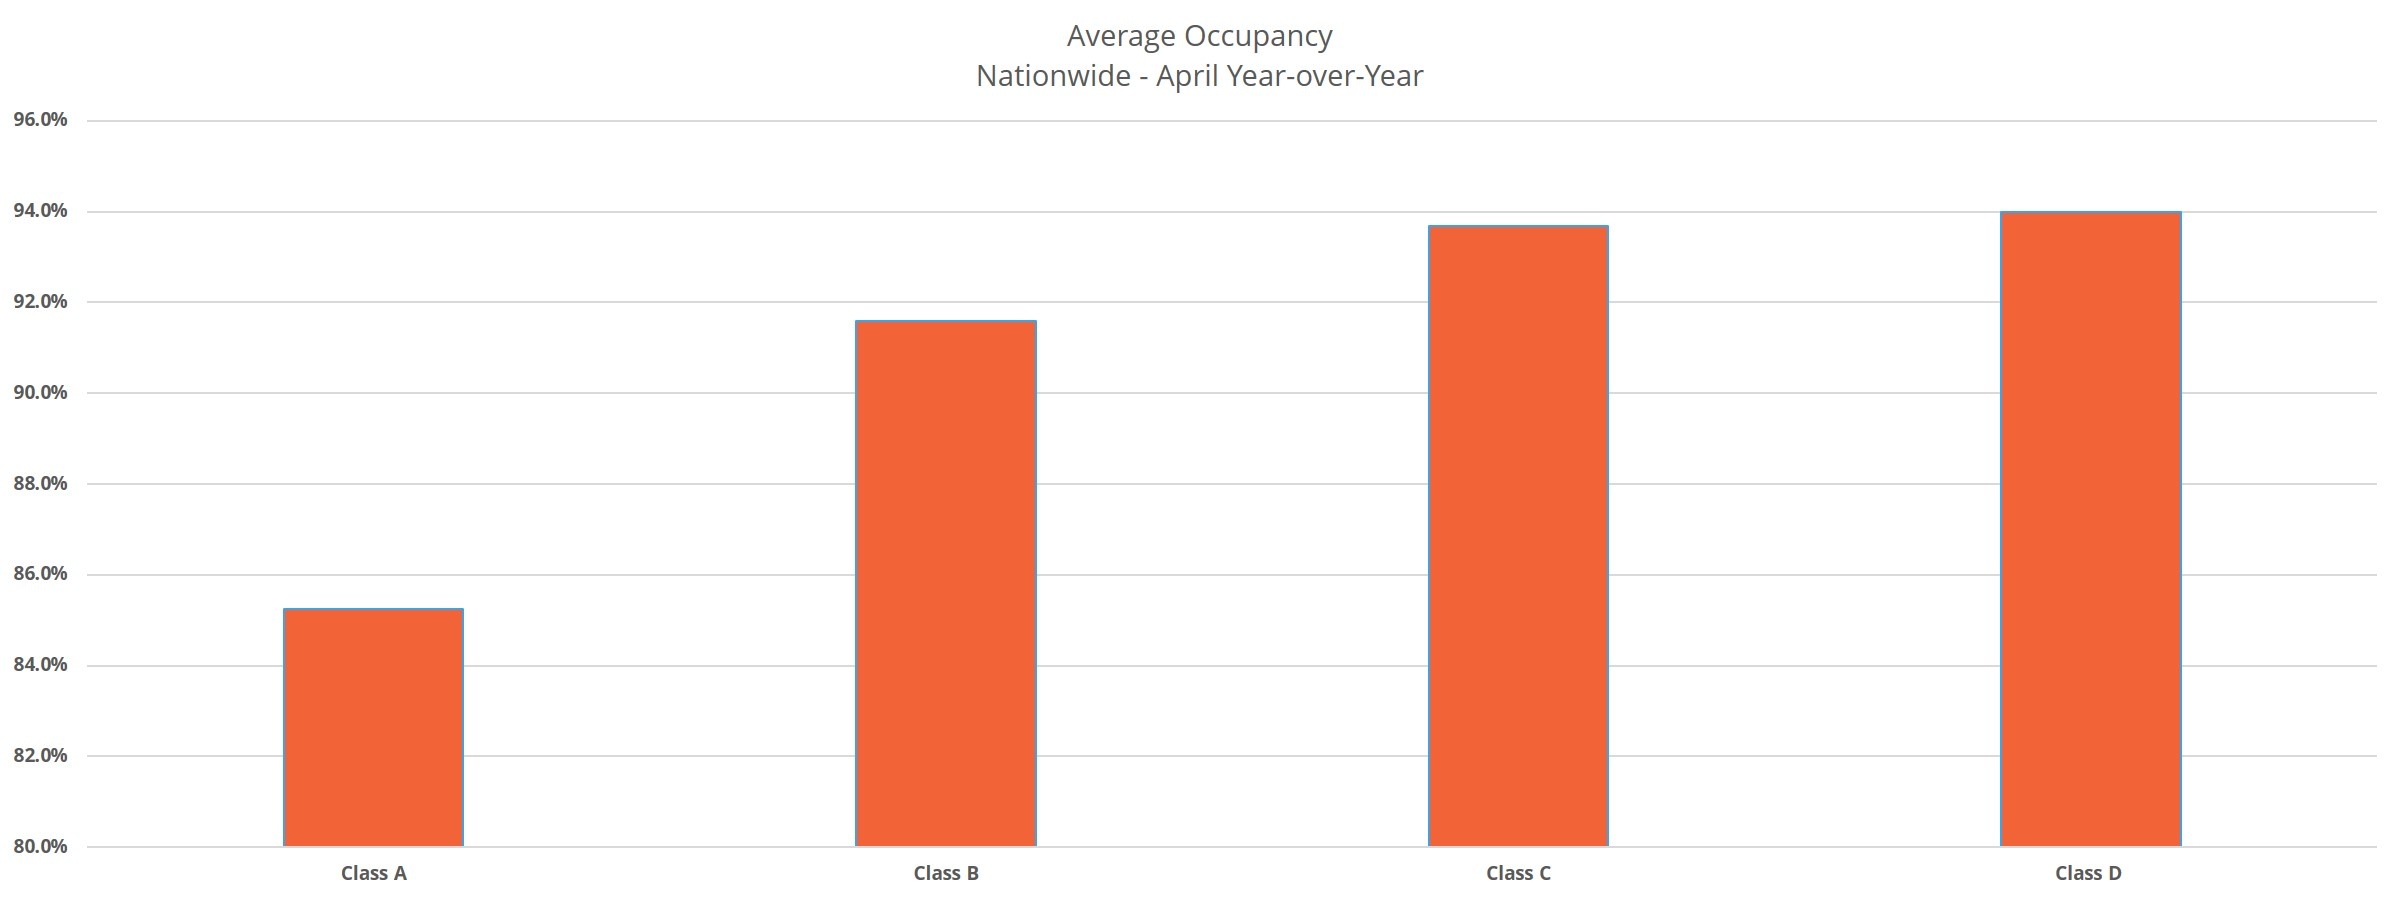
After the slight drawdown in new units over the last year, average occupancy has outperformed the previous few periods in this tier thanks to increasing demand. A 2% gain in occupancy brings the national average for Class A properties to just over 85%. This is a positive sign given that as recently as two years ago average occupancy had declined year-over-year by nearly the same amount. Annual net absorption stood at more than 135,000 units to end April of this year, a mark higher than the previous annual period by about 6,000 units.
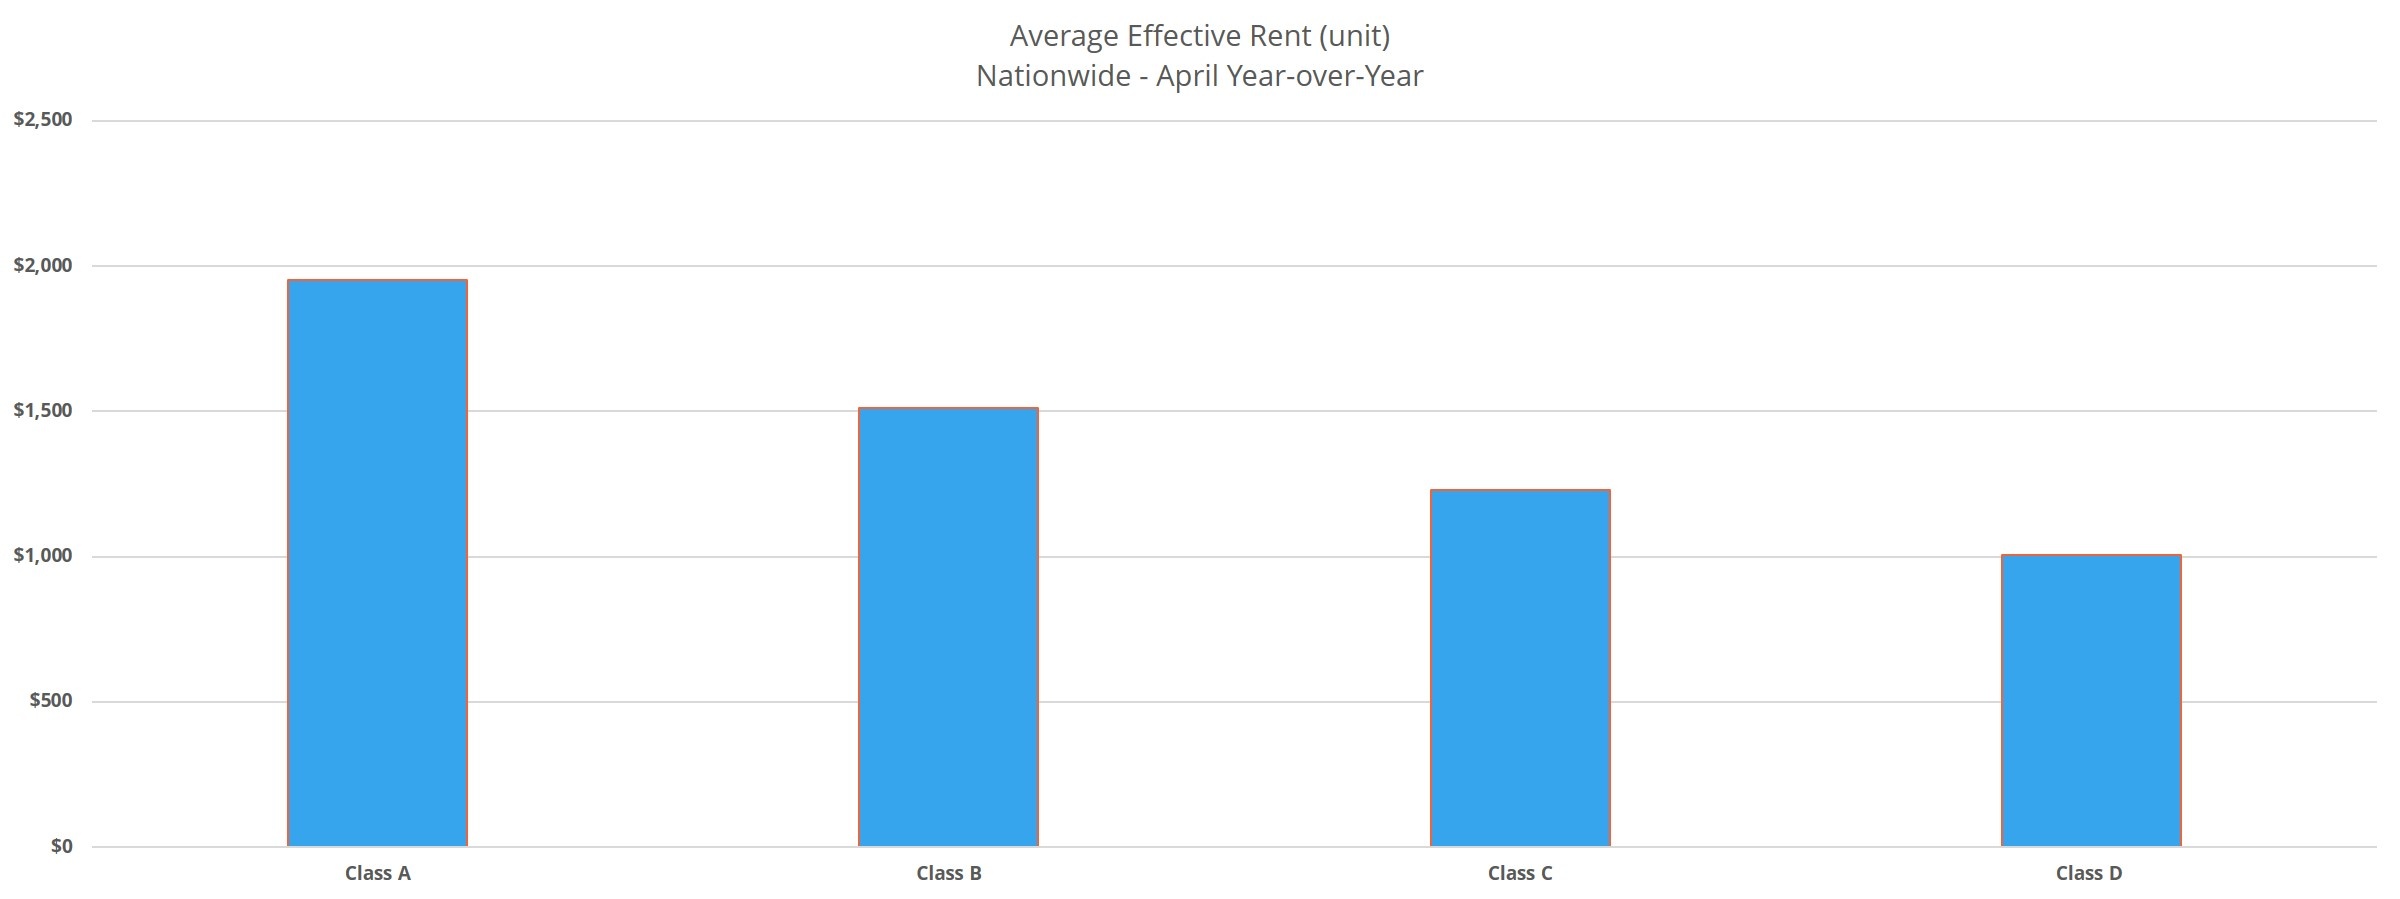
Robust demand has not been able to prolong the outsized rent gains of recent years, but that’s not to say gains have stagnated. Average effective rent growth came in just short of 5% for the last 12 months. Especially bearing in mind the amount of growth already achieved in the cycle, this is an encouraging result. Partly responsible is the slight decrease in the number of properties offering a concession in this price tier. Only about 18% of Class A properties were offering a discount as of the end of April, down from about 21% in April of 2018.
Price Class B
After two straight annual periods of average occupancy loss for Class B properties, this group managed to at least stop the losses. A gain of about 60 basis points brings the average occupancy to almost 92% for these properties. More than 81,000 units were added to this tier because of more expensive units coming in via the construction pipeline. Even with these additional units, properties were able to maintain occupancy due to more than 90,000 Class B units being newly rented in the 12-month period. This is around 5,000 more units than in the previous 12 months.
Average effective rent growth for this second tier was almost identical to that of the top group, just below 5% for the last year. This represents a significant drop-off from the nearly 8% gain from the previous period, but once again, to be approaching 5% this late in the cycle is a great result. Rent discounts also became a bit scarcer among these properties as well. Only about 14% of Class B properties were offering a rent concession as of the end of April.

Price Classes C and D
In the lower two price tiers, there hasn’t been much movement in occupancies at all in the last year. For Class C, average occupancy has gained about 30 basis points to end April at just under 94%. For Class D, there was even less movement and average occupancy remained at 94%. Regarding net absorption, Class C properties managed to rent an additional 50,000 units in the period. That is an improvement of about 1,000 units from the previous 12 months. Class D properties added a little more than 12,000 newly rented units, which is an increase from the prior period of nearly 4,000 units.
Continuing the story from the top two price classes, the bottom two tiers failed to match the rent growth of previous periods as well. While not quite as gaudy as the Class A and B properties, rent growth was respectable for these properties. Class C properties saw rents appreciate by about 3.5% and Class D properties realized a gain of 2.5%. Of note here is that for the first time, the national monthly average effective rent for a Class D property crossed the $1,000 per unit threshold in April—ending the month at $1004.
Final Takeaways
Demand remains robust and has continued its upward trajectory nationally across all four price classes. There are some specific markets that are approaching overbuild territory, but at the national level, absorption outpaced supply in a 12-month period where almost 270,000 units were added. Rent growth continues to slow but is still strong for this late in the cycle, particularly the top two price tiers.
Overall, short of unexpected major macroeconomic changes, 2019 looks to be another strong year for multifamily regardless of price class.
*Class A is the top 12% of properties, Class B is the next 20%, Class C is the next 38%, Class D is the remaining 30% of properties
**Net absorption is the net change in newly rented units
Disclaimer: All content and information within this article is for informational purposes only. ALN Apartment Data, Inc. makes no representation as to the accuracy or completeness of any information in this or any other article posted on this site or found by following any link on this site. The owner will not be held liable for any losses, injuries, or damages from the display or use of this information. All content and information in this article may be shared provided a link to the article or website is included in the shared content.

