Market Spotlight: Greater Denver
It’s June, and that means that once again, the NAA Apartmentalize Conference is right around the corner. With the host city being Denver this year, let’s take the opportunity to check-in on multifamily performance in the Greater Denver area.
For our purposes here, only conventional properties with at least 50 units will be included. Mirroring the US Census Bureau, ALN’s Denver market also includes areas such as Boulder and Colorado Springs.
View the full monthly Markets Stats PDF
Greater Denver: New Units & Net Absorption
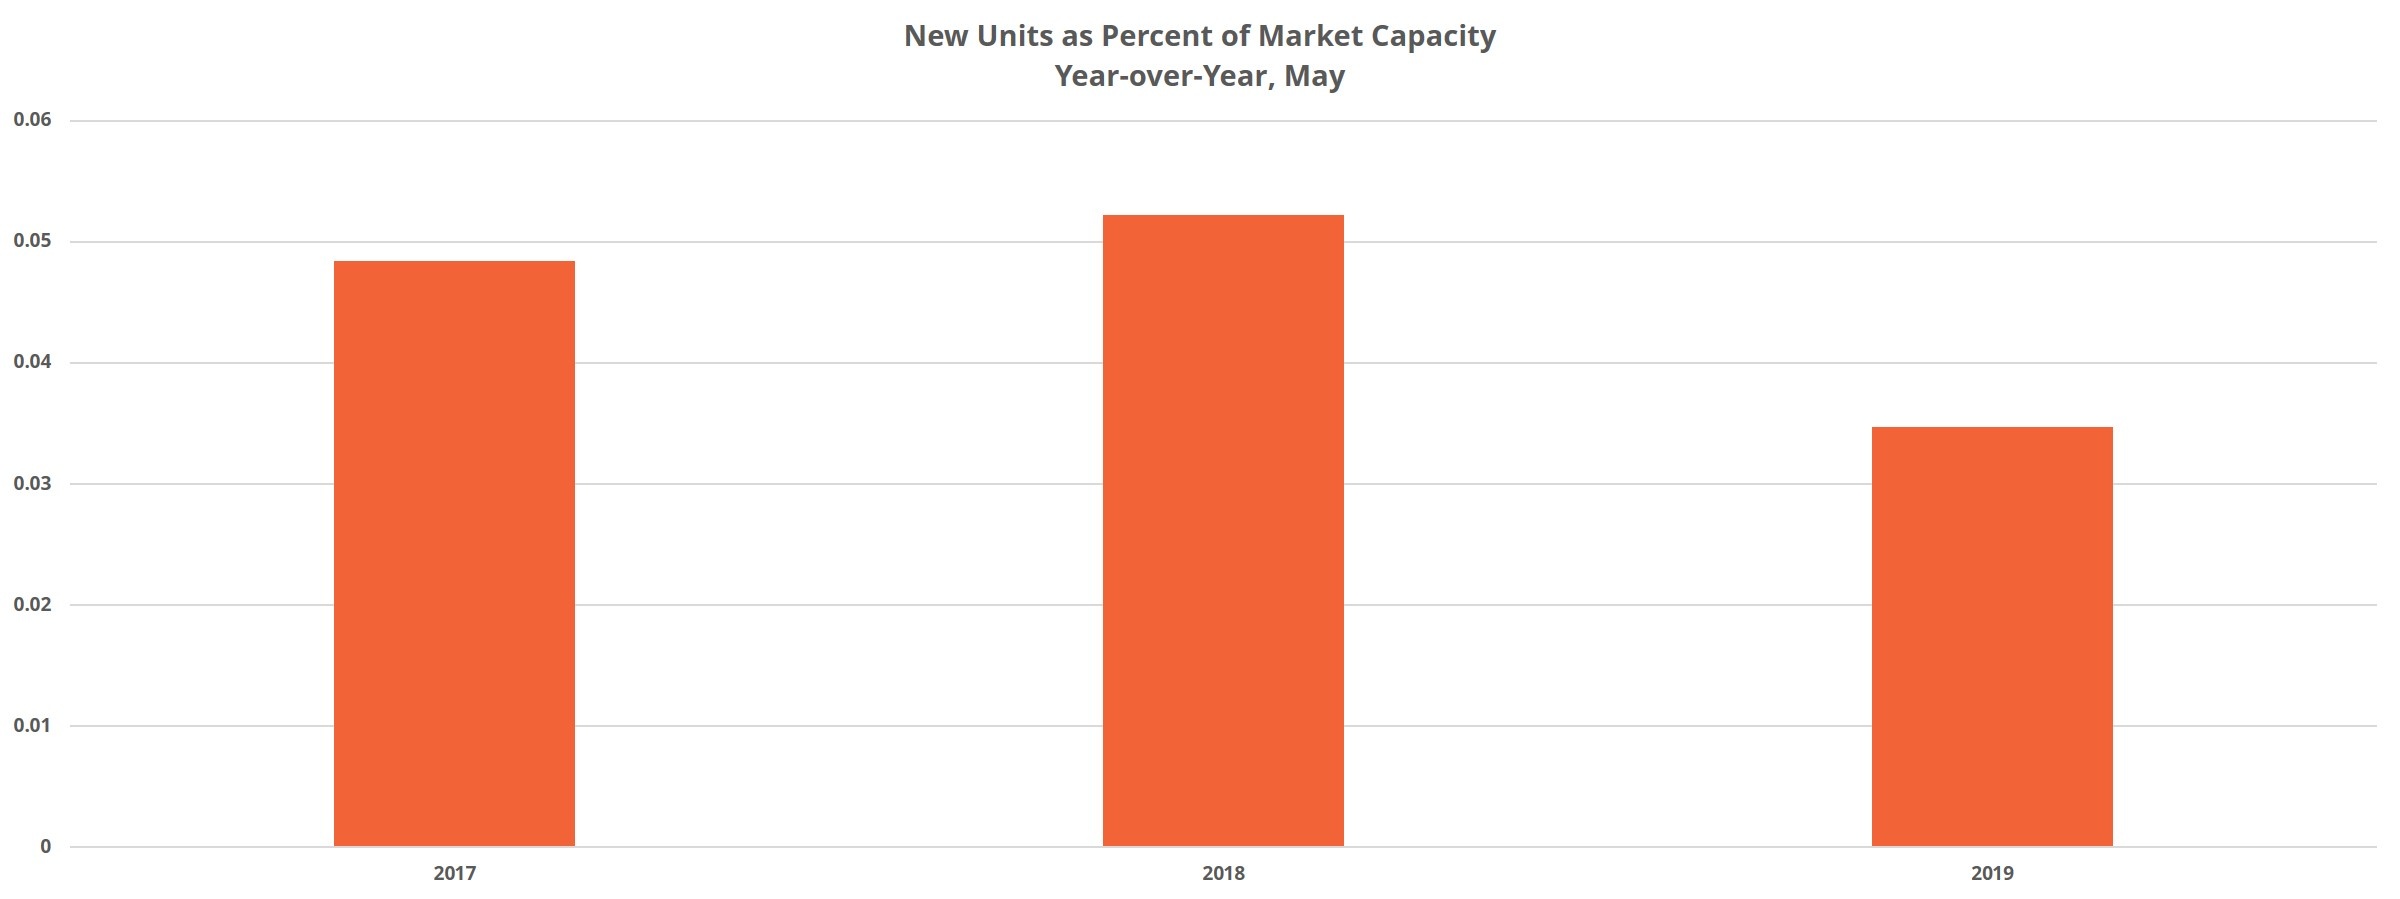
Approximately 12,000 new units have been delivered in the last 12 months in this region. That represents a slight reduction from the annual period of May 2017 to May 2018 when about 12,500 new units were added. Encouragingly, while new supply slightly decreased in the last year compared to the previous year, net absorption* increased.
Almost 11,500 units were newly rented since May 2018, while the previous annual total was just under 10,500 units. 11,500 units was not enough to offset 12,000 new units, but it’s a good sign to see that delta narrowing.
Looking ahead at the new construction pipeline, we expect roughly another 23,000 units to be delivered within the next 18 to 24 months. These are properties already under construction to varying degrees. Beyond that, there are another 18,000 units in a pre-construction phase. These units account for 35% of the overall pipeline and add some needed flexibility for decision-makers as they determine whether the market is becoming oversupplied.

Average Occupancy Change
Thanks to the uptick in demand overlapping the slight drawdown in new supply, average occupancy managed a 16-basis point improvement to end May at just under 91%. This is the first time in the last three year-over-year timeframes that average occupancy increased, albeit only slightly.
It hasn’t been all good news in this area. Both the Boulder and Greeley – Weld County submarkets lost ground to the tune of about 5% and 2.5%, respectively. Also of note is the Stapleton – Park Hill – Montbello submarket north of Aurora. Despite an average occupancy of less than 85% as of May 2018, in the time since almost 1,100 new units have been delivered. The effect has been a further decline in average occupancy to around 83%.
On the other side of the coin, the Five Points – CBD – Capitol Hill region around downtown Denver has seen a 6% occupancy improvement. Commerce City – Brighton to the northeast matched that feat as well.

Average Effective Rent Growth & Rent Concessions
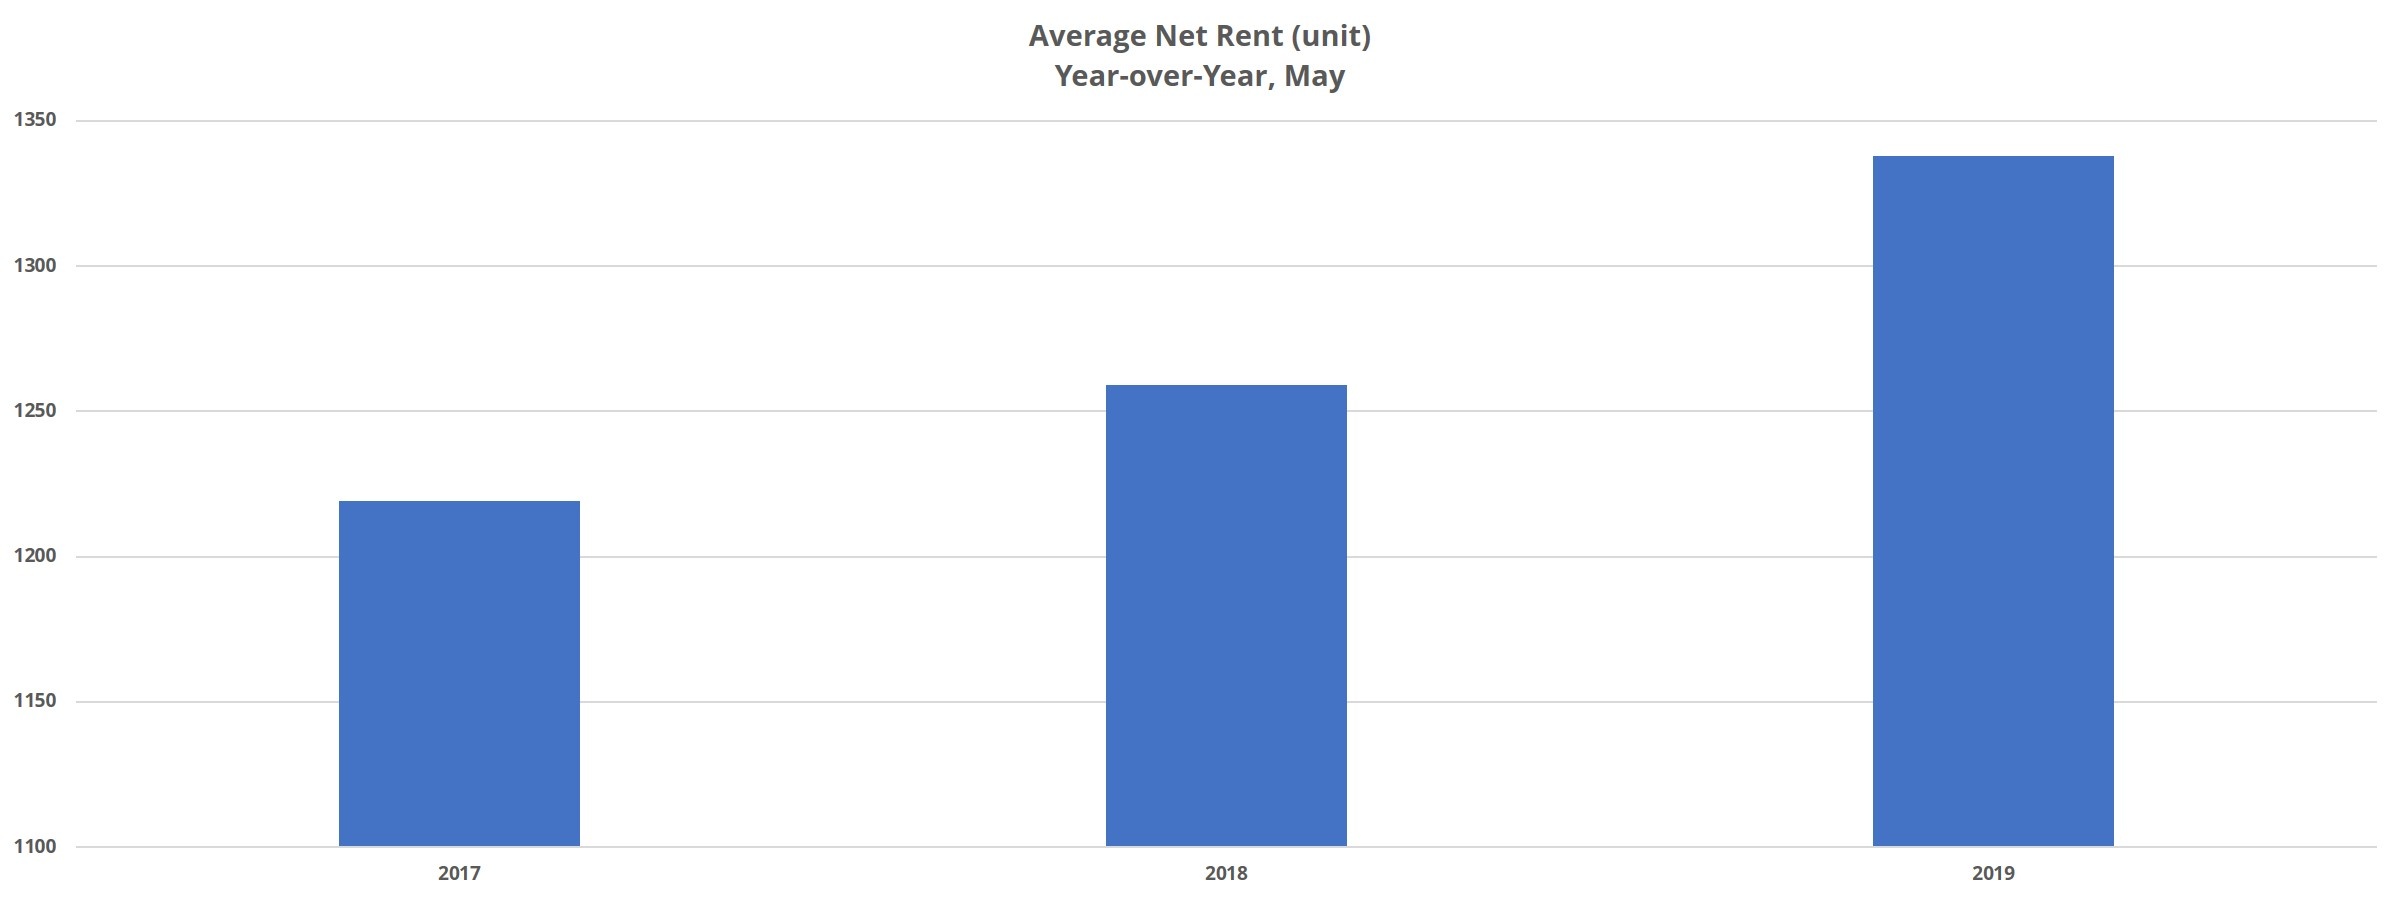
Rents continue to perform well in this market. In the past 12 months, average effective rent has gained 6% to end May at just under $1,500 per unit. This appreciation surpassed that of the previous annual period, which saw rents climb a respectable 4%. All told, in the last 36 months, average effective rent has risen by more than 16%. Especially given the long-toothed nature of the current cycle, these gains are impressive.
The availability of rent concessions has been increasing recently, but there was no major jump in the last year. Just less than 15% of properties are currently offering a discount, up from slightly below 14% to end May 2018. The major change regarding concessions came between May 2016 and May 2017 when the percentage of properties offering a discount rose from about 10% to a little over 13%. That might not sound like much of a difference either, but that amounts to a 30% year-over-year increase.
Of those properties offering a concession package, the average value of the discount hasn’t really changed over these past 12 months. The average discount now stands at just above 5%, or a little more than 2.5 weeks off a 12-month lease.

Greater Denver: Takeaways
Overall, the multifamily industry has experienced another strong year in the Greater Denver area. Despite continued high levels of new supply, average occupancy remains above 90% thanks to increasing demand. Average effective rent has been above-average nationally and has only gotten stronger compared to the last couple of year-over-year periods.
There is some question about the sustainability of these gains given the late cycle, but 2019 is shaping up to be another good year. As we look to 2020 and beyond, the storyline to watch for this market is how well it continues to absorb the new units we know are on the way.
*Net absorption refers to the net change in the number of rented units.
Disclaimer: All content and information within this article is for informational purposes only. ALN Apartment Data, Inc. makes no representation as to the accuracy or completeness of any information in this or any other article posted on this site or found by following any link on this site. The owner will not be held liable for any losses, injuries, or damages from the display or use of this information. All content and information in this article may be shared provided a link to the article or website is included in the shared content.

