Opportunity Zones and Multifamily
One important aspect of the Tax Cuts and Jobs Act of 2017 is the designated Opportunity Zones investment tool. These are areas designated by the government where tax benefits are offered to incentivize investment in low-income neighborhoods. This is sure to have an impact on multifamily in these areas in the coming years.
With that in mind, let’s have a look at a few multifamily metrics for those areas as they stand now compared to non-designated areas. Quoted numbers refer to conventional properties with more than 50 units unless otherwise specified. Included markets will be limited to the largest 52 ALN markets, referred to as Tier 1 markets, so that comparisons between markets are apt.
View the full monthly Markets Stats PDF
Current Multifamily Presence
One of the possible benefits of this program is an increased incentive for investors and developers to add supply other than premium properties in the most desirable areas. We’ve already seen some markets showing signs of softening at the top of the market due to all the new supply in the top price class.
The thinking, at least for some, was that increased supply at the top of the market would decrease competition for existing, more competitively priced properties as renters took advantage of all the new units. Instead, in many markets additional renters have been priced out of the new properties into competition for the units lower down the price scale.
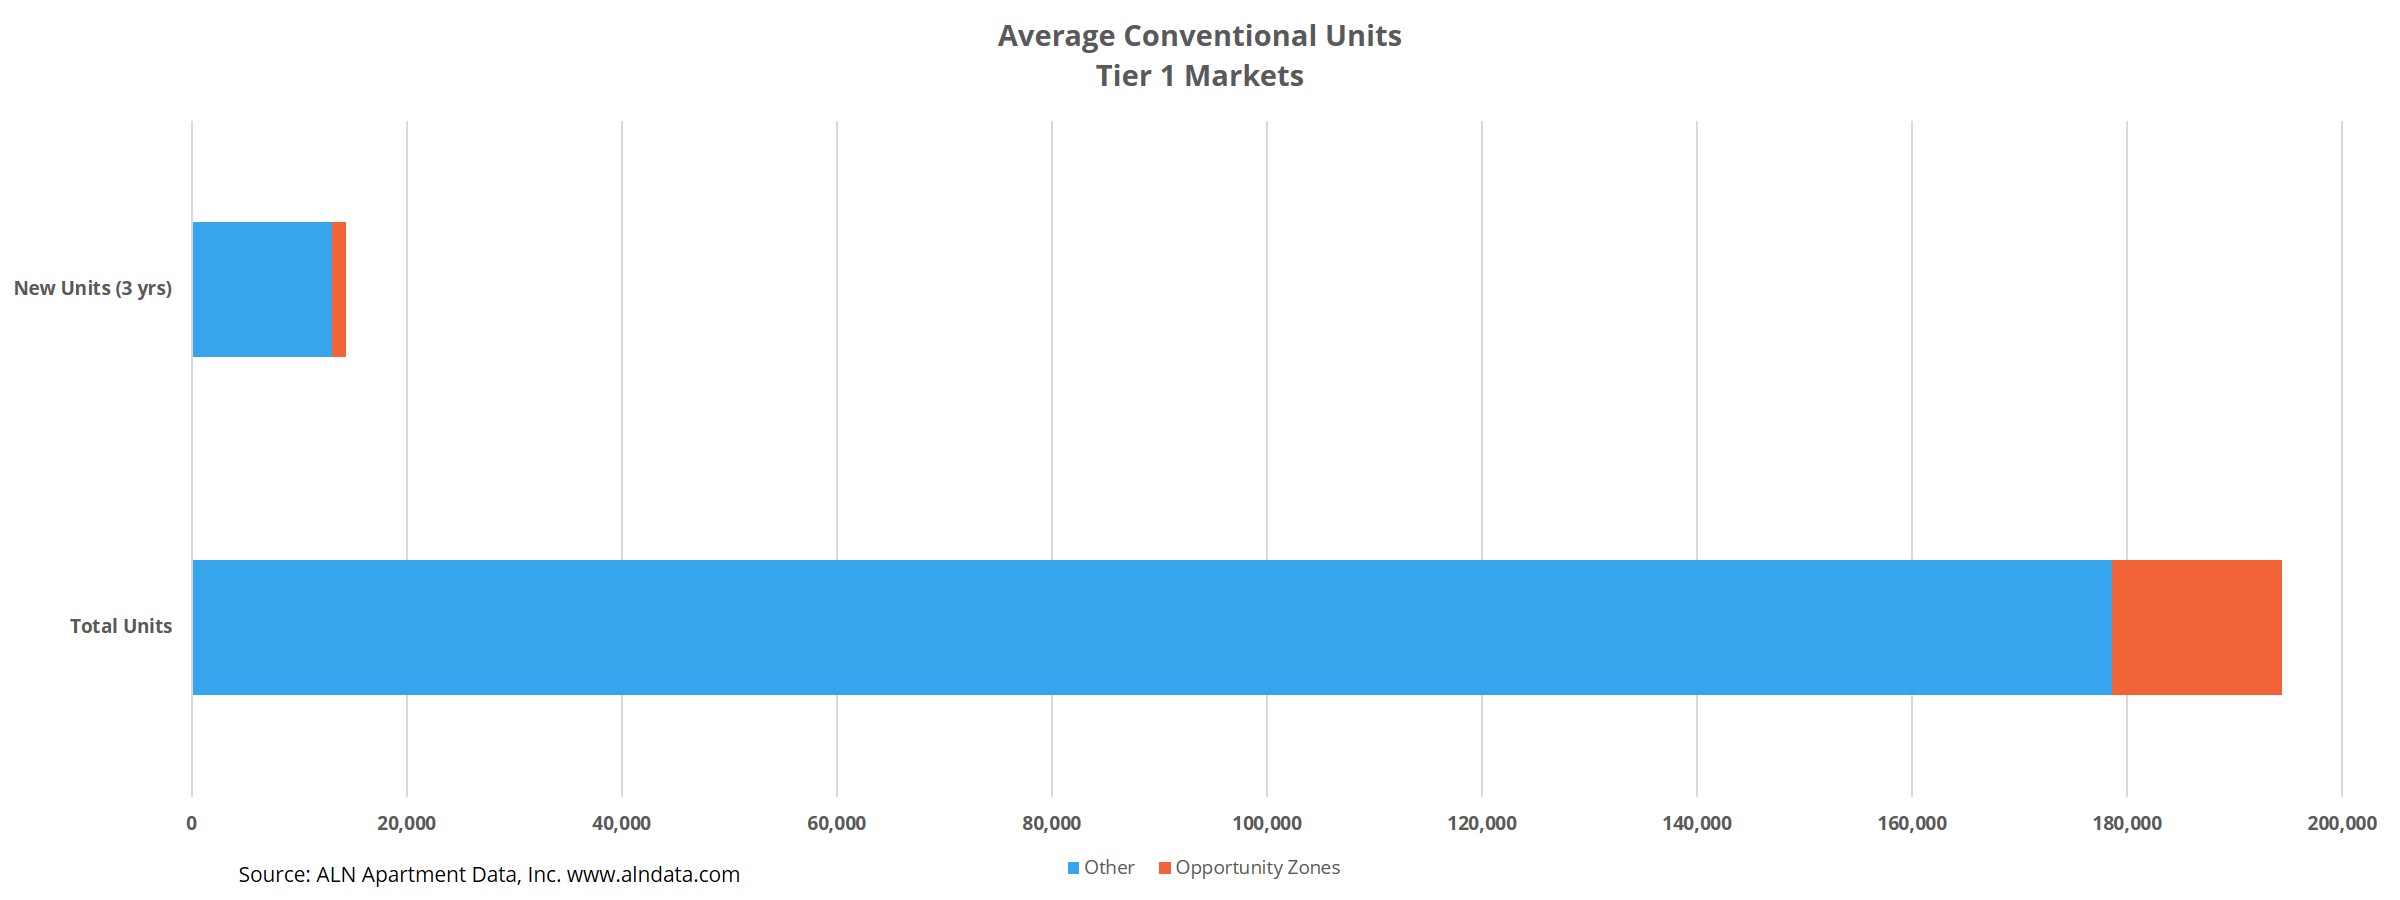
Given all that new development in the previous few years, the difference in supply between areas designated as Opportunity Zones and areas that were not, is especially stark. The average number of properties in Opportunity Zones in Tier 1 markets is 90, while the market average outside these zones is 874 properties.
Of course, because the land area of Opportunity Zones is small relative to any major market, these numbers will always be heavily skewed. However, at the averages for these markets, less than 9% of units are in Opportunity Zones.
Over the last 36 months, the average number of units added in Opportunity Zones by market is about 1,300. Over that same timeframe, the market average for areas not designated Opportunity Zones is about 13,000 units. That is fairly in-line with the ratio of existing units mentioned above. This 9-10% of units being in low-income areas forms a baseline from which we can evaluate these same markets in a few years once this program has been operational for a while.

Average Occupancy and Average Effective Rent
Average occupancy is essentially the same between properties in Opportunity Zones versus those not in low-income areas—right around 92%. This also holds true when evaluating only those properties that were already stabilized* three years ago. Average occupancy for those properties is approximately 95%, both in Opportunity Zones and outside those zones.
The portion of these existing properties that were Class A properties are likely to have been pushed out of the top price tier by the new properties introduced within the last three years. The higher occupancy amongst the older properties is another sign that renters are increasingly moving toward properties outside that top tier.
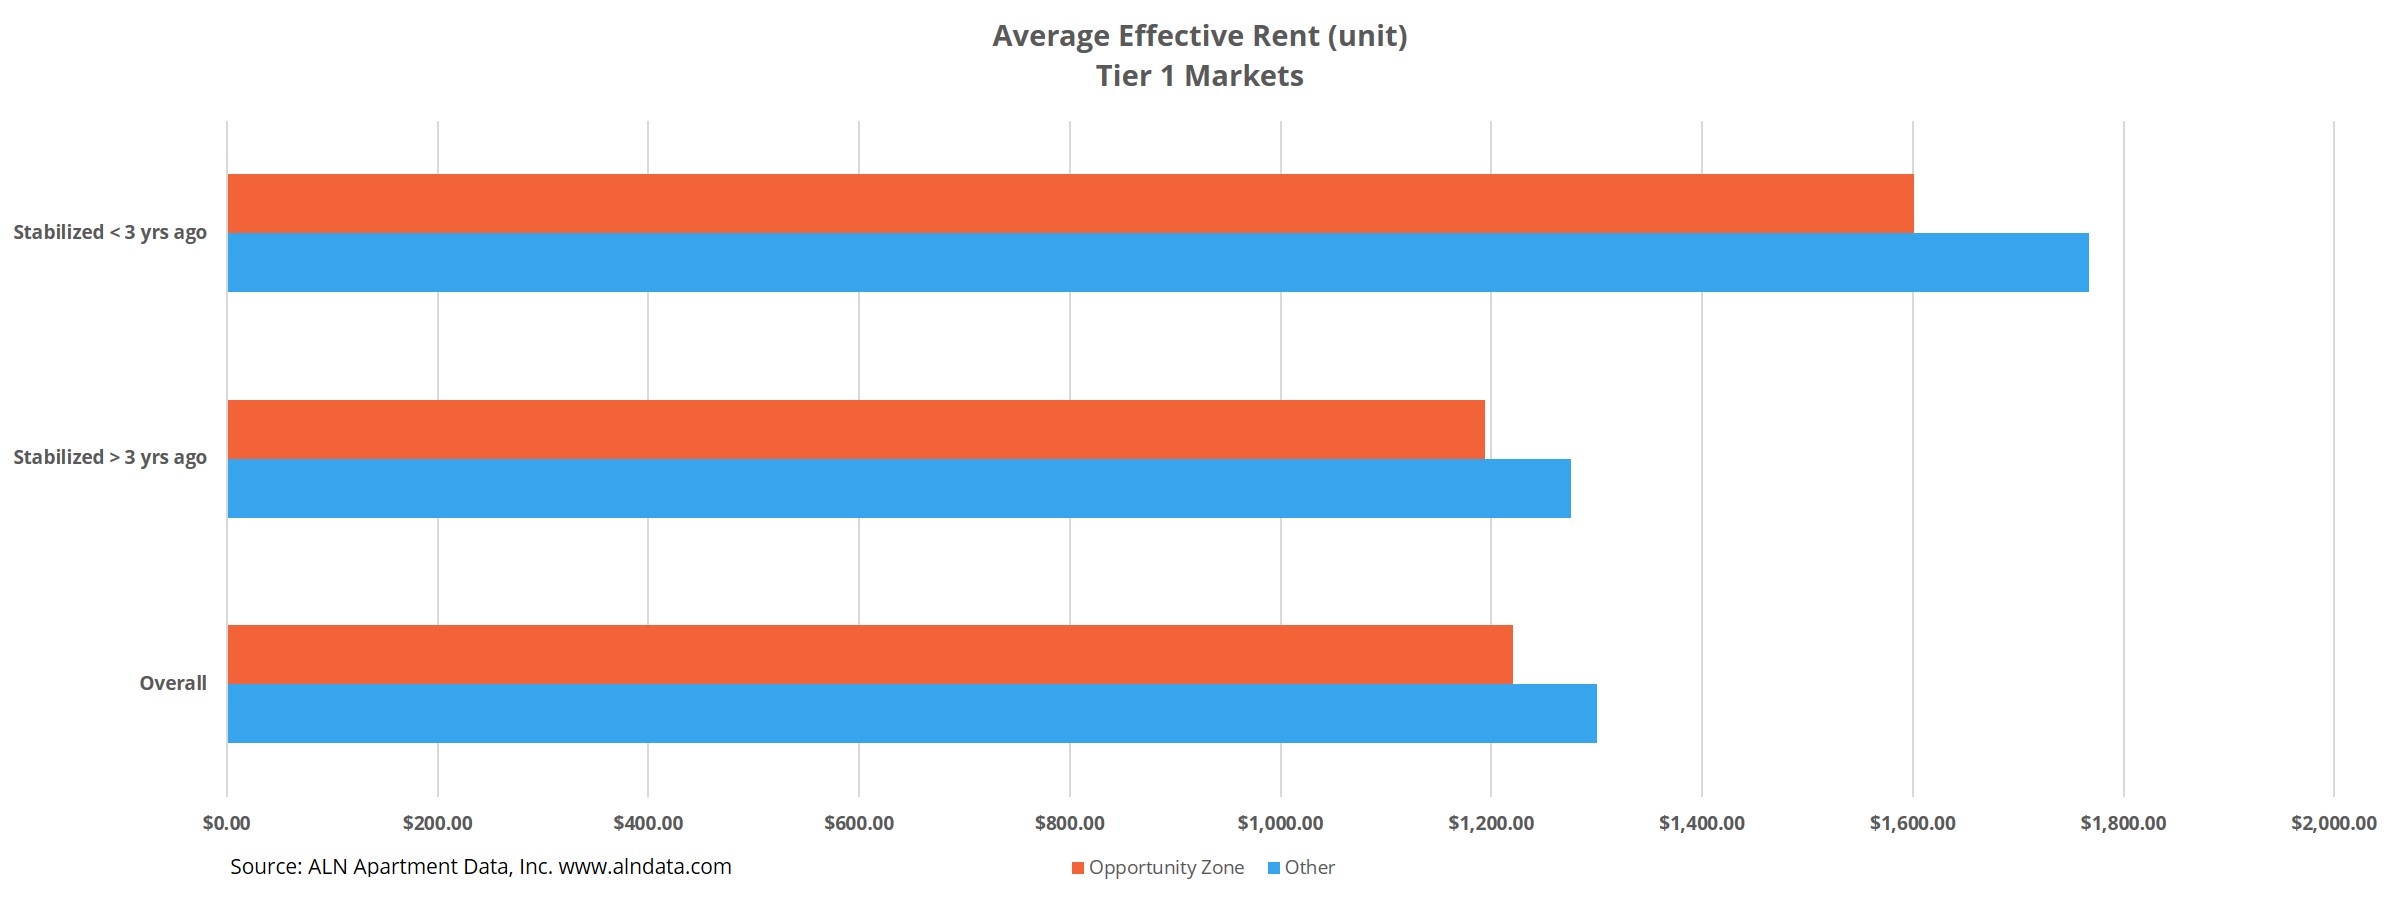
Average effective rent per unit gets a bit more interesting. The average for properties in Opportunity Zones amongst Tier 1 markets is about $1,220 per month. The average rent for properties outside those low-income areas is $1,300. When looking at only properties that were stabilized as of February 2016, the two average rents are slightly lower, but the difference is essentially the same.
It’s not until looking specifically at properties newer than that that a potential area of benefit for this program comes into focus. Within the pool of properties built or stabilized in the last 36 months, the difference in average monthly rent between properties in Opportunity Zones and those that aren’t is just over $160. That delta is double that of properties that were already stabilized as of three years ago.
Additionally, average effective rent per unit for these properties is now around $1,770 for non-low-income areas and $1,600 for low-income areas. Once again, a reflection of new development occurring primarily at the top of the market with respect to price.

Subsidized Housing
Certain markets stick out when looking at the location of subsidized housing properties between Opportunity Zones and areas not in Opportunity Zones. In the Pittsburgh market, for example, 41% of units in properties in low-income areas are subsidized, whereas 19% of units in properties outside these areas are subsidized. In Orlando, 37% of properties in designated low-income areas are subsidized housing, while 11% of properties in the rest of the market are.
Other markets have a dearth of subsidized housing regardless of location. In Austin, for example, only 4% of properties in low-income areas fit that description and 1% of properties outside the Opportunity Zones. Similarly, the Raleigh – Durham metro area includes 8% of properties in low-income areas that are subsidized, and only 3% of properties throughout the rest of the market.
Takeaways for Opportunity Zones
The Opportunity Zone investment tool passed as a part of the Tax Cuts and Jobs Act of 2017 provides investment incentive in areas that stand to benefit greatly from increased economic activity. It’s clear that much of the focus in development has been focused in areas with existing high levels of economic activity, and at the top of the market for rents. Over the last three years, 9-10% of new units have been delivered in Opportunity Zone census tracts, providing a basis for comparison in the future.
The new supply that has come into these designated low-income areas has likely not been with immediate residents in mind as prospective renters. This can be seen in the jump in average rent per unit in Opportunity Zones from about $1,200 per unit in properties that were already stabilized as of three years ago to $1,600 per unit for properties brought online since. This is especially telling because it’s not only the expensive coastal markets that are responsible for the new units that account for this jump.
It does make sense that much of the subsidized housing would be located in designated low-income housing due to transportation obstacles and the like. But markets such as Pittsburgh and Orlando have unusually high concentrations of subsidized housing in Opportunity Zones, certainly beyond a preferable threshold. Other markets continue to add conventional units at near-historic pace while providing almost no subsidized housing options.
This program could have a significant impact on multifamily. Not just because of the changes in development it could affect, but also because of an overall increase in economic activity in areas where little existed before. The ripple effect of such changes could be a tide that lifts all multifamily boats.
*ALN considers a property stabilized once it reaches 85% occupancy, or once it has been leasing for 9-months, whichever comes first.
Disclaimer: All content and information within this article is for informational purposes only. ALN Apartment Data, Inc. makes no representation as to the accuracy or completeness of any information in this or any other article posted on this site or found by following any link on this site. The owner will not be held liable for any losses, injuries, or damages from the display or use of this information. All content and information in this article may be shared provided a link to the article or website is included in the shared content.

