Notable Recent Population Change: Smaller Markets
In a blog post last week markets with notable population change from 2017 through 2019 according to the US Census Bureau were mentioned. As a follow-up to that, in this post smaller markets that have stood out regarding population change over that same period of time will be the focus. This time, rather than total population change, population percent change will be used. Because each ALN market contains only complete metropolitan statistical areas (MSAs), MSAs will be combined where appropriate to represent whole ALN markets.
Top Gainers by Total Population
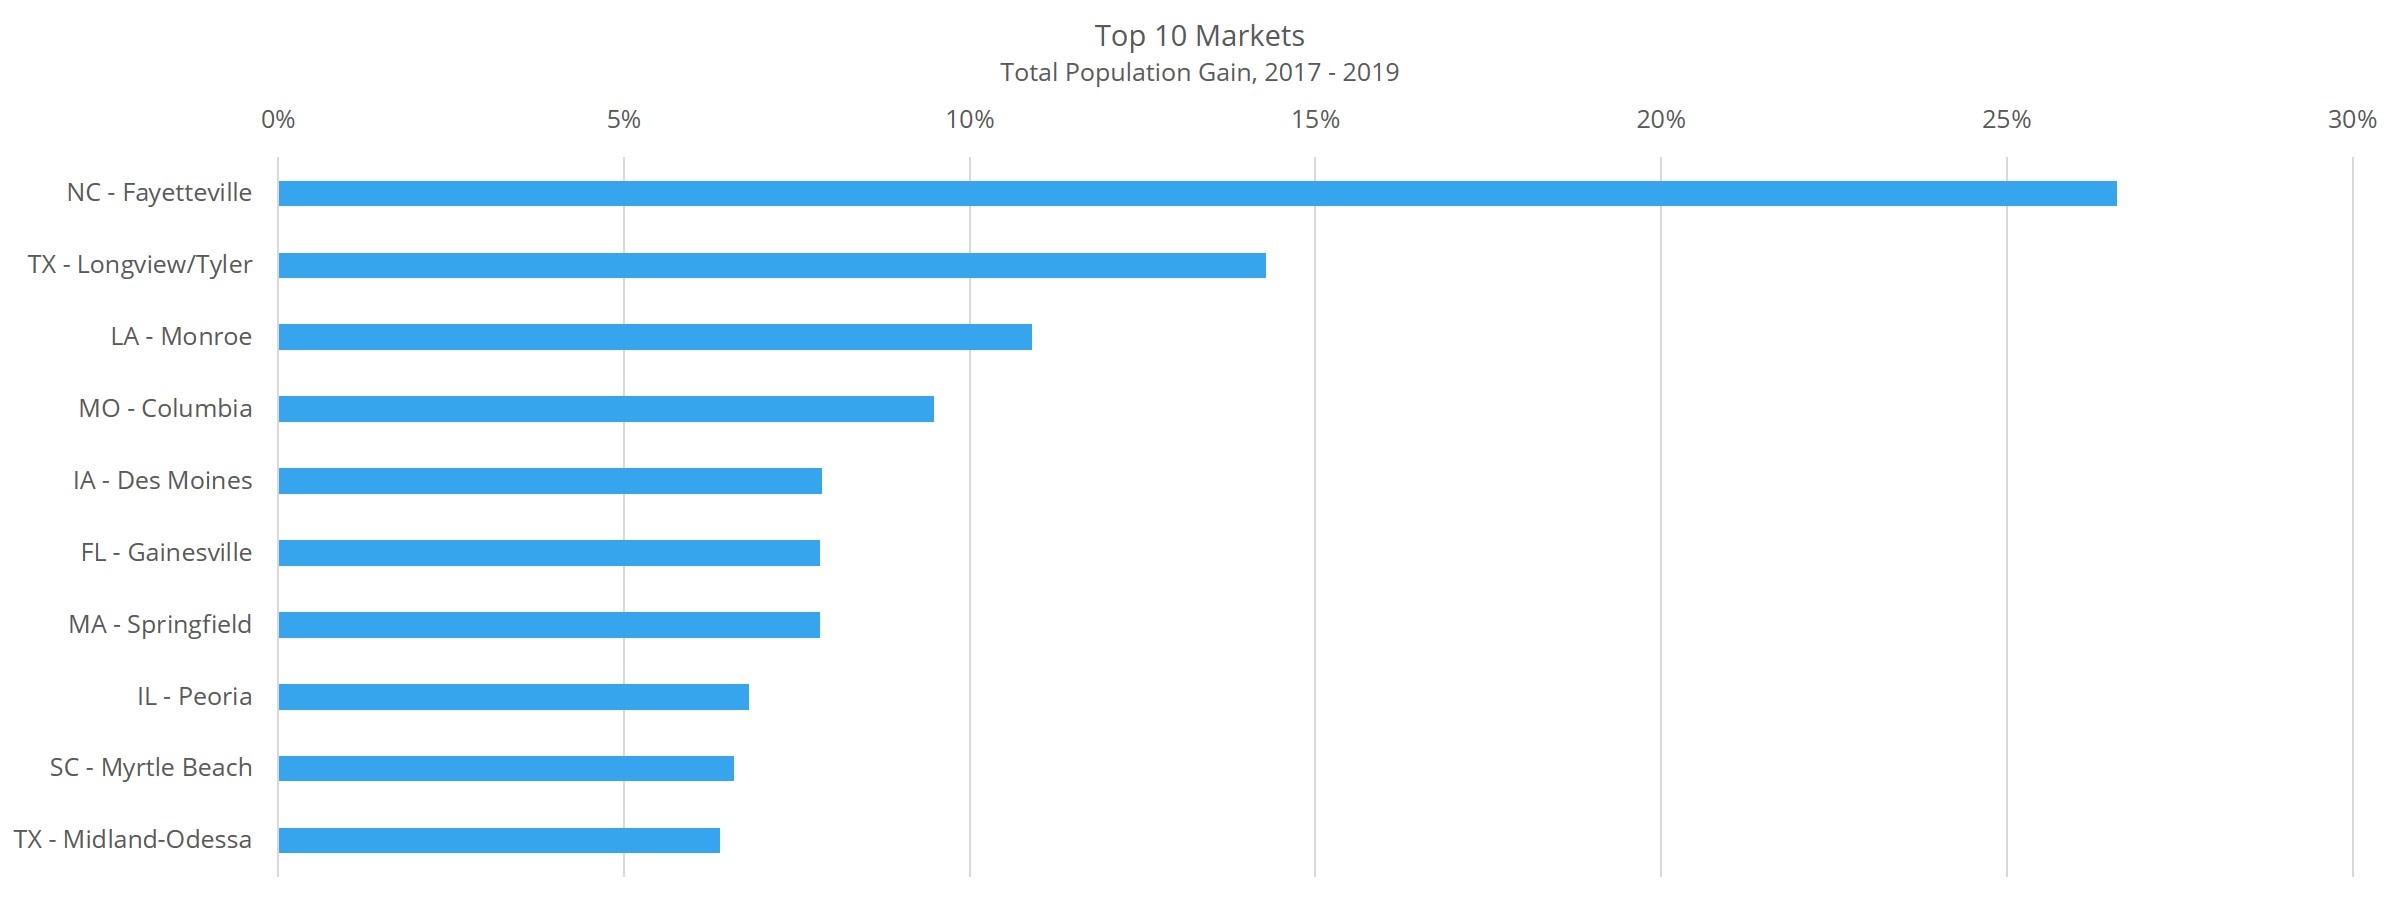
No market had a higher total population percent change increase from 2017 through 2019 than Fayetteville, NC. About 140,000 new residents represented a nearly 27% increase in population. Better still, though there was growth in all age cohorts, the strongest gains were among those below the age of 19 as well as in the 30 to 34 age group.
Almost 75,000 new residents were enough to push the Longview – Tyler, TX population up by 14% during the three years to more than 500,000. Once again, much of the growth was in younger age groups – both youth and young adult. Both are encouraging growth areas for potential new household formation as well as being productive cohorts in terms of economic activity. In particular, the cohorts for children with ages between five and 14 grew substantially. So too did the 20 to 24 and 30 to 34 age groups.

Third was Monroe, LA with a population gain of just over 10% in the three years thanks to about 22,000 new residents. Growth was fairly evenly distributed across the board, but two age groups saw especially pronounced increases. The first was the 35% gain for those between 40 and 44 and the second was the 62% increase in residents between 70 and 74.
Top Losers by Total Population
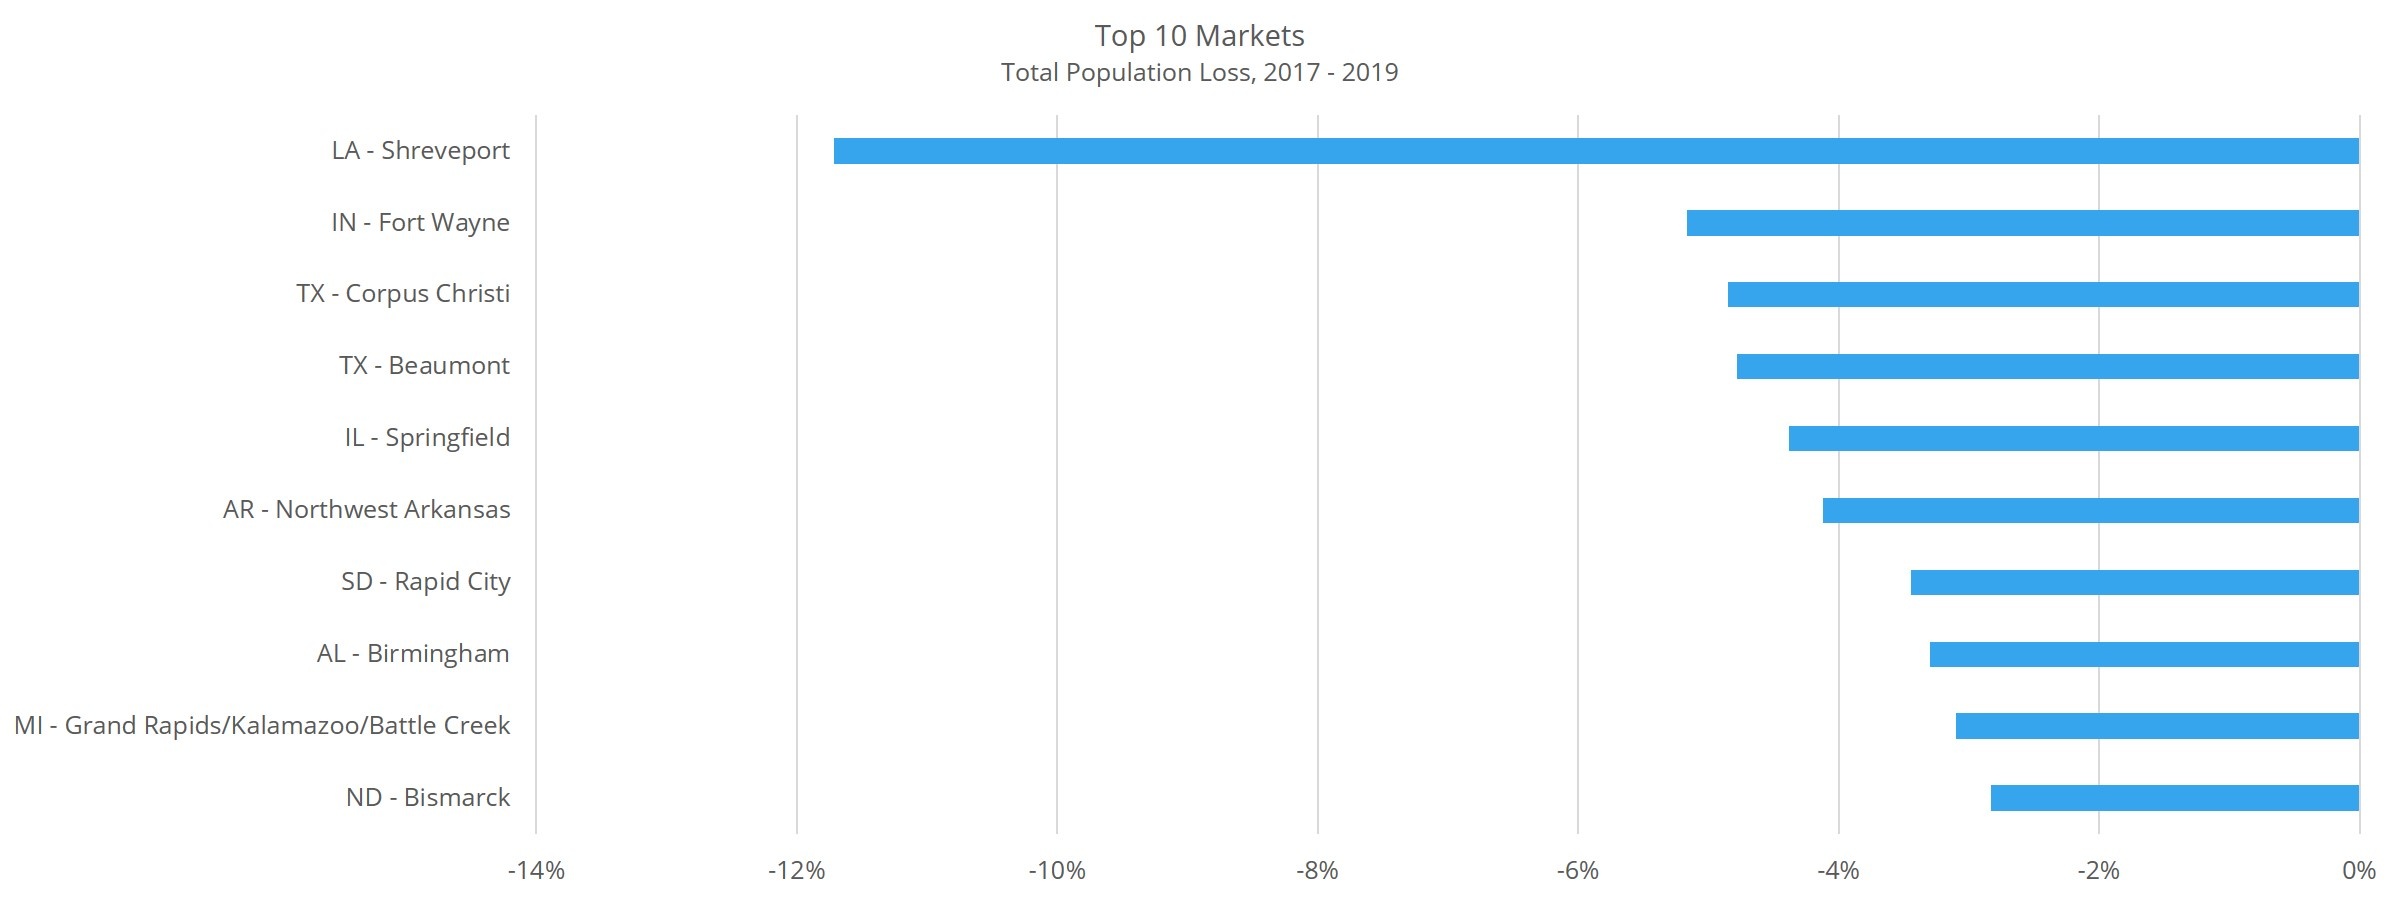
Shreveport, LA lost more than double the population of the second-worst market on a percentage basis with a 12% decline after suffering the loss of nearly 50,000 people between 2017 and 2019. There were losses almost across the board, with the exceptions being small increases in some retirement-aged cohorts. Making matters worse, the most dramatic losses were seen for those in their 30’s, children under five and for residents between 50 and 54.
The market to lose the second-most in total population on a percentage basis was Fort Wayne, IN. A little more than 20,000 in population lost represented a 5% loss. Despite gains across the board for age cohorts above the age of 70, the net loss came about due to consistent decreases among the younger groups. Roughly one-third of the net population loss was comprised of residents in their 40’s, and predictably, decreases came in every age group for children.

Corpus Christi, TX also experienced a decrease in total population of about 5%, this time slightly less than 5%, after a decline of approximately 21,000 residents. A significant chunk of the decline came from those above the age of 60, but there was also a noticeable decrease for those between 45 and 54.
Takeaways
Unlike with the larger markets, both ends of the scale for the smaller markets were fairly scattershot in terms of states being represented. Three states had at least two markets in the top 10 for population growth for the larger markets. Here, only Texas had two markets inside the top 10. Interestingly, Texas was also the only state to have two markets inside the 10 markets with the largest population declines.
Smaller markets are more susceptible to large swings in population change on a percentage basis due simply to their smaller size but also to their tendency toward less industry diversity in their employment base. A large share of jobs depending on the energy or manufacturing sector is great when the sector is doing well, and not so much when it isn’t.
Throughout 2020 the large, dense, and expensive markets generally had a harder time of it, with some notable exceptions like Midland – Odessa, TX and others. As secondary and tertiary cities continue to receive increased attention from residents and industry participants alike, population shifts among and within these smaller markets will be well worth following.
Disclaimer: All content and information within this article is for informational purposes only. ALN Apartment Data makes no representation as to the accuracy or completeness of any information in this or any other article posted on this site or found by following any link on this site. The owner will not be held liable for any losses, injuries, or damages from the display or use of this information. All content and information in this article may be shared provided a link to the article or website is included in the shared content.
