

National Look at Multifamily Price Classes
When attempting to quantify the market performance of the multifamily industry over a set period, a regional look is informative. Another way of analyzing performance though, is by price class. This type of breakdown is an effective way to take the temperature of the industry and can give clues as to where we’re headed.
View the full monthly Markets Stats PDF
ALN does not assign a typical property class to properties, because that classification is subjective, and can change market-to-market. Every professional in the industry could have a slightly different definition or perception of what a Class A or a Class C property is, depending on any number of factors. As a result, ALN assigns conventional properties to a price class depending on each property’s average effective rent per square foot percentile within its market. This allows for a clearer apples-to-apples comparison of market segments around the country.
The Nation
Nationwide, all of the multifamily price classes experienced solid absorption in the last year. For the most part, top tier price classes had a particularly good year for absorption, especially in larger metro areas. Rent increases, however, were not quite as heady as in prior years. The top two price classes were well off pace in rent growth over the last 12 months.
Price Class A
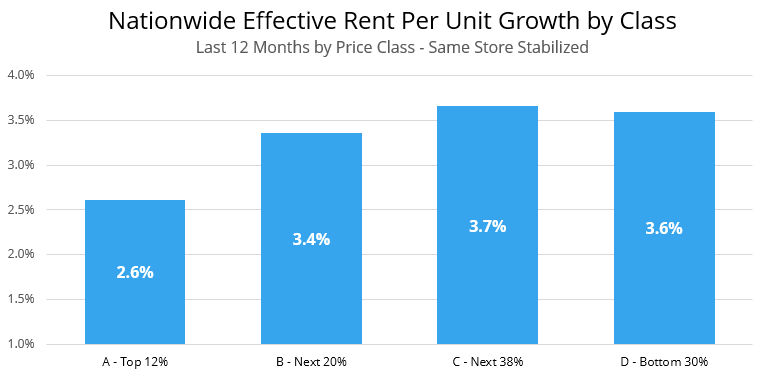
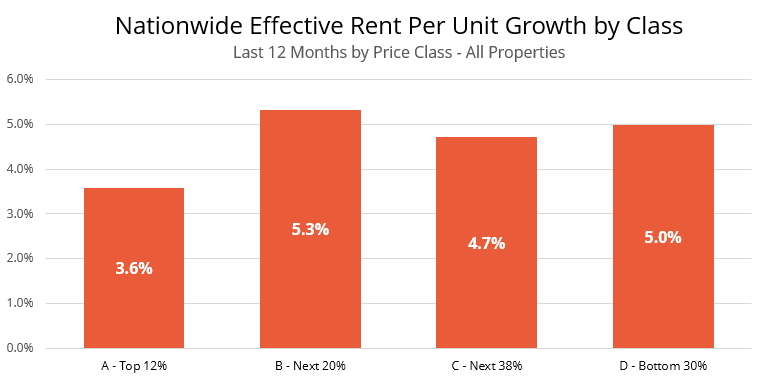
Price Class A’s absorbed more than 130,000 net units resulting in an average occupancy gain of almost 7% for the year. Currently, Class A properties have an average occupancy of 87.2%, the highest value in several years. Even with the introduction of more than 70,000 units, rents for the top tier increased only 3.6% over the last year. Much of this rent growth can be attributed to new supply, since rent growth in properties stabilized before a year ago was only 2.6% over the last year.
Some of the best gains in occupancy were in the major markets in Georgia, Tennessee, Colorado, New York and Pennsylvania. Each of those states experienced more than 10% growth in occupancy in their Class A properties. Markets in Oklahoma and Wisconsin couldn’t keep up with the introduction of new units, causing a drop in average occupancy. Mississippi markets actually had negative absorption over the last year for their premier properties.
The DC area, Nevada and Arizona experienced the strongest rent growth in Class A’s with gains of more than 6.5%. However, in the last few years 6.5% would have placed them in the middle of the pack nationally. We are also starting to see negative rent growth in several markets for the premium assets. The Pacific Northwest, Oklahoma and Kansas all experienced negative rent growth at the top end of the market.
Price Class B
The influx of Class A tiered properties pushed more units into the secondary price category over the last 12 months. Fortunately, those properties maintained their occupancy levels and overall national occupancy for Class B tier properties rose slightly, 0.6%, to an average of 91.2%. Effective rents rose 5.3% nationally for the Class B level properties. While that is a respectable amount in any given year, it is well off the pace of 2015 and 2016.
At 6.6% rent growth, the desert markets of Nevada and Arizona also performed just as well over the past year in this product class as they did for the Class A priced properties. Florida markets also outperformed the national average in this product class. Salt Lake City kept pace with these markets as well.
At the other end of the spectrum, the poor price performance of the top tiers also worked its way down in the Oregon, Wisconsin and Oklahoma markets. However, the Oklahoma markets did manage to eke out a little rent growth in the Class B tier properties.
Price Class C
The lower tier properties nationally didn’t experience the same softness in rent growth in most markets. The competition, for now, seems focused on the newer and higher end properties. Nationally, Class C and D’s had rent growth around 5%, and occupancies are holding steady in the 93-94% range.
In the big picture, the last 12 months have shown that while absorption continues to remain relatively healthy, some markets are experiencing increasing competition for new renters at the top end of the market. In these markets this sector is in danger of oversupply. If we start to see more price softening at the lower end of the spectrum, then we may have crossed an inflection point toward a new business cycle in multifamily in those markets.
Interested in learning more about Price Tiers in your area? With a subscription to ALN OnLine, you can review Quoted Rent and Occupancy by Price Tier even down to the Submarket level. Click the picture to the left for a sample of our Submarket Trend Report! Ready to subscribe to ALN OnLine? Get in touch today to discuss pricing and options.