Multifamily Mid-Year Review: A Look by Market Size
Earlier in July we considered multifamily performance through the first two quarters of 2020 from the perspective of region. Now, using conventional properties of at least 50 units, let’s see how markets of different sizes performed.
ALN divides markets into four tiers based on the number of multifamily units in each market.
Tier 1: 150,000+ units
Tier 2: 75,000 – 149,999 units
Tier 3: 25,000 – 74,999 units
Tier 4: less than 25,000 units
Average Occupancy
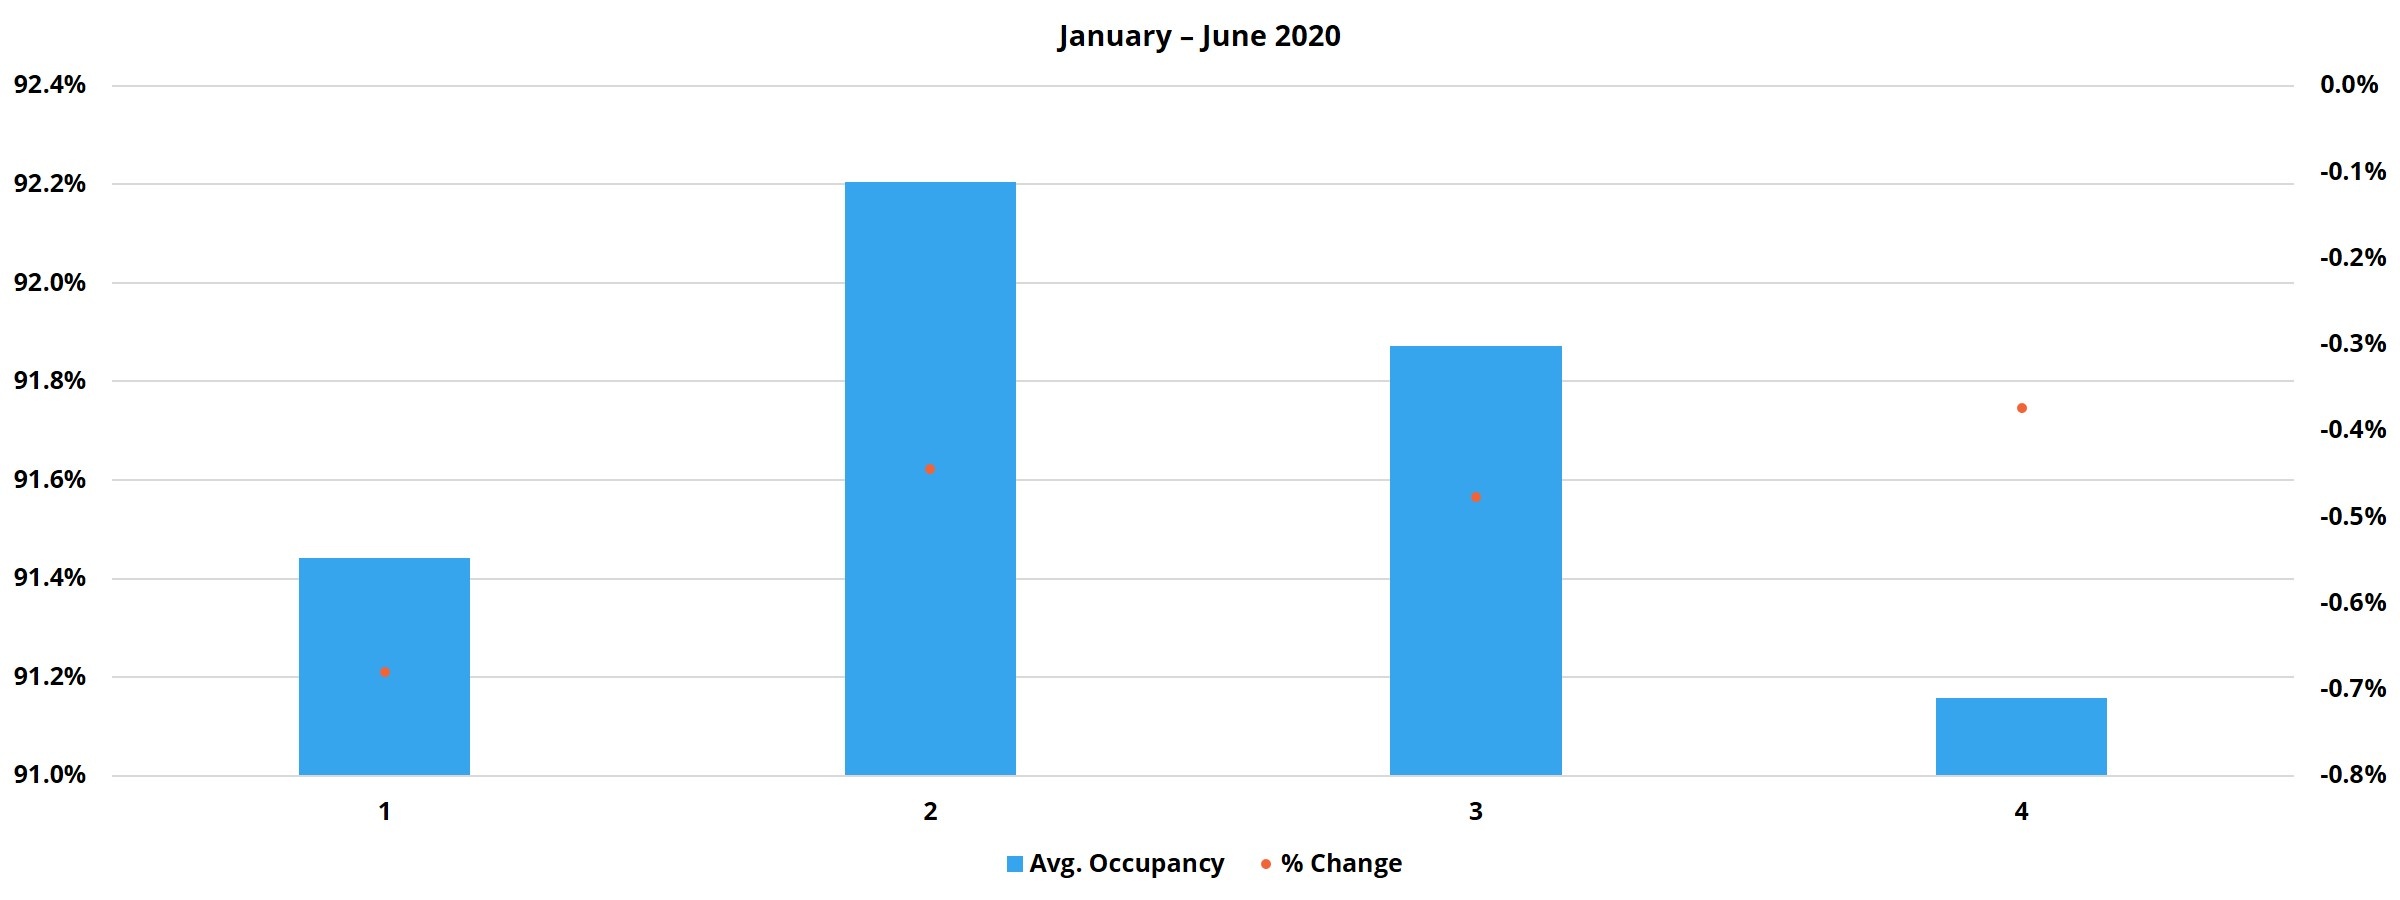
Through the first two quarters of 2020, all market tiers moved into negative territory for average occupancy change, with the largest markets being the most impacted. Areas that especially stood out among the Tier 1 markets include a 2.1% loss in Austin, a 1.7% loss in the Bay Area and a 1.6% loss in Orlando. For Tier 1 and for Tier 4, the first half of 2020 was a continuation of 2019 retractions. However, in 2019 each of those two groups lost less than 0.5% at the average.

Net Absorption
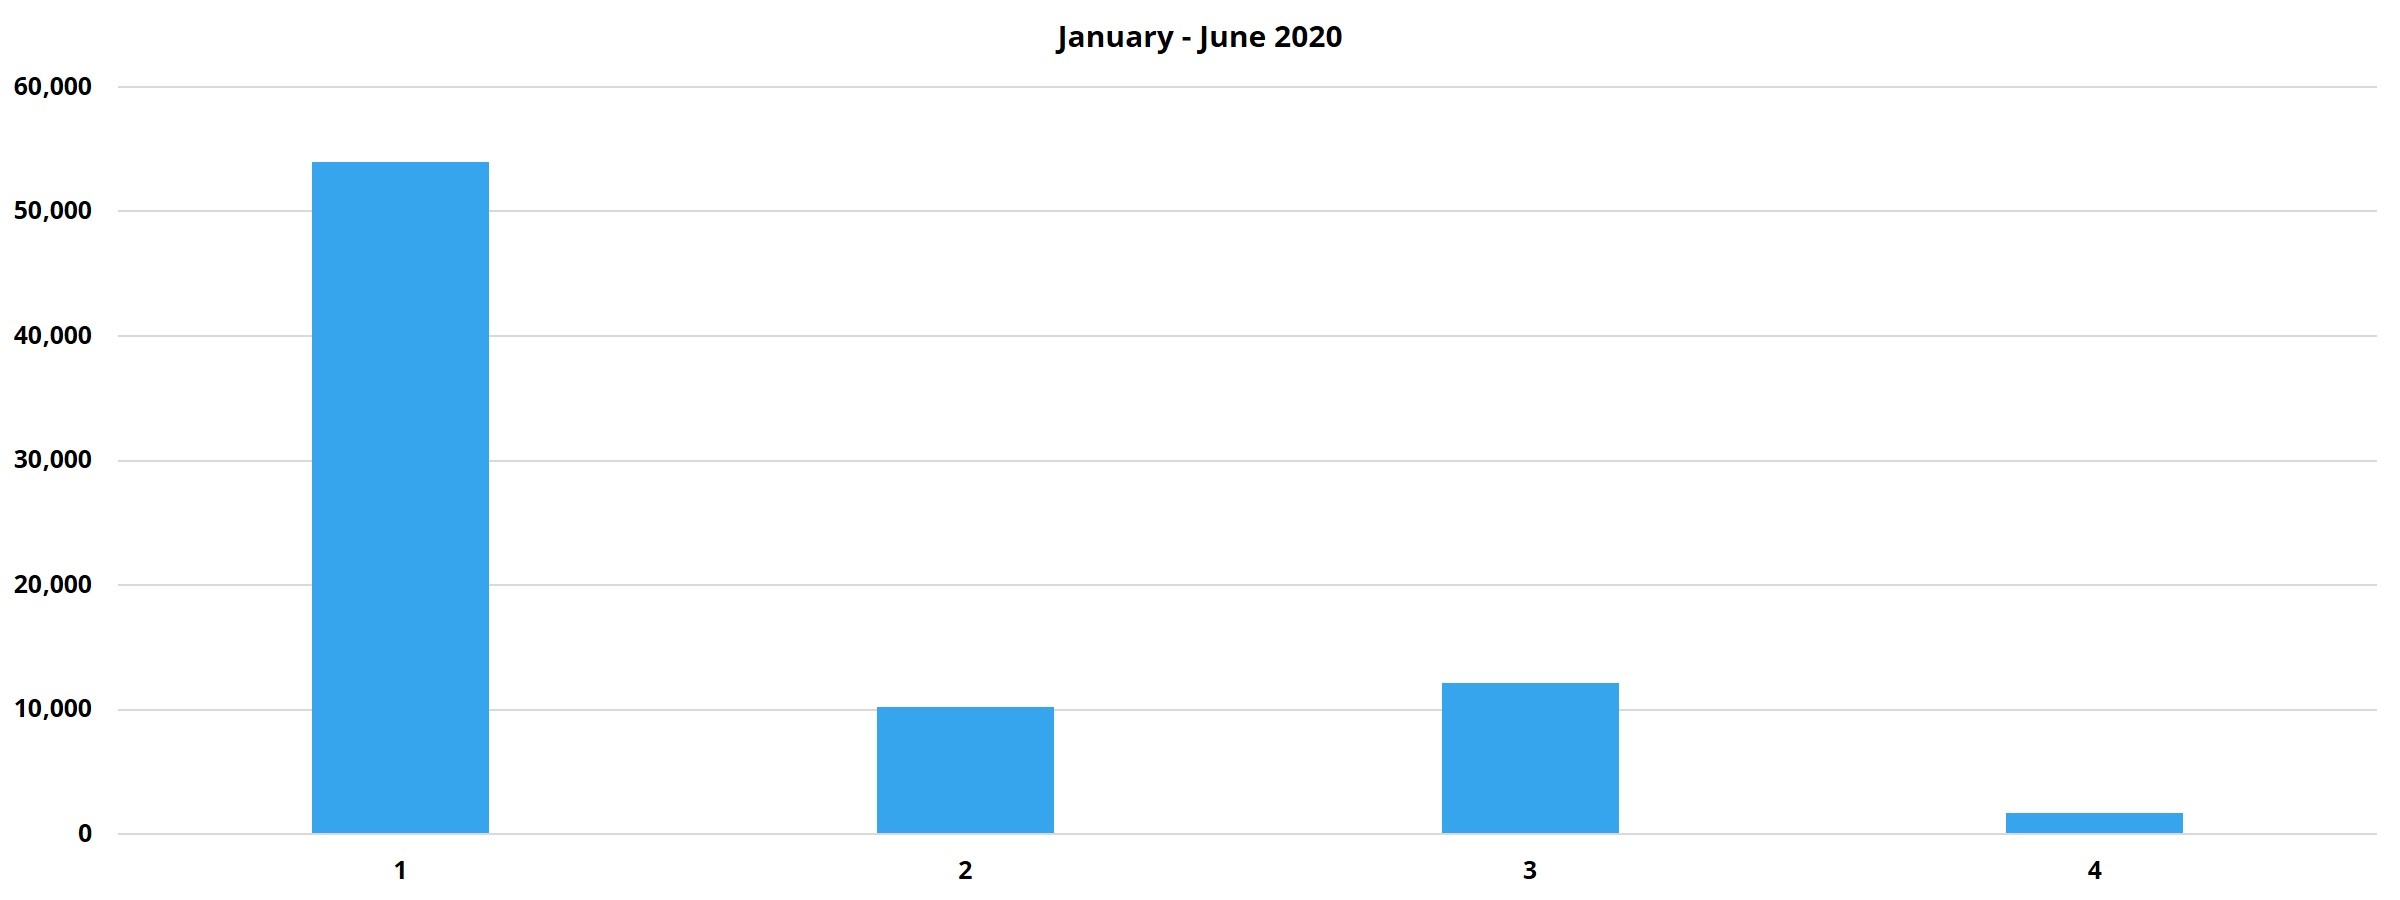
While net absorption did not turn negative for any market tier, there were five or ten markets in each of the four tiers that had a net loss of rented units in the second quarter. In Tier 1, it was the large west coast markets that saw the biggest losses. In the Bay Area, almost 3,000 net rented units were lost. In the LA – Orange county area, more than 1,900 net rented units were lost. And both San Diego and Seattle shed more than 700 net rented units each in the quarter. Other markets with relatively large losses were Miami – with about 700 rented units lost and Midland – Odessa, TX where almost 1,400 rented units were lost.

Average Effective Rent
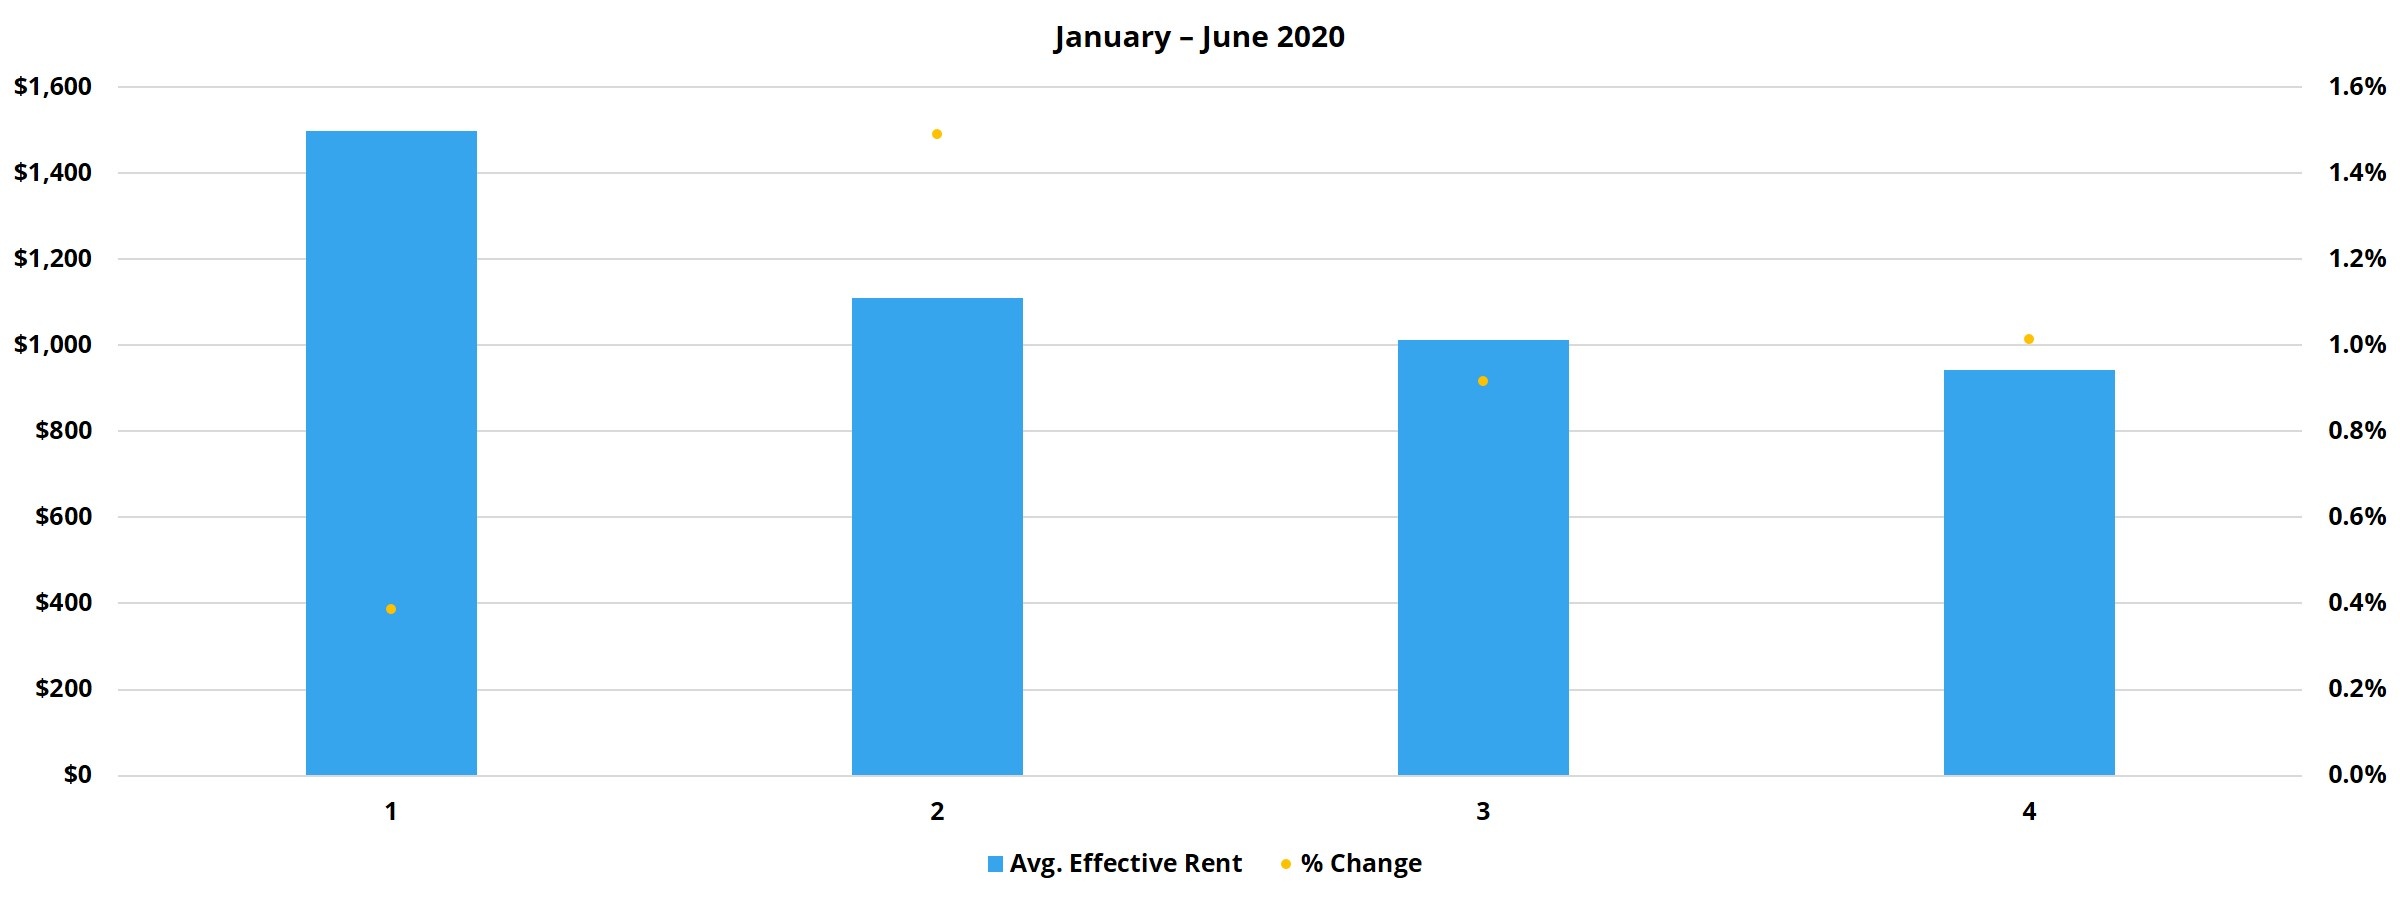
Each tier with the exception of the largest markets managed to get close to 1%, or above 1%, in average effective rent growth in the first half of the year. This is not a terrible result given everything that’s been going on, but certainly well short of what we’ve grown accustomed to seeing in recent years after the typically strong second quarter. The Tier 1 markets would’ve been right around the other tiers except for a rough second quarter. About 60% of the 33 Tier 1 markets suffered average effective rent retractions from April through June. Some of the familiar names crop up here again in terms of biggest losses, specifically Austin, Orlando, San Diego and LA – Orange County.

Disclaimer: All content and information within this article is for informational purposes only. ALN Apartment Data, Inc. makes no representation as to the accuracy or completeness of any information in this or any other article posted on this site or found by following any link on this site. The owner will not be held liable for any losses, injuries, or damages from the display or use of this information. All content and information in this article may be shared provided a link to the article or website is included in the shared content.
