Making Sense of a Turbulent Second Quarter
The first full quarter in which COVID-19 and the corresponding social and economic measures were in effect is in the books. The second quarter is typically a strong one for multifamily, but this year both average effective rent and average occupancy declined at the national level thanks to a precipitous fall in demand.
Read Multifamily Mid-Year Review: A Look by Region and Texas Multifamily: A Mid-Year Review
Using conventional properties of at least 50 units, let’s take a look at those national numbers to get an idea of which areas were hardest hit from a multifamily perspective and what the common threads between those areas are.
View the full monthly Markets Stats PDF
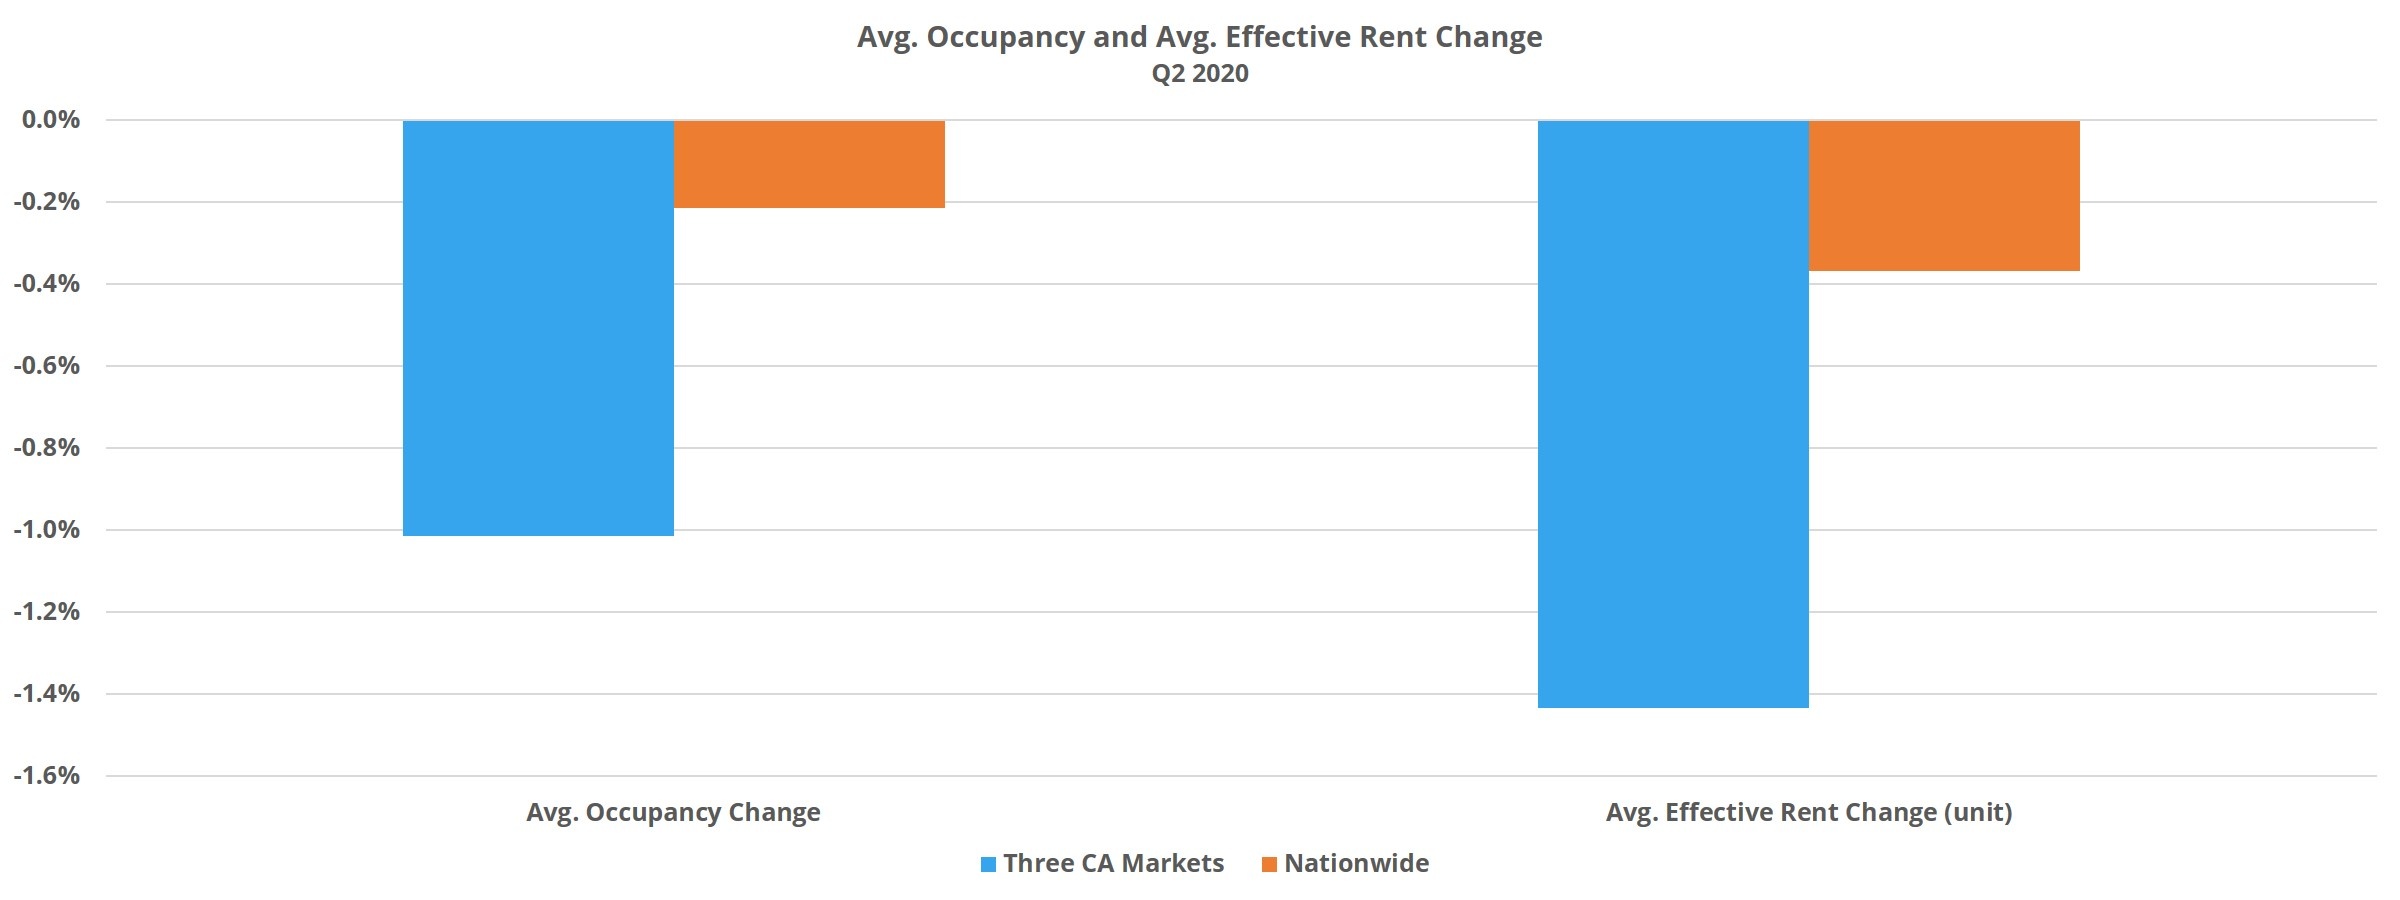
California Markets
The larger California markets were especially affected in the second quarter, particularly the Bay Area. For most markets around the country, new supply at an even near-normal level for the area was a strong indicator of negative performance in the quarter. In the San Francisco – Oakland market, more than 2,300 new units were delivered in the second quarter, which is about the same volume seen in the same period in both 2019 and in 2018.
In addition to the roughly 2,300 new units, net absorption was negative by about 2,800 units. For context, in the second quarter last year the Bay Area added 2,700 net rented units. Consider that the difference in net absorption for April through June of this year compared to last year is a deficit of 5,500 rented units, and then add the 2,300 new units and it is no surprise that average occupancy fell by 1.7% and average effective rent fell by 1.8%.

The Los Angeles – OC market was also hard-hit, though not quite to the extent of the Bay Area. A decrease from 1,500 new units last year to 1,200 this year in the quarter was not enough to offset the loss of 1,900 net rented units. As a result, average occupancy fell by 0.7% and average effective rent decreased by 1.4% after adding 1% in the second quarter last year.
It was stabilized properties that largely drove this result, as those properties shed 3,500 net rented units in the quarter. It is worth pointing out that in just April and May, the area lost about 4,300 net rented units in stabilized properties, so June provided a measure of recompense for the losses earlier in the quarter.
In the San Diego area, a reduction in new supply by about two-thirds compared to last year was not enough to counterbalance a net loss of more than 700 rented units in the quarter. As a result, average occupancy fell by 0.7% and average effective rent decreased by 0.8%. There was a clear move toward lower-priced units on the part of residents in the second quarter.
More than 90% of the rented unit losses were in the top one-third of properties for average effective rent per square foot. Average effective rent also fell by 1% in Class A properties, more than in the other three price classes and in a subset that would typically play a large role in driving rent growth for the market as a whole.
Florida Markets
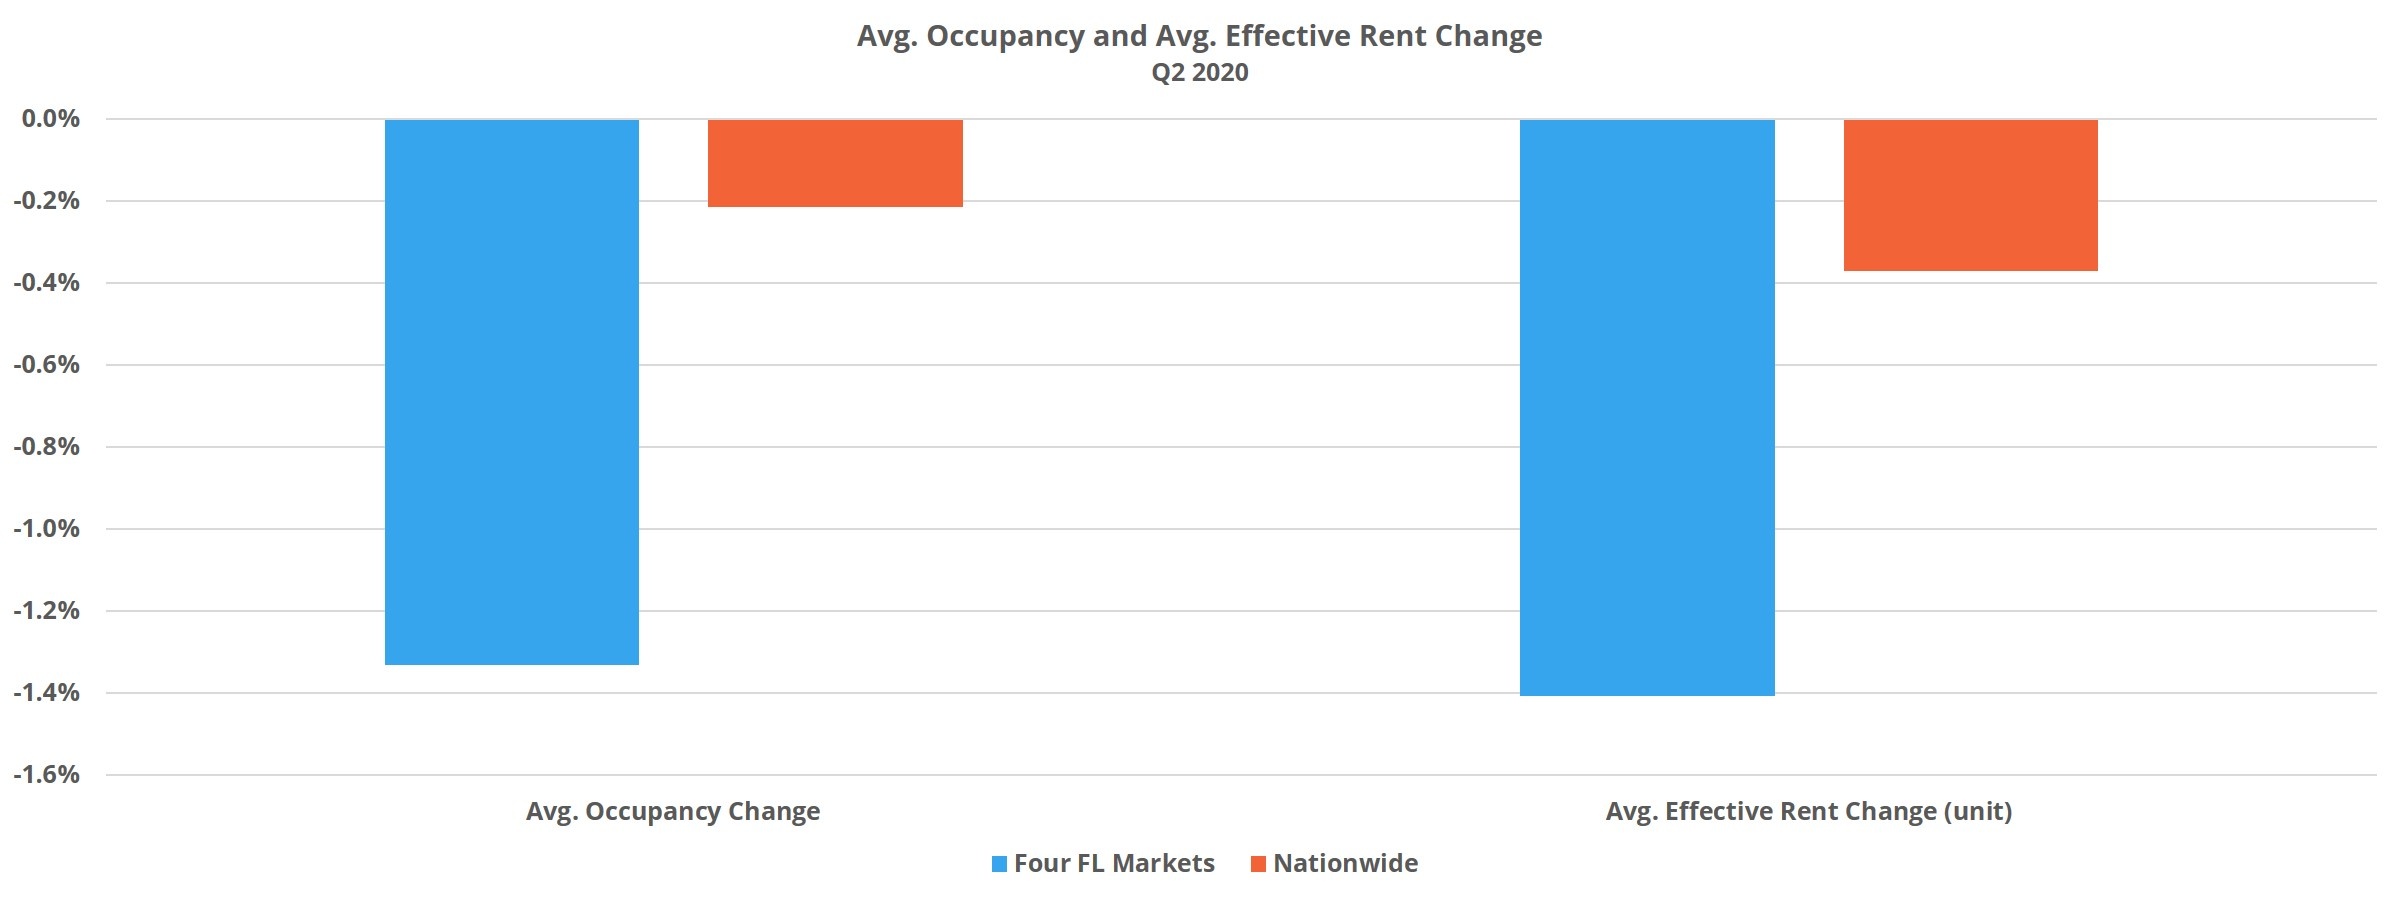
Florida is another state with multiple markets among the worst performers in both occupancy and rent change. In fact, of the 13 markets around the country to fall into the bottom 10% of performers for both average occupancy and average effective rent change, four were in Florida.
Net absorption was positive, if very slightly, in Fort Myers – Naples. However, new supply was too much to maintain average occupancy. Being a smaller market, about 500 new units were enough to drop average occupancy by 1.8% after only 20 net rented units were added. Average effective rent was similarly affected, declining 1.7%.

Palm Beach lost about 450 net rented units. The market added more than 300 new units in the quarter as well, driving average occupancy down by 1.4%. Average effective rent change was worse, and in fact worst in the state, declining by 2.3% in the quarter. That decline was caused in large part by a 93% increase in the availability of lease discounts. Stabilized properties provided most of that downward pressure on rents. Around 17% of stabilized conventional properties were offering a discount at the end of June, up an eye-popping 111% in the quarter.
In Miami, more than 600 new units were introduced in a period where net absorption was negative by 700 units. Both average occupancy and average effective rent declined by about 1.4%, but certain segments of the market were especially impacted. Class A average occupancy fell by 3.4% and Class B occupancy fell 5.6%.
On the effective rent side, Class A properties managed to add 0.4% at the average while Class B properties lost 3.5%. The only price tier with positive demand and a gain in average occupancy was Class C, but that positive result came at the expense of a 1.7% loss in average effective rent.
In Fort Lauderdale a little more than 200 net rented units were lost in a period in which more than 600 new units were added. Average occupancy fell by 1.2% as a result and average effective rent declined 0.7%. Stabilized property performance was basically the inverse. Average effective rent fell by only 0.5% but average effective rent experienced a loss of 1.5% in the quarter.
Energy-Focused Markets
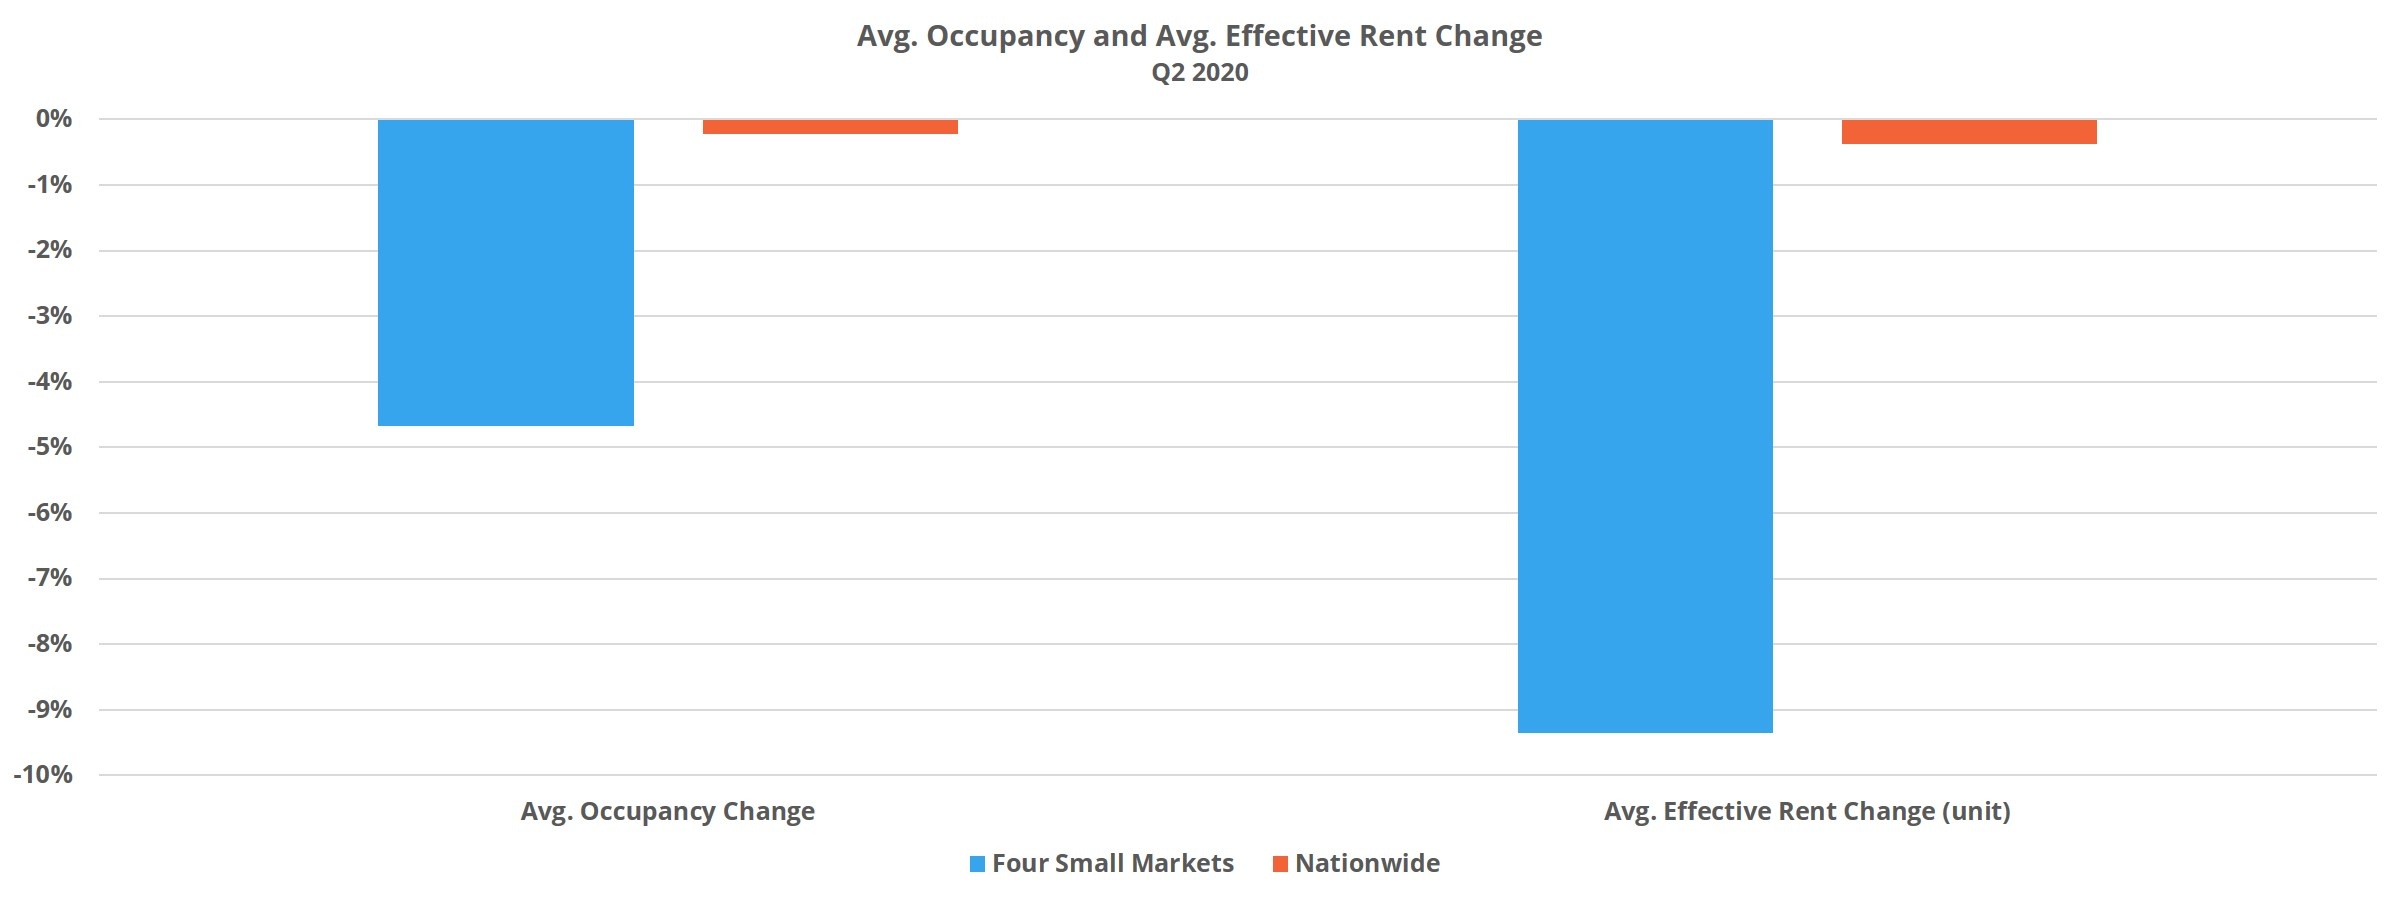
Finally, another group of markets hit especially hard in the second quarter were small markets with a high concentration of energy sector jobs. Examples include Bismarck, ND, Lake Charles, LA, Midland – Odessa, TX and Victoria, TX.
Until recently, Midland – Odessa had the highest average occupancy and highest average effective rent in Texas. Over the last year or so, some new units were added, and the market became a little more balanced. In the second quarter though, average occupancy fell by about 7% and average effective rent declined by an astounding 13%. About 38% of properties are now offering a lease discount, up from 25% to begin April.

The story was much the same in the other three markets, though to a much lesser extent. Victoria lost the most ground on the average occupancy front, with a decline of 2.3%. On the rent side, Bismarck lost 3.7% at the average. Only around 6% of conventional properties were offering a discount at the end of June, but the average value of the discount offered increased substantially in the quarter from only about 2% off a 12-month lease to 12% – equivalent to about six weeks off a 12-month lease.
Takeaways
A few distinct multifamily markets and sectors took the brunt of impact from the COVID-19 pandemic in the second quarter. First, the large California markets: areas that are large, dense and expensive – especially the Bay Area and Los Angeles – OC. They also attract a lot of travel, including major conferences and other business travel.
Additionally, these markets were among the earliest to declare states of emergency, cancel conferences and initiate shutdown measures more broadly. More recently, COVID-19 cases continue to be an issue and some areas have begun re-instituting some of those shutdown policies to various degrees.
Secondly, the Florida markets were especially impacted thanks to a reliance on travel and tourism activity and the retail, hospitality and service jobs that activity supports. Honolulu is another market not mentioned here that would fit into that category and that experienced a rough second quarter.
Lastly, smaller markets with a high concentration of oil and other energy sector employment were disproportionately affected. Because of their smaller size, the largest percent change declines were found in these markets for the most part. Until more nearly normal economic activity resumes, particularly manufacturing and travel, these areas that rely on strong energy prices are likely to continue struggling.
Remove the eleven markets mentioned in the three sections above, and nationwide average occupancy for the second quarter moves to unchanged rather than the actual 0.2% decline, and average effective rent growth moves from -0.4% to -0.1%. Those figures remain rather dismal for a portion of the year that generally drives annual growth, but the outsized impact of a dozen or so especially affected markets is clear.
Disclaimer: All content and information within this article is for informational purposes only. ALN Apartment Data, Inc. makes no representation as to the accuracy or completeness of any information in this or any other article posted on this site or found by following any link on this site. The owner will not be held liable for any losses, injuries, or damages from the display or use of this information. All content and information in this article may be shared provided a link to the article or website is included in the shared content.

