Market Tier Averages Performing Similarly Across Several Metrics
As the current cycle continues to age, secondary and tertiary markets have been getting increased attention from the owner/investor side of the industry. Much of the new construction activity has obviously focused in the large markets yet we’re seeing more activity outside of the major metropolitan cities. As we move through the first quarter of 2020, let’s look at some key performance metrics for markets of various sizes.
View the full monthly Markets Stats PDF
The more than 180 ALN markets have been assigned to one of four tiers according to the level of multifamily presence in each market. Tier 1 markets are the largest multifamily markets, such as Los Angeles, New York and Dallas – Fort Worth. Tier 2 markets include areas like St. Louis, Miami and Salt Lake City. Though some of these markets are large metropolitan areas, their conventional multifamily presence is much smaller compared to the Tier 1 markets. Tier 3 markets are regions such as Albuquerque, Charleston and Lincoln. Finally, Tier 4 markets include smaller areas like Sioux Falls, ID, Amarillo, TX and Albany, NY.
All numbers will refer to conventional properties of at least 50 units.
Average Occupancy and Net Absorption
When comparing average occupancy for each tier to the others, it’s notable how tight the range of values is across the four categories. Similarly, despite the near-record new construction activity across the country these last handful of years, average occupancies have also remained quite stable. Tier 2 markets had the highest cumulative average occupancy of the four tiers at the end of January, finishing the month slightly above 92%. Tier 1 markets finished January at 92% for average occupancy, as did Tier 3 markets. The smallest markets don’t lag far behind, with an average occupancy slightly above 91%. These values are uniformly essentially unchanged from a year ago, with no tier experiencing even 0.5% annual change.

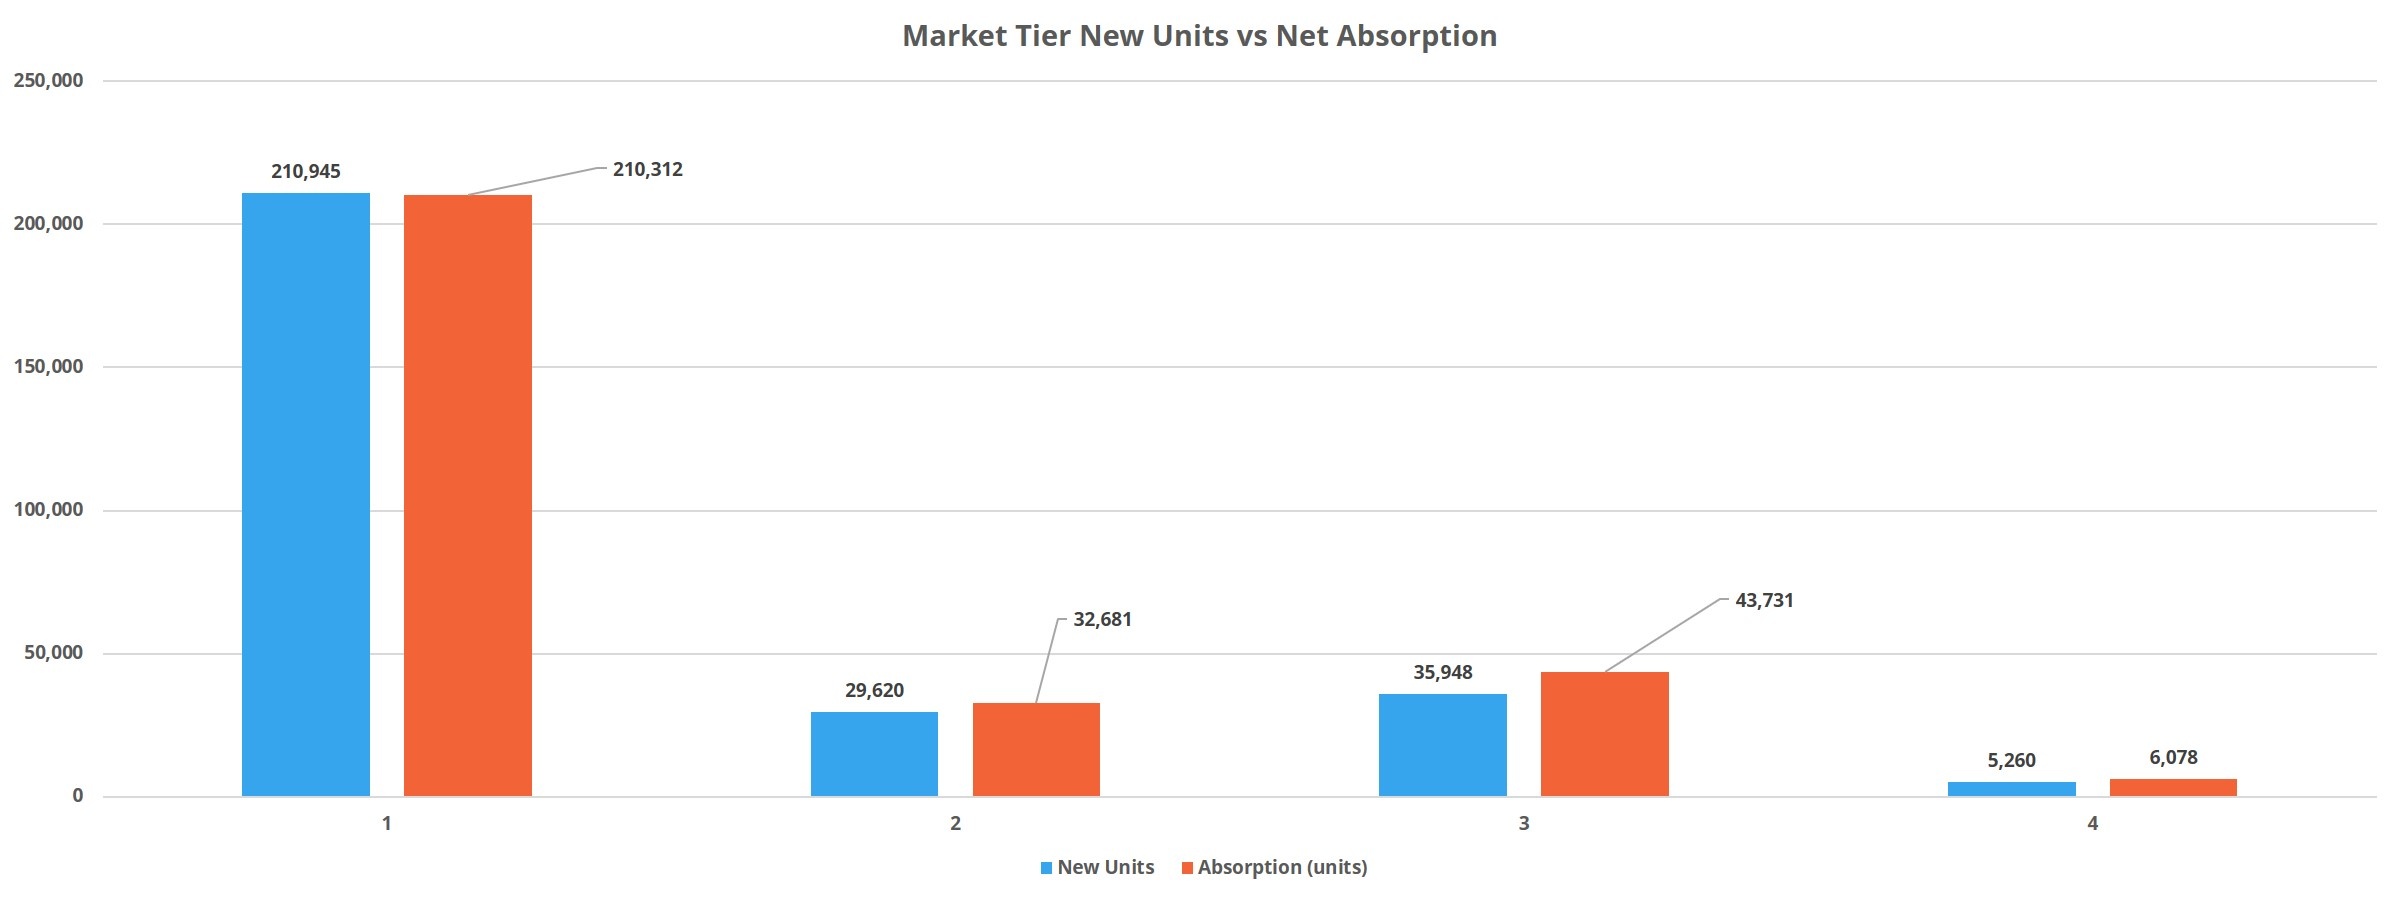
Due to the difference in sample size between the market tiers, analyzing net absorption on a percentage basis allows for more apt comparisons between groups. Here, we’ll use units absorbed as a percent of market capacity to reflect relative demand. Once again, markets of different sizes bear a striking resemblance to each other. No market category absorbed less than the 2% of existing capacity managed by Tier 4 markets, and yet no tier bettered the 2.6% of capacity absorbed by Tier 1 markets. For some additional context, consider that in the period from January 2017 through January 2018, units absorbed as a percent of existing capacity in Tier 1 markets was more than four times that of Tier 4 markets.
Another generalization that can be made is that for the most part, the last twelve months have been better from a demand perspective than the annual period from January 2017 through January 2018, but not as robust as the period from January 2018 trough January 2019. The lone exception is Tier 3 markets, in which 4,000 more previously vacant units were rented in the last 12 months than were in the preceding 12.
Average Effective Rent Growth and Concessions
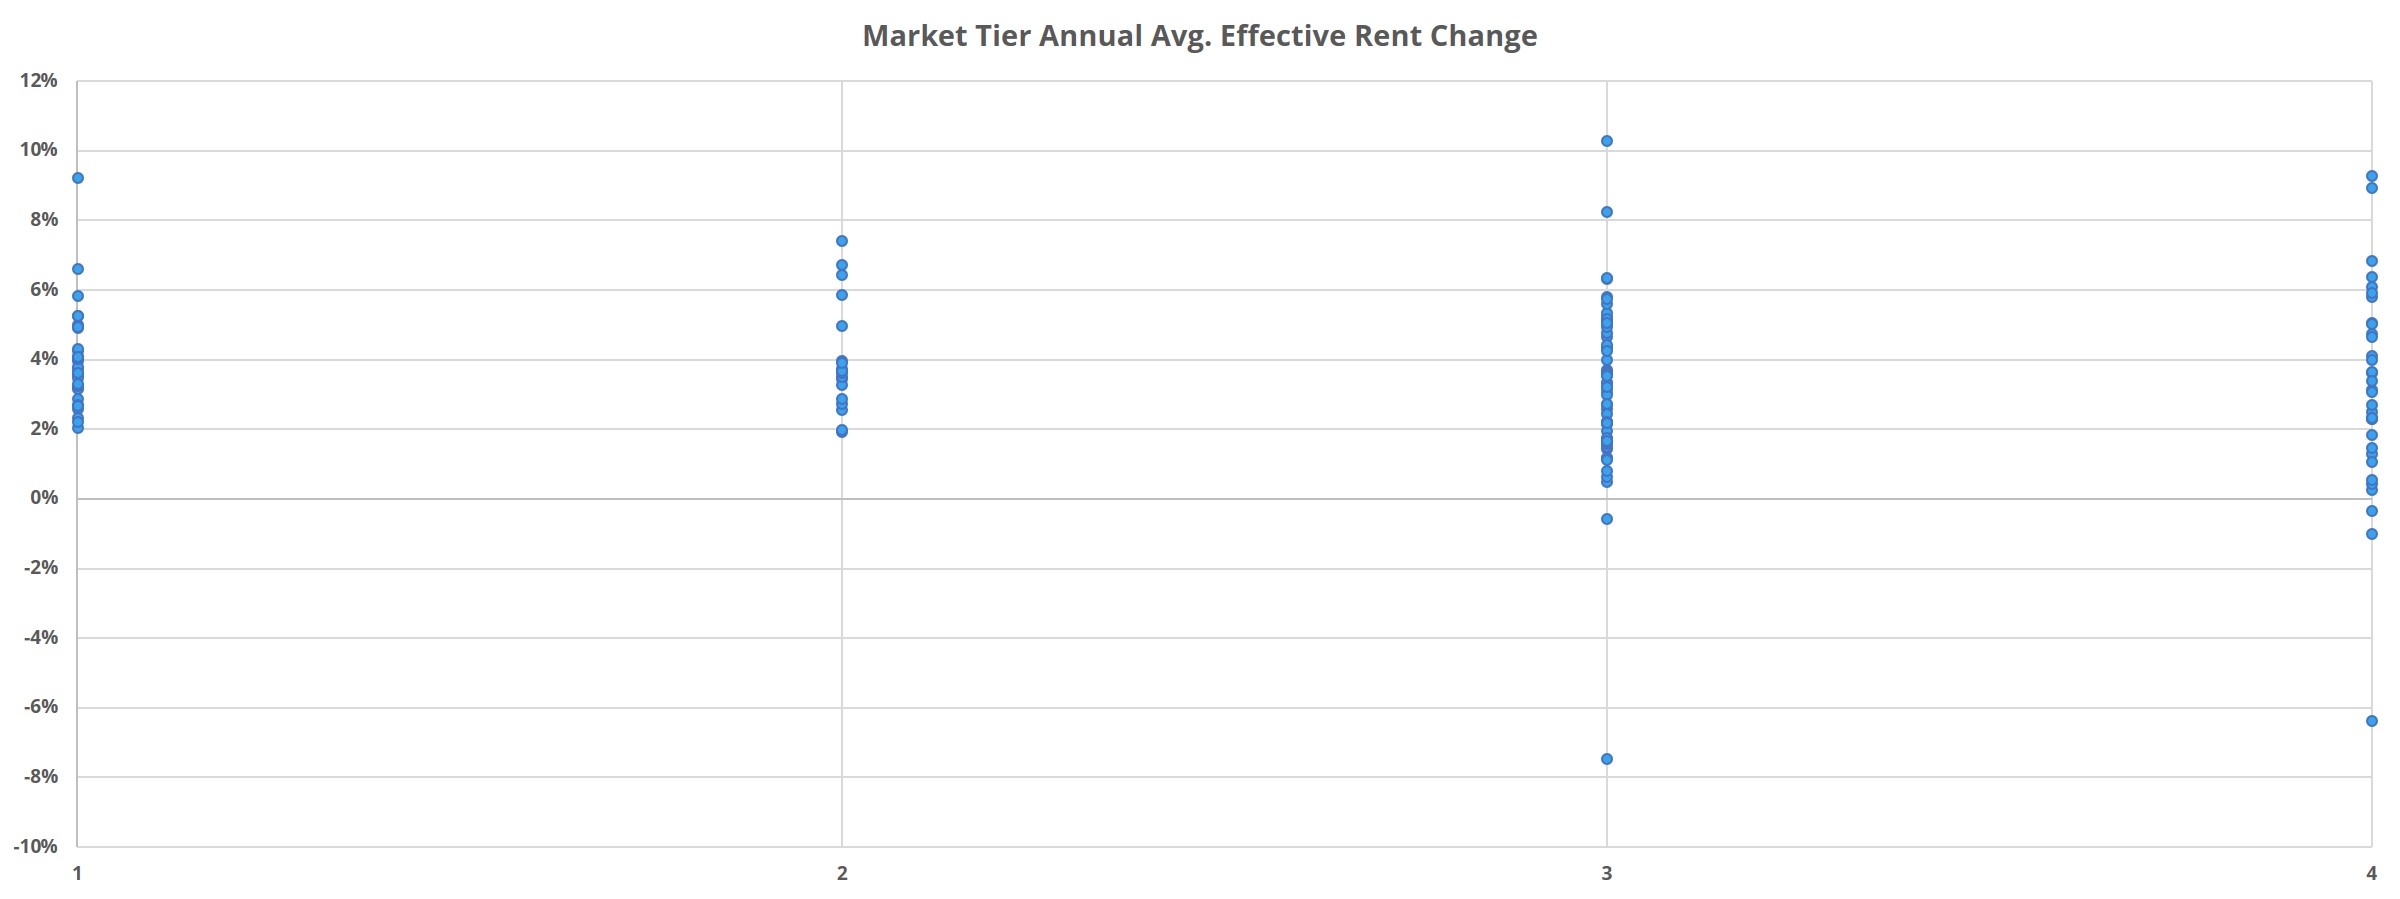
Two overarching trends become apparent when evaluating average effective rent growth between market tiers and over time – rent growth is slowing and performance differences between areas of different sizes are shrinking. Tier 2 markets led the way over the past year in effective rent growth, with a 4% gain. Tier 1 markets experienced an increase a little above 3.5% and the smaller two tiers each saw around 3.25% appreciation. Compare this to the annual period from January 2018 through January 2019 where the lowest average rent gain was the 4.25% in Tier 4 markets. Or, to the period from January 2017 through January 2018 when no market category failed to match the 4.9% rent growth of Tier 2 markets.
One aspect of effective rent growth is the availability and value of rent concessions. An increased reliance on concessions across markets of all sizes certainly had an impact on rent growth in the last 12 months. Tier 4 markets, which began the period with about 17% of properties offering a discount, remained mostly unchanged and concession availability remains a little below 18% presently. The other tiers didn’t begin the period at as high a level of availability but have moved closer to Tier 4 in the months since. 17% of Tier 1 markets are now offering a discount, as are 14% of properties in Tier 2 and Tier 3 areas.
Though rent discounts are becoming more widespread, the positive news is that the average value of the concession package being offered has remained stable across markets of all sizes in recent years. No market tier had an average discount value higher than the 6% off a 12-month lease found in Tier 1 markets to end January. The lowest value was the 5.25% average discount in Tier 4 markets. Each market tier’s average value is equal to, or lower than, the average from as recently as January 2017 through January 2018.
Did you read our year in review article looking back at 2019 yet?

Takeaways and Final Notes
Unlike more recent years, markets with varying degrees of multifamily presence are increasingly performing similarly across a host of metrics. Apart from construction volume, average occupancy and overall demand also appear strikingly similar in markets of varying sizes.
When it comes to rent growth, we see markets of all sizes following the same flattening upward trajectory and even a similar level of reliance on rent concessions to maintain occupancies.
Differences begin to appear when statistical measures of dispersion are applied to bring into focus the range of values within each market tier. As markets decrease in the size of their multifamily presence, there is larger variance between the worse and better performing markets within each tier. The largest markets tend to be more heavily concentrated within range of the median value for the tier, both for relative demand and for effective rent growth. The difference is most profound between Tier 1 markets and Tier 4 markets, with the latter displaying three times the intra-tier variance.
Disclaimer: All content and information within this article is for informational purposes only. ALN Apartment Data, Inc. makes no representation as to the accuracy or completeness of any information in this or any other article posted on this site or found by following any link on this site. The owner will not be held liable for any losses, injuries, or damages from the display or use of this information. All content and information in this article may be shared provided a link to the article or website is included in the shared content.

