

Major Developments in Price Class Absorption
A major story this year for the multifamily industry has been the considerable increase in net absorption. The industry saw year-over-year improvement in 2023 and in 2024, but the multi-year uptrend has gained steam this year. One interesting aspect has been what has occurred at the price class level.
All numbers will refer to conventional properties of at least fifty units.
View the full monthly Markets Stats PDF
National Net Absorption
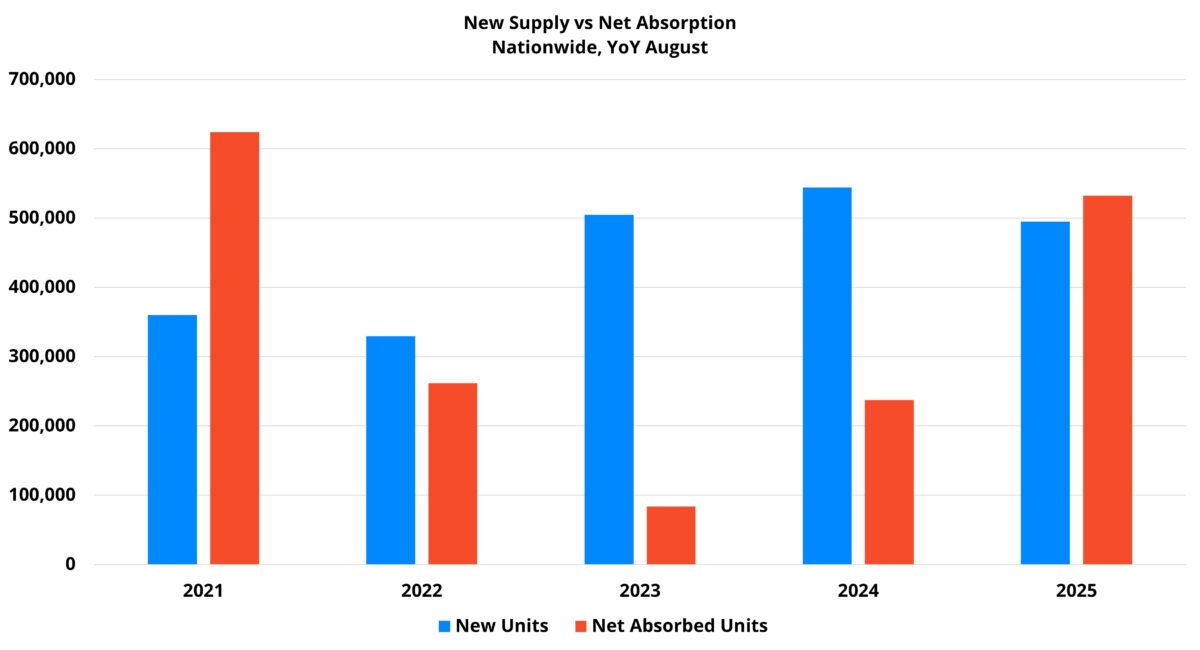
Just more than 530,000 net units have been absorbed over the last twelve months. That level of demand was surpassed in recent years by only the September 2020 through August 2021 period. Realized apartment demand has also exceeded new supply over the last year for the first time in three years.
The changing relationship between supply and demand has been an important development this year. Apartment demand was solid last year in a vacuum, but net absorption fell well short of new supply. That put downward pressure on national average occupancy for a third straight year.
Low, and still falling, occupancy made a turnaround in rent performance difficult. This was especially the case in markets across the country that had been dealing with a deluge of new supply for a handful of years.
This year, apartment demand has taken another robust step in the right direction and multifamily new supply has started its descent from a 2024 peak. This combination has allowed occupancy to gain ground for the first time since 2021.
Despite still being considerably lower than normal, strong demand and rising occupancy have resulted in improved rent growth. Average effective rent for new leases has increased 3.3% over the last twelve months.
While not the eye-popping gains from the 2021 and 2022 period, recent performance should be a welcome sight for an industry that saw the same metric rise less than 1% in the previous twelve months.
Price Class Context from Recent Years
Tracing the rough contours of price class demand trends over the last few years can provide some useful context for the current moment. Broadly speaking, realized apartment demand bottomed out in 2022 after exploding in 2021. That period’s volatility will be discussed for years to come.
As apartment demand began to recover from the 2022 trough, it was the top of the market that led the charge. Class A net absorption was the most resilient in 2022 and was the first to begin to recover in 2023. Both the Class C and Class D subsets experienced a net loss of leased units in 2022. Class D suffered the same fate again in 2023.
By the end of last year, each price tier aside from Class D had seen two consecutive years with positive and consistently improving net absorption. Class D had managed improvement, but after a net loss of leased units in 2022 and in 2023, the price tier managed only about 10,000 net absorbed units nationally in all of 2024.
Coming into 2025, one of the factors to watch this year mentioned in the January newsletter was class D net absorption. National apartment demand was anticipated to fall short of new supply once again this year. However, the potential for further Class D net absorption improvement was a factor specifically mentioned in discussion of apartment demand expectations.

Now is the time to get hyper-local insights that matter most. Learn about four essential ALN OnLine reports that can sharpen your budget strategy.
Recent Price Class Demand
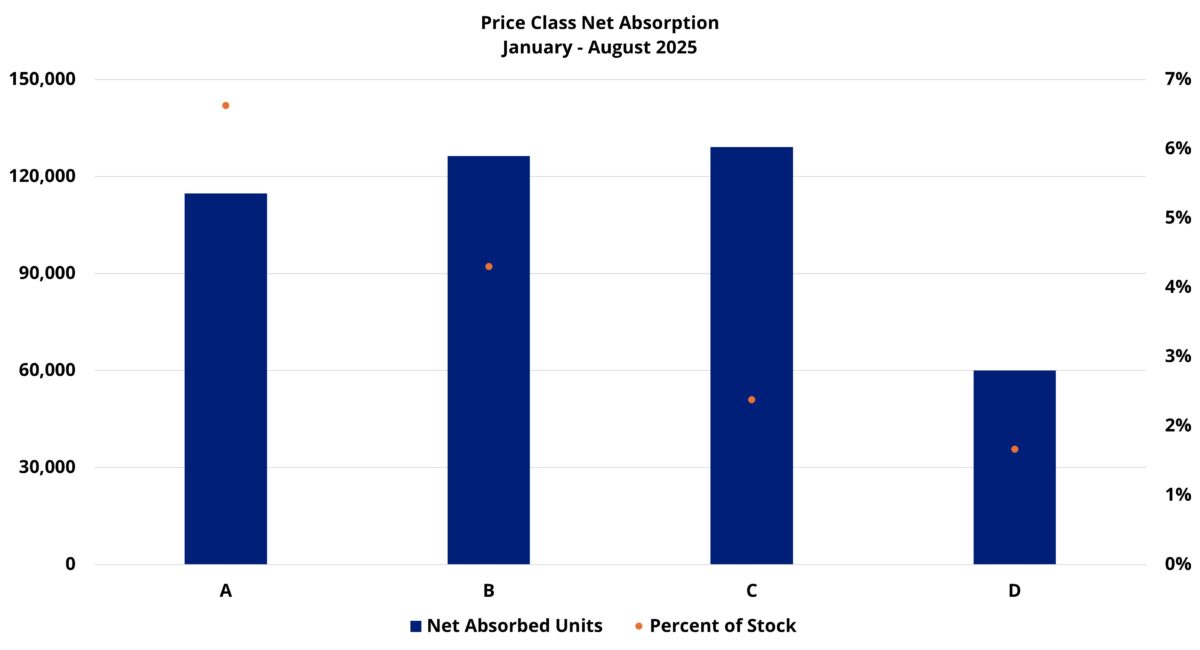
So far this year, that continued improvement has materialized for Class D. Zooming out a little farther, the subset has absorbed more than 50,000 net units in the last twelve months. Compare that to less than 4,000 net units in the previous twelve months. This year through August, Class D net absorption has totaled approximately 60,000 units.
Rather than limited apartment demand concentrating within Class D at the expense of other portions of the multifamily sector, each price class has shown strong improvement. In fact, Class A has seen year-to-date net absorption more than double that from last year. More than 110,000 net absorbed units through August was slightly more than the total from the same portion of 2021. The same can be said for Class D.
The middle tiers, while not at 2021 demand levels, have also performed very well this year . Through August of this year, the Class C subset has absorbed almost 130,000 net units. This fell short of 2021 but slightly exceeded net absorption in the same portion of the calendar for the last three years combined.
Around 126,000 net units have been absorbed so far this year for the Class B group. This portion of the market did not duplicate the aforementioned achievements of the other price tiers. However, absorption through August very nearly doubled last year’s number for the same period.
Takeaways
Net absorption was expected to rise for a third straight year in 2025, but the scale has been somewhat surprising. Encouragingly, the progress has been widespread. All four price classes have made major gains. The same is true for properties that entered the year already stabilized and for all four market tiers (primary, secondary, tertiary, and micro).
A labor market that has remained relatively tight, the return of sustained real wage growth, and increased concession availability and values have all played a role. So too has seasonality. However, now the typically stronger leasing season is ending, and seasonal trends will likely flip into headwinds in the fourth quarter.
That Class D apartment demand has made such strides in recent months, along with the continued momentum for the other tiers, bodes well for the multifamily industry in the big picture.
Disclaimer: All content and information within this article is for informational purposes only. ALN Apartment Data makes no representation as to the accuracy or completeness of any information in this or any other article posted on this site or found by following any link on this site. The owner will not be held liable for any losses, injuries, or damages from the display or use of this information. All content and information in this article may be shared provided a link to the article or website is included in the shared content.
Transform your budget season planning approach with comprehensive market intelligence. Schedule a personalized ALN OnLine demonstration and discover how data analytics can elevate your strategic decision-making.
Continue Your Strategic Planning Journey: