Larger Properties Pacing the Multifamily Rebound
In recent months, ALN newsletters and blog posts have tracked numerous aspects of the ongoing multifamily rebound. From differences between large and small markets, the urban-suburban-outlying divide, and price class variance, a variety of perspectives have been evaluated.
View the full monthly Markets Stats PDF
One area not yet delved into has been how properties of different sizes have responded to changing conditions this year as reflected in the major performance metrics like absorption and rent growth. For our purposes here, we have divided the properties into four segments: 50-99 units, 100-199 units, 200-299 units and 300 or more units. There have been some dramatic differences, and while the outcomes relative to each other have not been hugely surprising, it is nevertheless useful to add some specific data to intuition.
As a reminder, all numbers will refer to conventional properties of at least 50 units.
Properties With 50 to 99 Units
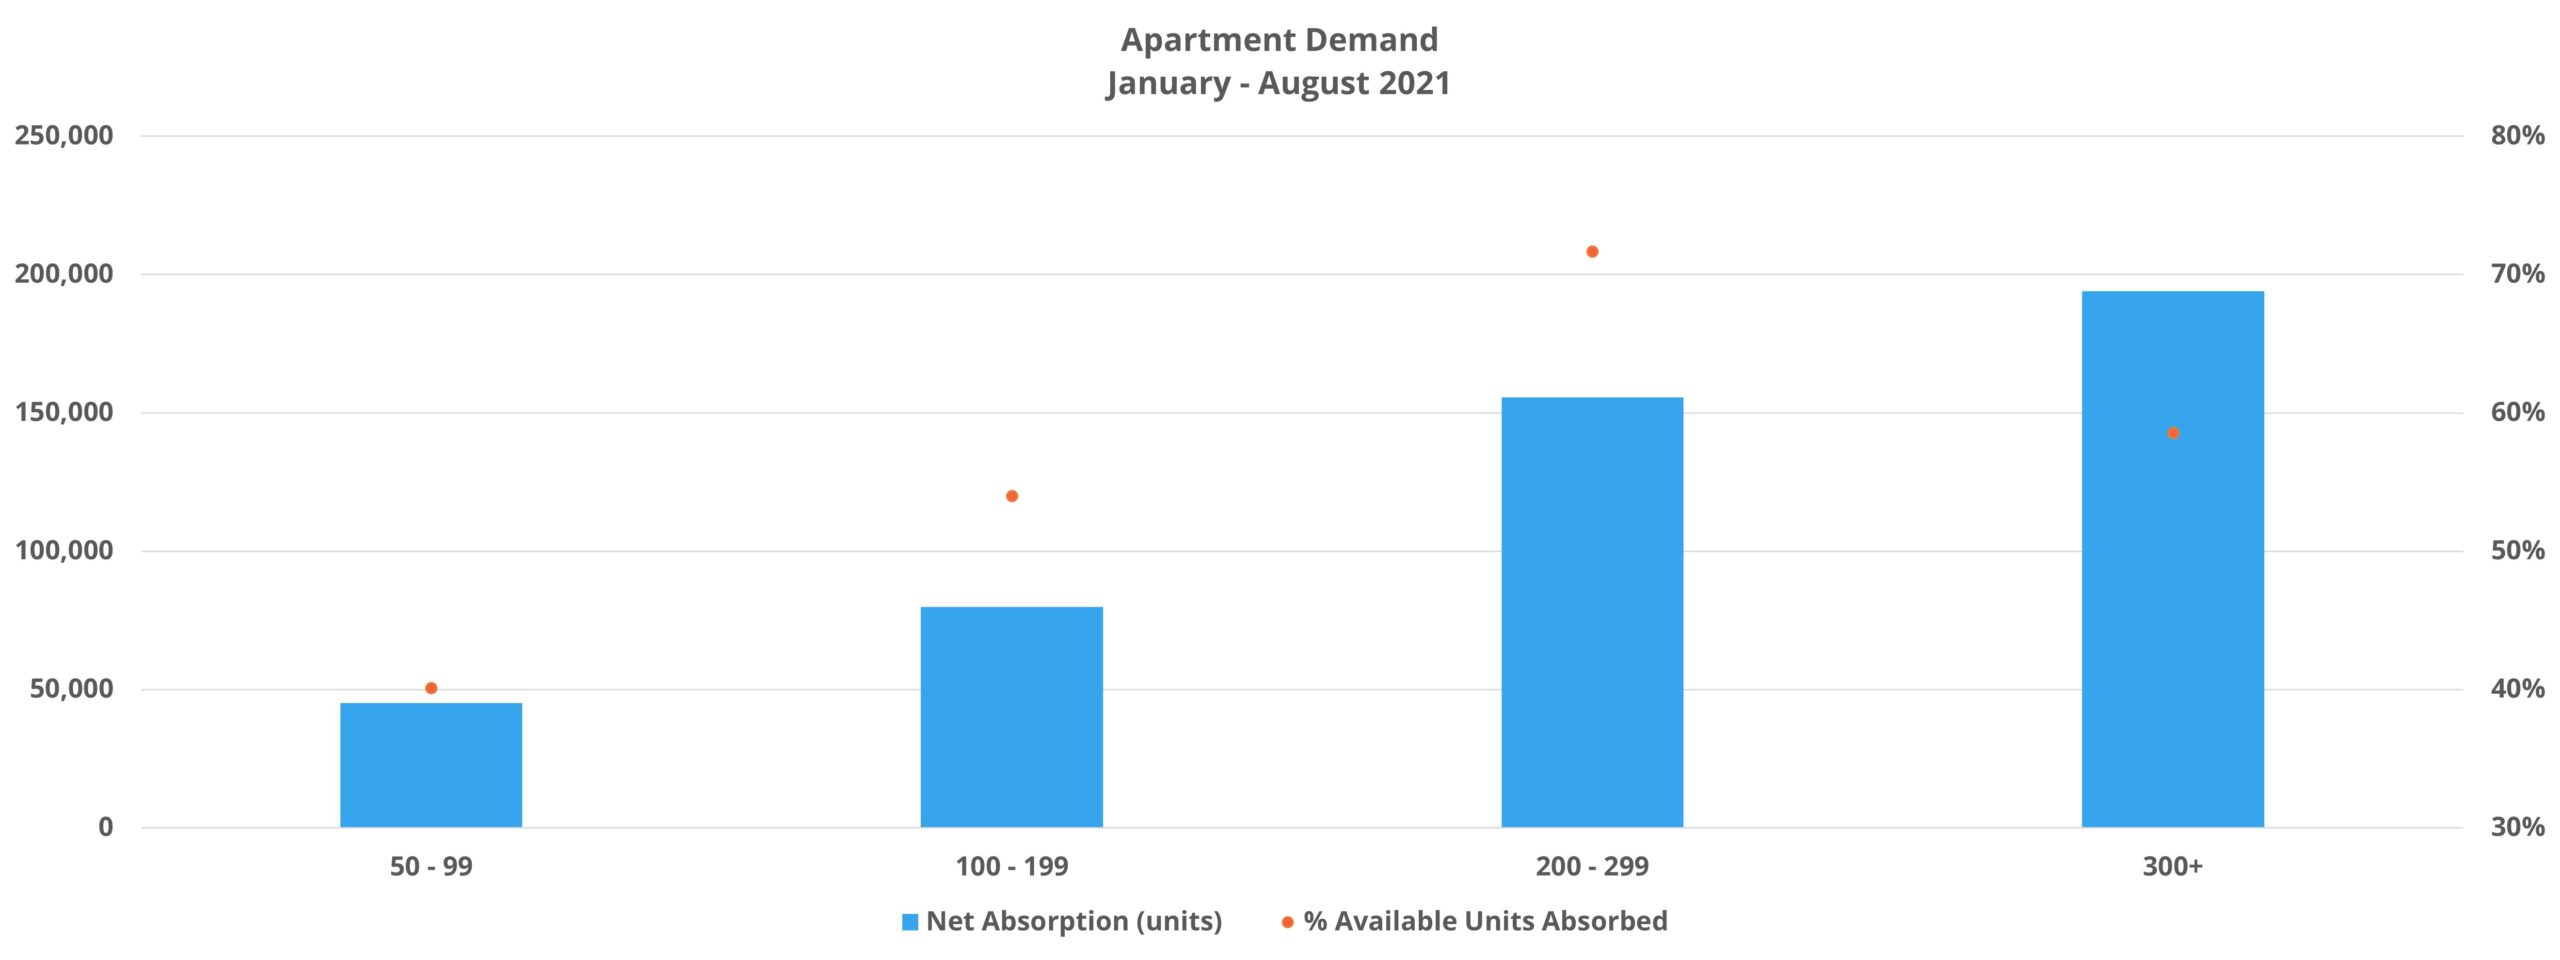
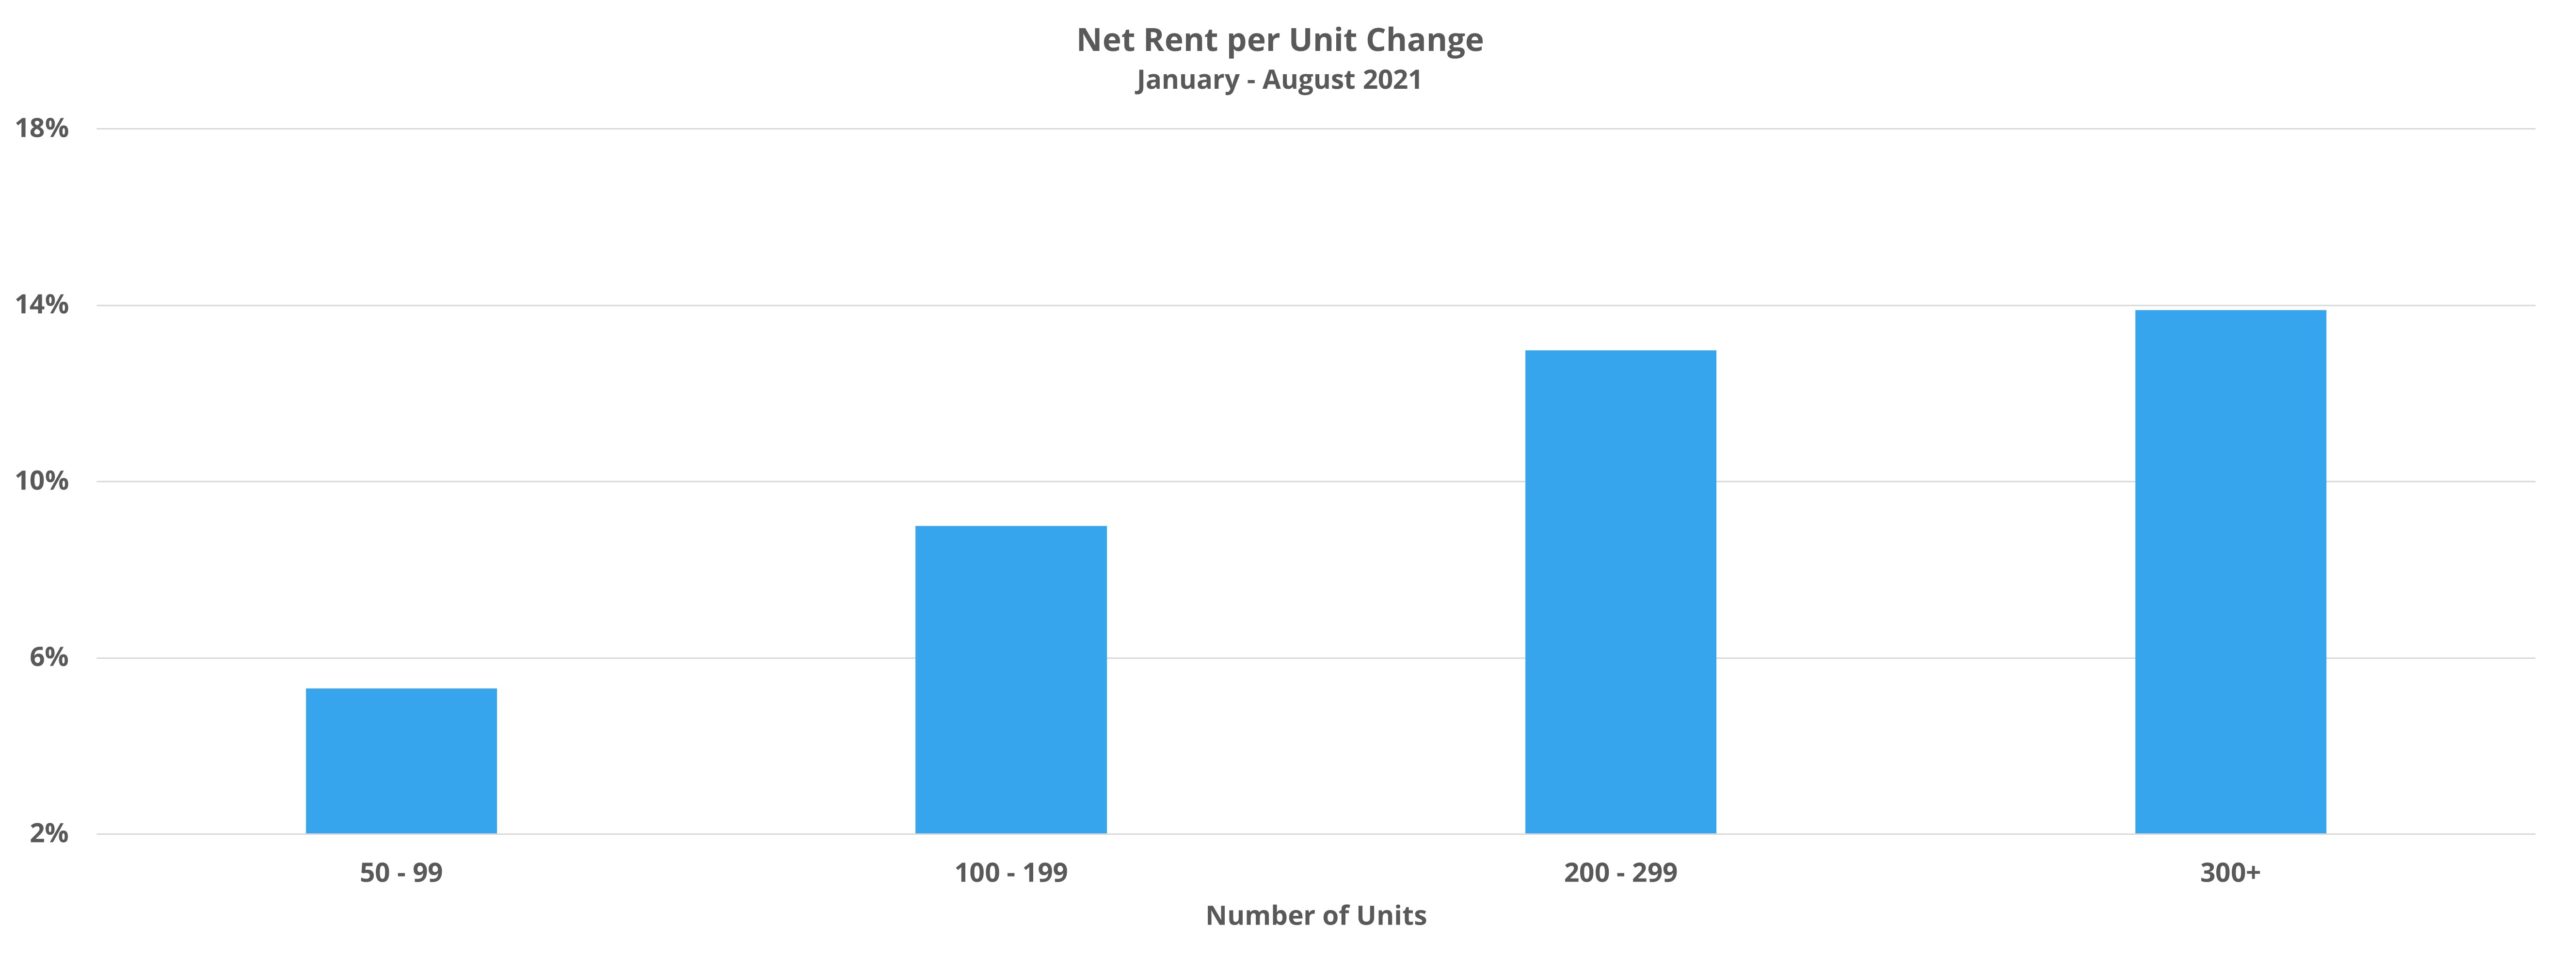
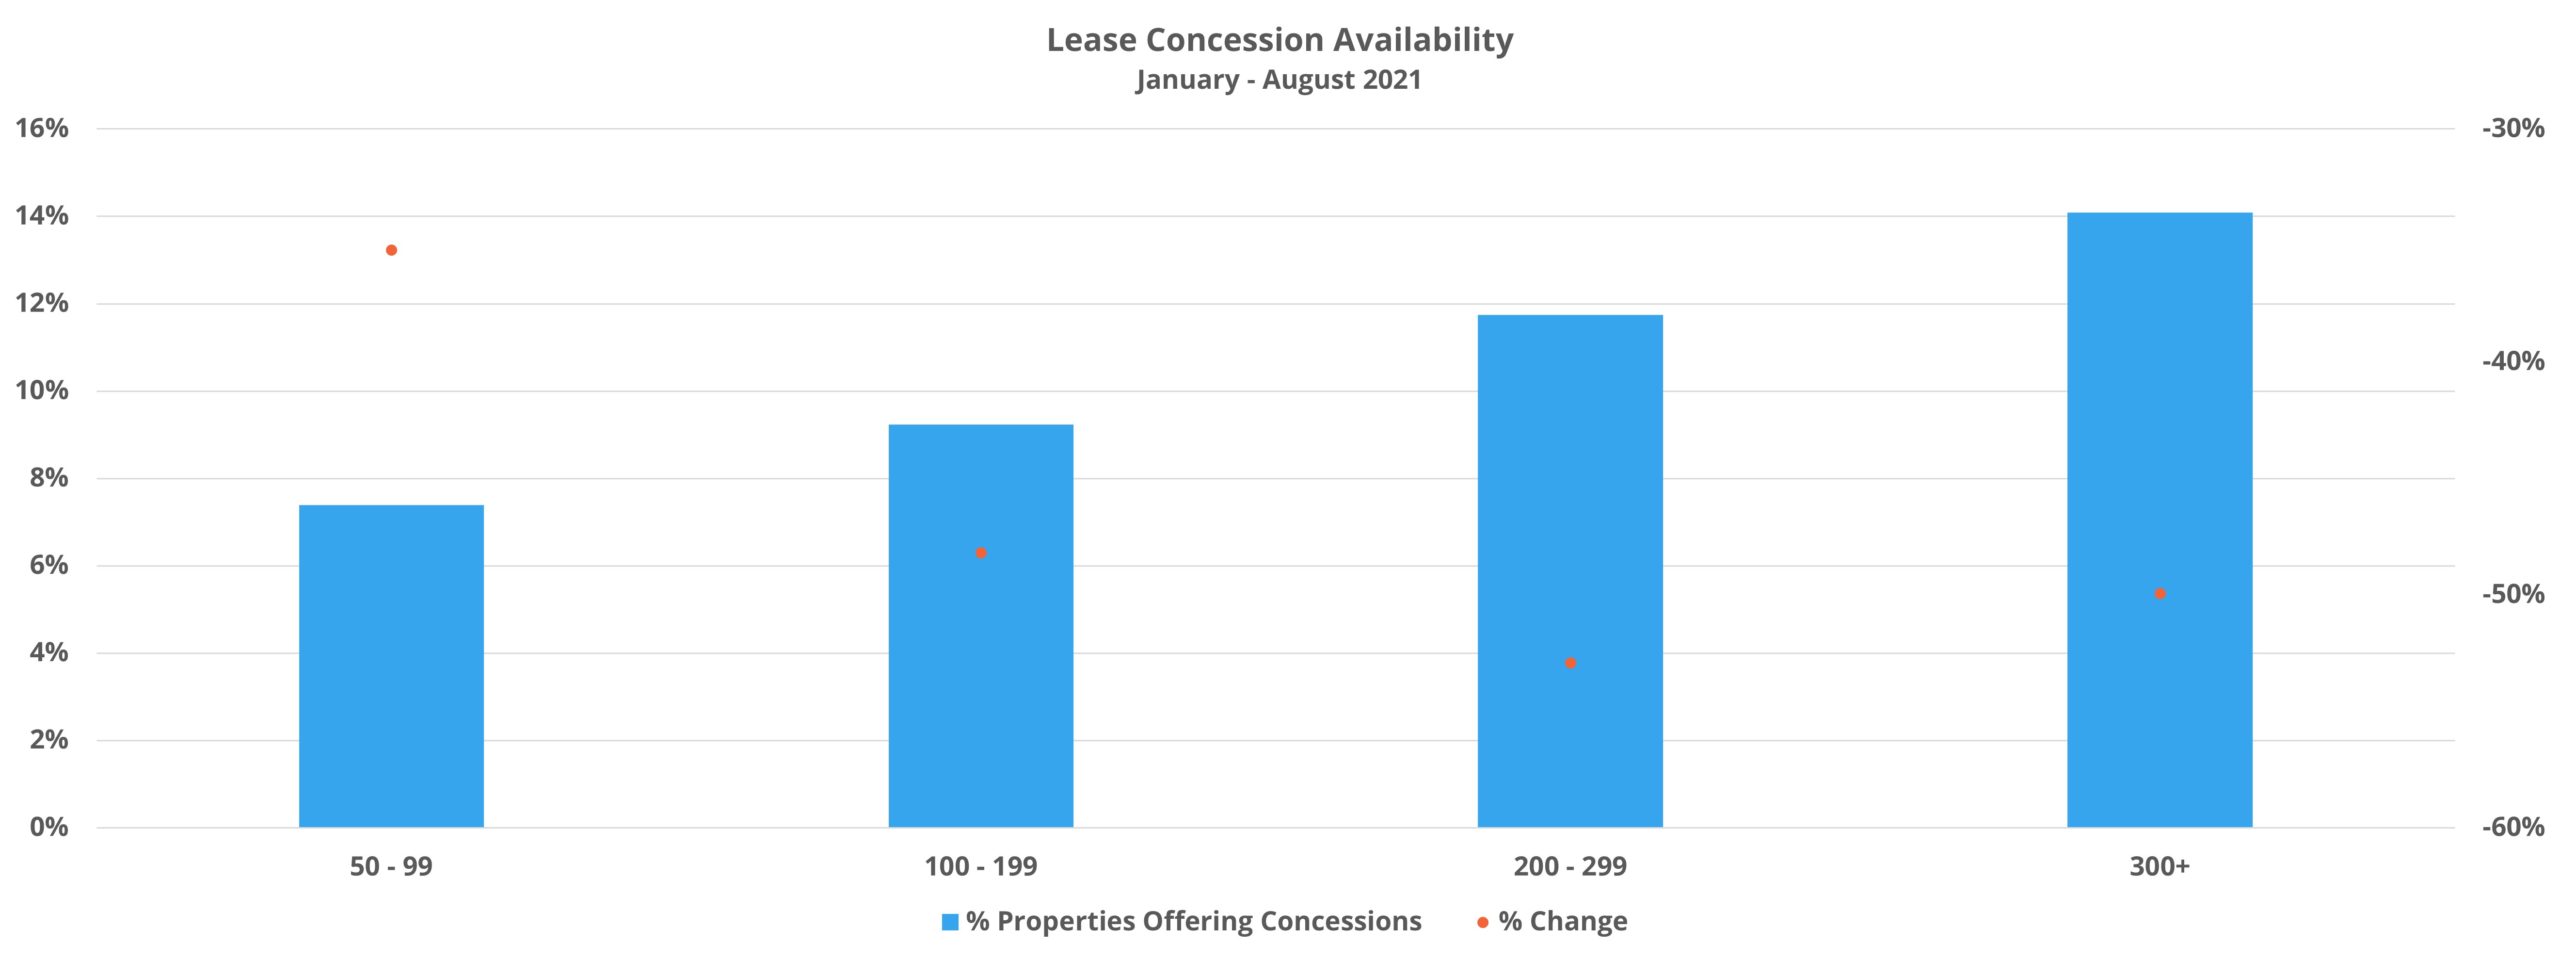
This group represents the smallest properties included in the data set. In total, about 55,000 properties and a little more than 2.1 million units around the United States are included. Net absorption for this subset through August of 2021 totaled approximately 45,000 units, equal to 40% of the unoccupied units in these properties. As a result, average occupancy rose by 0.8% to 95% – tied for the highest of the groups in the data set. Average effective rent has increased by 4.5% since the start of the year with the help of a 35% reduction in lease concession availability.
Only 9% of this group’s units are classified by ALN as Class A units, and yet, demand was stronger within that segment of these smallest properties both in terms of net absorbed units and absorbed units as a percentage of available unoccupied units. About 7,500 Class A units were absorbed through August, representing almost three-quarters of unoccupied units in that segment. While Class A demand leading the way did not put this group of properties in a unique position, the margin by which Class A demand led was unique. Class C net absorption was closest, with about 7,100 net units, but those units accounted for only 49% of vacancies within that subset.
Another point of distinction between these smallest properties and the other groups was the difference in lease concession movement. Concession availability fell across the price classes and across markets of all sizes. Led by the smallest markets, the average discount value also fell across markets of varying sizes, but the average only fell for Class A properties among the price classes. For the remaining tiers, the average discount value has increased this year – anywhere from 1% in Class B to an 8% increase for Class D properties.

Properties With 100 to 199 Units
This group is comprised of approximately 19,000 properties and 2.8 million units. Net absorption of 80,000 units was equal to 54% of available vacant units and propelled average occupancy up by 1.5% to 95%. Average effective rent increased by a little more than 7% thanks in part to a 48% decrease in discount availability.
As with the group of the smallest properties, apartment demand was noticeably more tepid in the smallest markets for these properties. Only 30% of available units were absorbed in tertiary markets while the other market tiers each absorbed no less than 49% of vacant units. Unlike the smallest properties though, which saw rent growth top out at 5.7%, no market tier for this group saw rent growth of less than 7% through August.
From a price class perspective, demand consistently decreased moving down through the tiers, as did rent growth. The top two tiers led the way with effective rent gains of a little more than 10% and 9% respectively, while Class D properties gained 3.6%. Lease concession availability decreased across all four price classes. However, discount value increased for Class D properties by about 6% to close August at three weeks off an annual lease.
Properties With 200 to 299 Units
This segment is made up of about 13,600 properties and 3.35 million units. Average occupancy has increased by 2.2% to finish August above 93% thanks to net absorption of almost 156,000 units this year. Of the four subsets being evaluated, this group managed the strongest demand on a percentage basis with 72% of unoccupied units being leased in the period. Predictably, this group also achieved the largest reduction in lease concession availability with a 53% decrease through the first eight months of the year. The net result was average effective rent appreciation of just under 11%.
The number of net units absorbed so far this year for this group of properties is second only to the 300+ unit properties, but on a percentage basis, this group has been the nexus of demand. It was only in the tertiary markets than less than two-thirds of available units were absorbed. Those smallest markets finished August with about 40% of vacant units absorbed in the period. Continuing the trend of positive correlation between property size and rent growth, this group of properties achieved double-digit rent growth across all four market tiers, from the largest primary markets through the smallest tertiary markets.
The story was a bit different on the price class side. Rent growth was robust in the top two price classes – each with a gain in excess of 13%. Class C growth was also the strongest of the three groups covered so far at 9%, while the 4% Class D gain was more in line with the smaller properties. Here too, all four price classes saw a decrease in discount availability. However, the bottom two price classes experienced an uptick in the average discount value, led by a 15% increase in the Class D space to a little more than three weeks off an annual lease. This was the largest gain for any price class in any of the four property size groups through August.

Properties With 300 or More Units
This last grouping of the largest properties in the data set has a little more than 11,000 properties and about 4.8 million units across the country. 194,000 net absorbed units through August marked the most absorbed units of any group and this demand represented 59% of available units – second-most of the four segments. Average occupancy gain among the unit size groups was the largest at 2.4%, to end August at 93%. These properties also saw the largest rent gain with average effective rent jumping more than 11% in the period. As with the other three groups, lease concession availably has come down this year as well, to the tune of a 50% reduction.
This subset of properties had the widest spread in demand across markets of differing size. In the primary and secondary markets, no less than about 57% of vacant units were absorbed. But in the tertiary markets, only 5% of available units were leased in the period. In these markets, average occupancy fell by more than 6% to close August at 87%. One reason for the lackluster performance in those smallest markets could have been the aggressiveness of operators in capturing rent increases. Effective rent growth topped 11% in all four market tiers, led by a 13.5% increase for the smallest markets.
Apartment demand was weakest in the Class D space for this group, but there was a particular drop-off between the top two price classes and the bottom two. About three-quarters of vacant units were absorbed in the Class A and Class B subsets, while Class C and Class D clocked in at 43% and 30% respectively. On the rent front, the top three price tiers added at least 10% to average effective rent while the bottom tier gained 5% through August. These large properties came closest to managing decreases in both availability and average value of lease concessions across the four price classes, but a 2% increase in the average discount value for Class D properties got in the way.

Takeaways
Larger properties have accounted for stronger demand and rent growth so far in 2021 compared to smaller properties. Part of the explanation for the difference is an over-representation of larger properties, those with 200 or more units, among the Class A and Class B subsets. The top two price tiers have been leaders in both net absorption and rent growth this year, and larger properties have a greater share of units within those two price tiers.
This over-representation is not the whole story though. Larger properties also outperformed smaller properties in secondary and tertiary markets, as well as in the lower price classes. Among the possible explanations are higher rates of professional management, more widespread RMS use, economy of scale advantages both at the property and management company level, a wider range of amenity options, the tendency for newer properties to be larger, and other features that could drive these positive results.
One aspect that should not be overlooked in the results across these four groups of properties is that these results are another data point reflecting the broad base of the apartment rebound. The smallest properties have gained more than 5% in average net rent and that figure jumps to 9% for properties with 100 to 199 units. The largest properties have performed best, but they are not the sole drivers of the rebound.
The best data for your budgets

Disclaimer: All content and information within this article is for informational purposes only. ALN Apartment Data makes no representation as to the accuracy or completeness of any information in this or any other article posted on this site or found by following any link on this site. The owner will not be held liable for any losses, injuries, or damages from the display or use of this information. All content and information in this article may be shared provided a link to the article or website is included in the shared content.

