*A previous version of this article mistakenly included total pipeline units in some of the units under construction content. All errors have been corrected and we apologize for the mistake. Thank you for reading!
Although depressed demand and runaway rent growth have rightfully continued to garner much attention in the multifamily sector this year, new supply has impacted industry performance as well. Almost 215,000 new units delivered through August was the second-most for that portion of the calendar in the last five years but represented an almost 15% decline from last year’s approximately 245,000 new units in the same period.
This slowdown in new supply relative to last year has been timely in some ways given the apartment demand picture, but the difference in scale between lower new supply and lower demand has been considerable. A decline in new supply of close to 15% through August will only be perceptible to a certain degree in the face of an 80% decline in net absorbed units compared to last year and a 65% shortfall relative even to pre-pandemic 2019.
It is also valuable to keep in mind that Class A net absorption has been the most resilient of the price classes this year compared to the recent past. As a result, in most markets new units have not been introduced into as dire a situation as would perhaps be assumed if just looking at market-level absorption data.
In recent blog posts and previous ALN newsletters, some of the bigger picture aspects of current industry dynamics have been addressed. For this month’s newsletter, a more granular market-level view will be the focus.
New Units Delivered
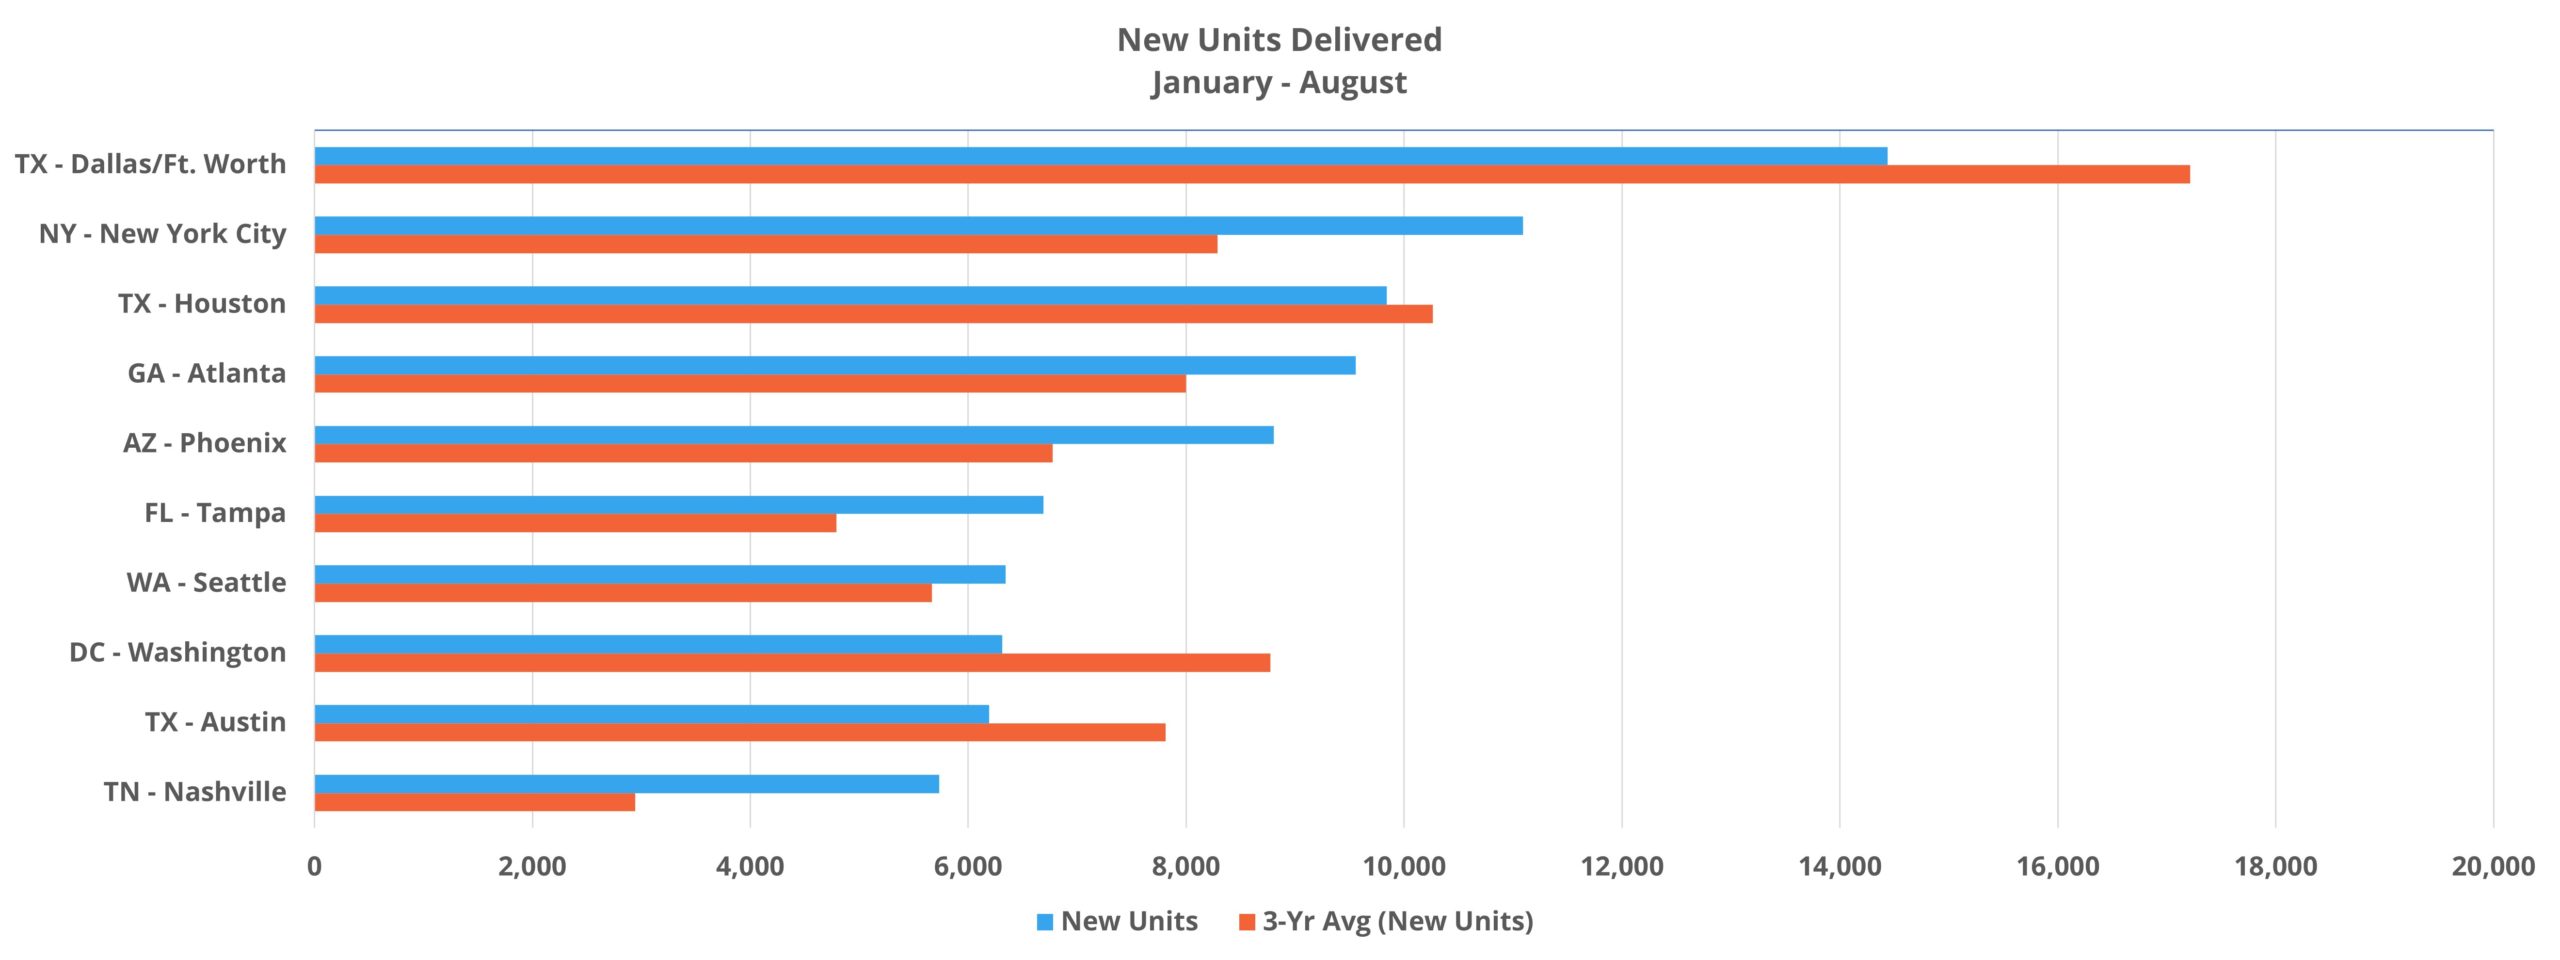
As usual, both Dallas – Fort Worth and Houston appear near the top of the list for most active markets so far this year in new deliveries. DFW led the way with nearly 15,000 new units introduced and Houston’s approximately 9,900 new units were good enough for third-most in the period. New York, with just more than 11,000 new units was in between the two Texas markets.
View the full monthly Markets Stats PDF
Below the large markets that typically reside at the top of the list, a handful of growth markets in need of new supply to take some pressure off of rent growth also found themselves in the top 10. Phoenix, Tampa, Seattle, Austin, and Nashville were all in the top 10 markets for new units delivered through August with about 5,700 new units in Nashville bringing up the rear. Not far behind were areas like Denver – Colorado Springs, Orlando, Raleigh – Durham, and Miami which have also been high-growth areas near the tip of the spear for rent growth over the last two years.
One other metric that can be useful when evaluating new supply is new units in the period relative to recent history. To do this, a three-year average is calculated for each market’s new supply from January through August of 2019, 2020, and 2021 and then this year’s new units are expressed as a percent of that three-year average.
A lot of tertiary markets populate the top of the resulting rankings due to their very low three-year average for deliveries. Areas like Fargo, ND, Lincoln, NE, and Evansville, IN are among the top five markets most outpacing their three-year average this year despite new units being measured in the hundreds rather than the thousands.
The smaller numbers involved and the generally greater variance from year-to-year found in tertiary markets make it unsurprising to find so many small markets near the top of this particular list. Even so, somewhat larger markets like Pittsburgh, Gainesville, St. Louis, and Nashville managed to crack the top 20.
Under Construction
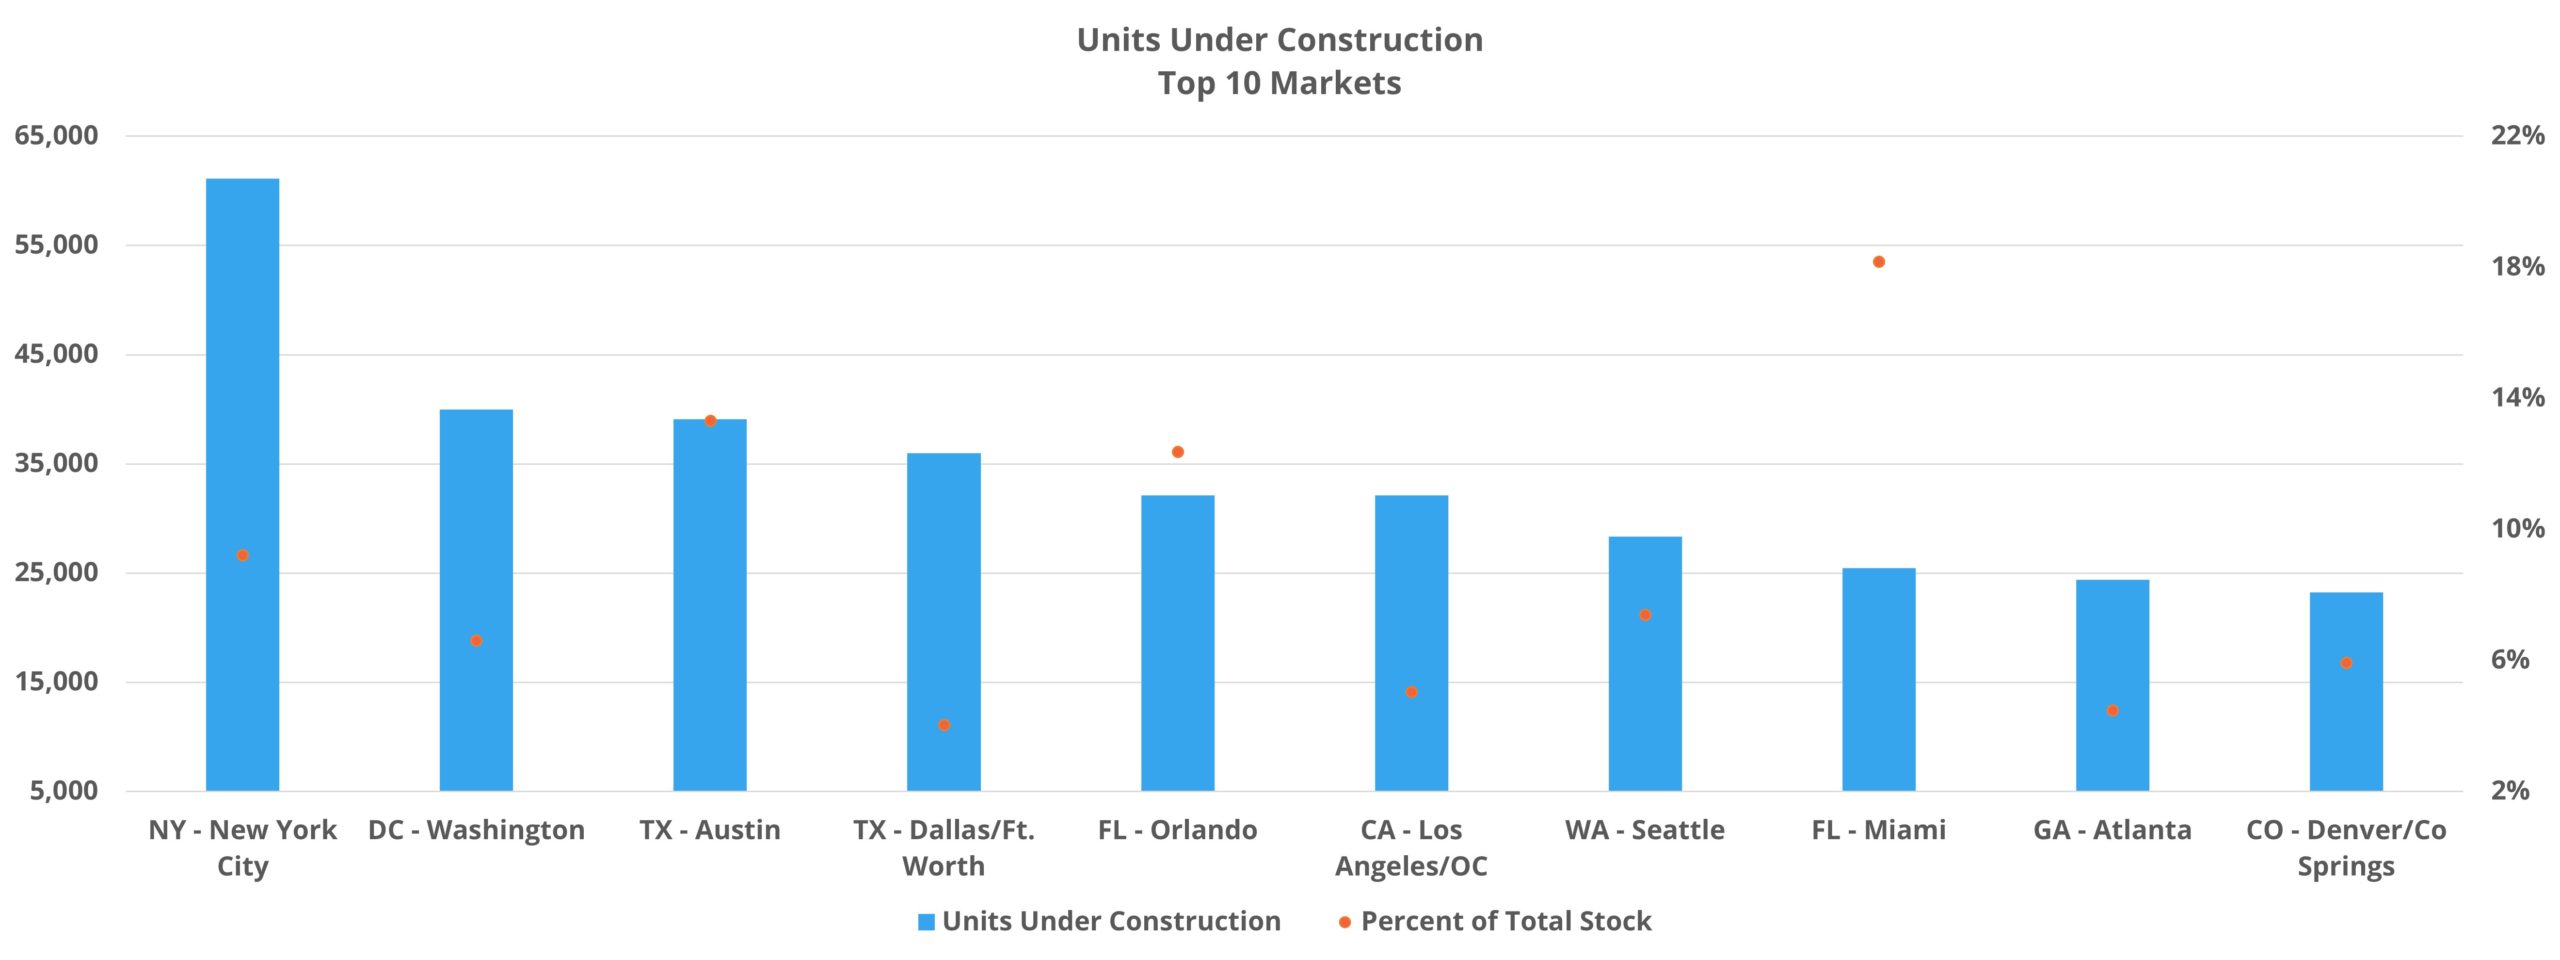
Projects in this stage of the construction pipeline have already broken ground but have not yet begun to lease. Of the more than 800,000 multifamily units being tracked by ALN in this phase of the pipeline, no individual market came close to New York’s approximately 62,000 units. Second-most was Washington DC with a distant 40,000 units under construction.
Typically, DFW, Los Angeles – Orange County, and maybe Atlanta would round out the top five. Those markets did finish August in the top ten for units under construction. However, it was Austin and Orlando that closed out the top five this year with about 39,000 and 32,000 units respectively. As two markets that have typified both the good and the bad of explosive growth, it is a positive development to see them so high up the list.
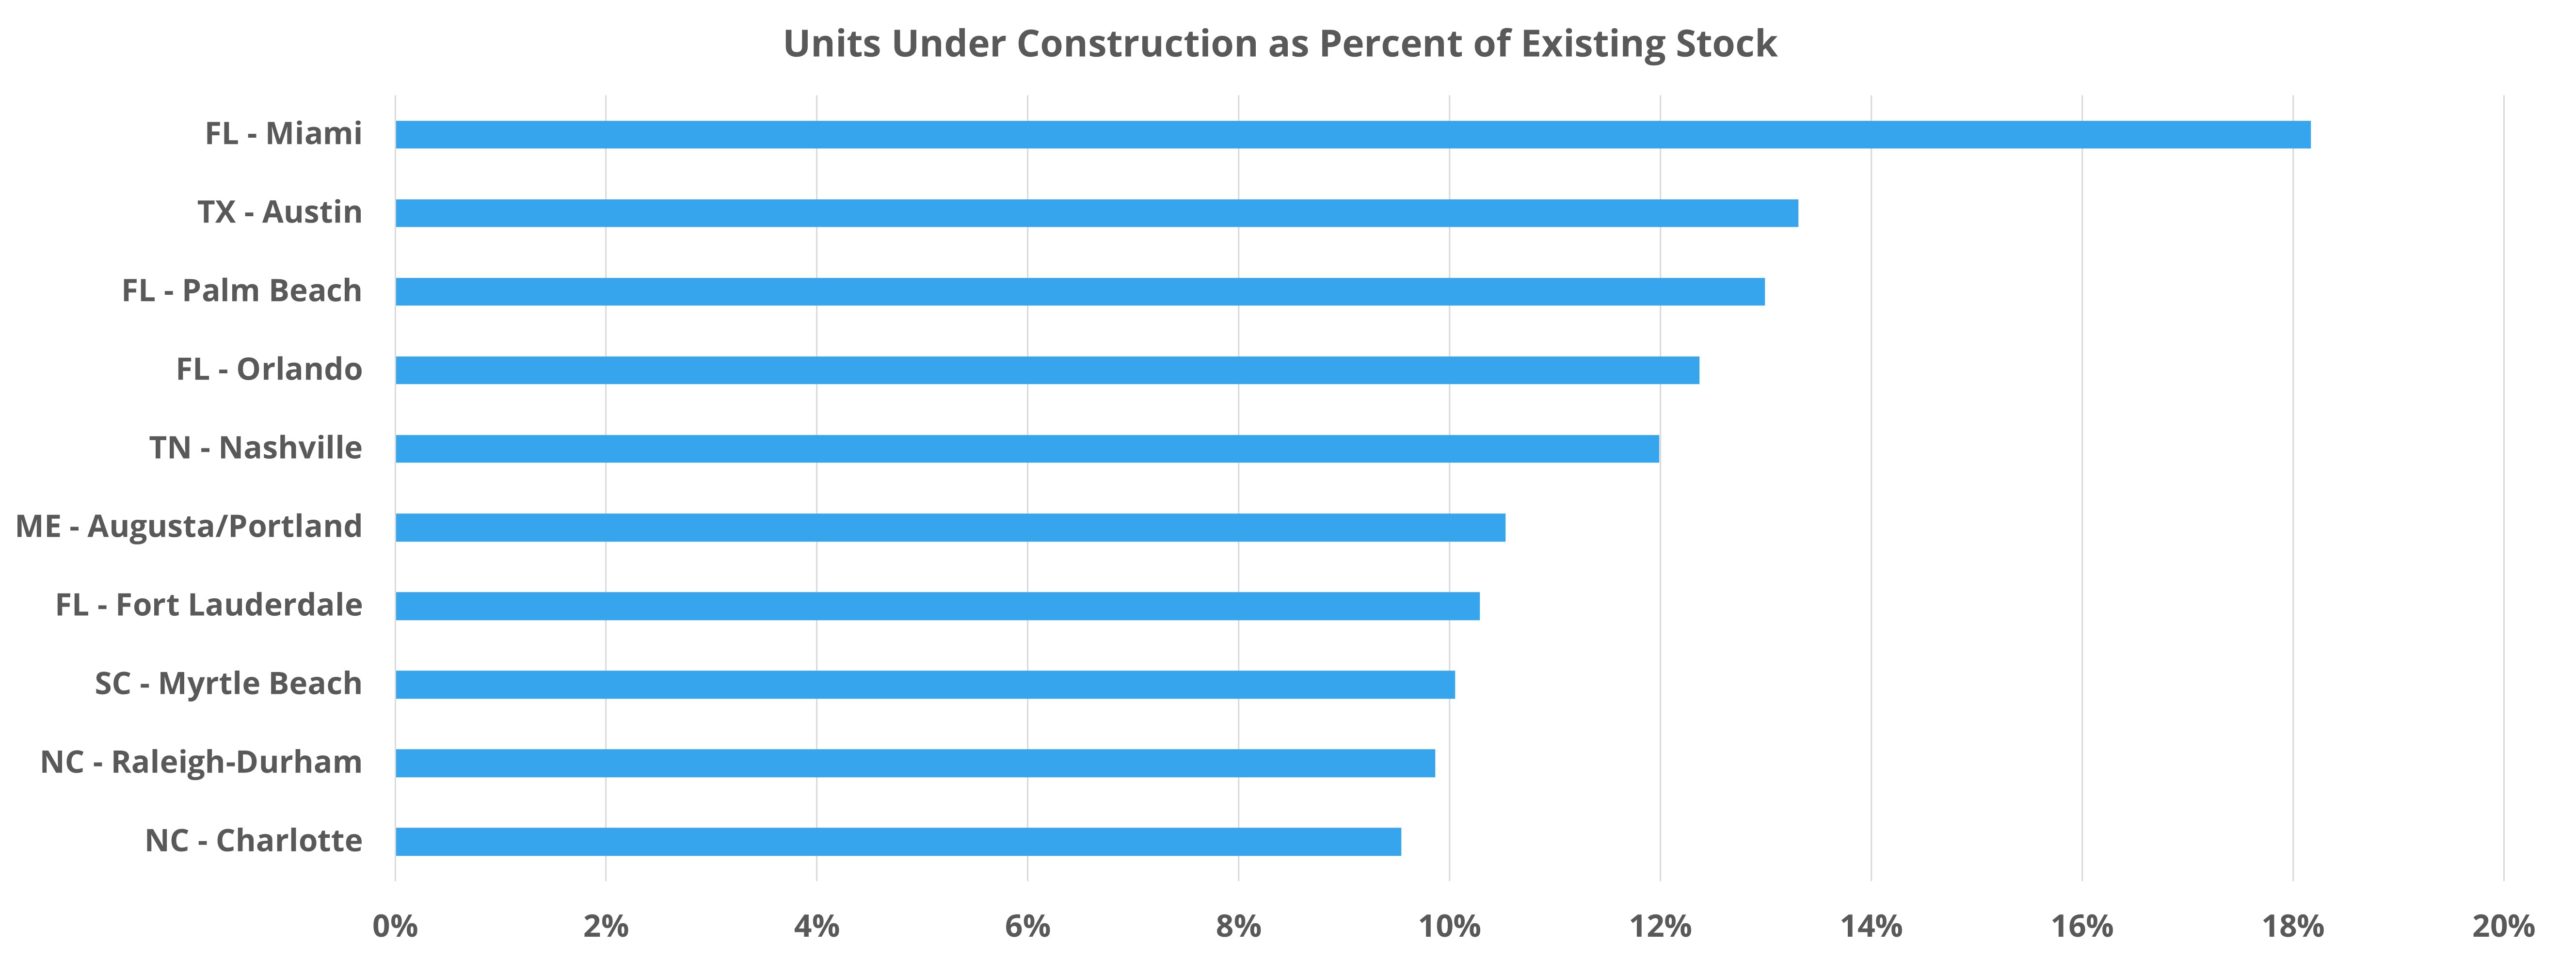
As mentioned in the previous section, it is often useful to incorporate a percent-based evaluation metric to gain a fuller picture. In the case of units under construction, taking those units as a share of existing multifamily stock in the market provides helpful context.
Smaller markets from a multifamily perspective lead off the rankings with Miami, Austin, and Palm Beach constituting the top three. Units currently under construction in Miami represent 18% of that market’s pre-existing multifamily supply. Once again, it is no surprise that all three of these markets could be characterized as high-growth areas in recent years.
All-New ALN OnLine
ALN OnLine is being completely redesigned and rebuilt for simplicity, speed, and even greater depth. We’ve also been redesigning our existing reports to better represent our data and brand identity, and more importantly, bring even more value to our clients. Find out more about what’s inside the newest version of our flagship platform built for owner/operators, brokers, appraisers, lenders, governments agencies, and more.
After those three areas, markets like Orlando, Nashville, and Raleigh-Durham appear – each with units under construction accounting for 10% or more of existing stock. On the other end of the spectrum, large markets such as Detroit, Baltimore, and Huston ended the period with the share of units under construction relative to market capacity at 3% or less.
It is important to keep in mind that although the percentages mentioned for all of these markets are each well above those that would be based on recent deliveries as a percent of market supply, these under construction units will not all be delivered within the next twelve months. As discussed in a blog post from this summer, for new properties that began leasing in the first half of 2022, the average time from construction start to lease start was approximately 19 months.
Takeaways
Despite continued challenges affecting new multifamily supply ranging from supply chain issues, labor shortages, and the rising cost of capital, new deliveries through the first eight months of 2022 have been higher than in any recent year except for 2021. The shortfall in apartment demand has not yet been enough to even put a dent in last year’s run-up in multifamily average occupancy. This has allowed rent growth momentum to carry further into this year than apartment demand would predicate.
Specifically regarding recent new supply, the markets that have led the way this year correspond fairly closely with those markets that have been net beneficiaries of population migration in recent years. More of the same on that front would be helpful in regaining some equilibrium in those markets. With some exceptions – Tampa being an obvious one – the volume of units under construction in these growth markets provides an indication that this will be the case over the next 24 months.
It will be especially important moving forward to pay attention not only to which markets have the most upcoming new units, but how the demographic profiles of the markets are evolving and to what extent new supply addresses housing demand in those markets.
Disclaimer: All content and information within this article is for informational purposes only. ALN Apartment Data makes no representation as to the accuracy or completeness of any information in this or any other article posted on this site or found by following any link on this site. The owner will not be held liable for any losses, injuries, or damages from the display or use of this information. All content and information in this article may be shared provided a link to the article or website is included in the shared content.


