

Latest Growth Cycle Beginning to Wind Down
The multifamily new construction pipeline has rightfully gotten much attention in recent years. The level of new supply the industry has seen over the last few years has been nearly unprecedented, and like nothing seen in almost a half-century. At ALN, we have been closely following developments in the pipeline itself as well as the effect of new supply on other industry performance metrics going all the way back to the beginning of the current glut.
One perspective not yet covered has been the construction pipeline at points in time throughout the last handful of years. Such a view provides not only a look at the changes in size of the overall pipeline but also a window into the progression of projects through the pipeline. These considerations may provide some insights for the current pipeline that will impact the industry over the next few years.
In order to do this, the national new construction pipeline will be evaluated in two-year intervals beginning with the start of 2018. The evaluation periods will then be 2018-2019, 2020-2021, and 2022-2023. To begin each two-year interval, only planned projects will be included. Planned projects are those that have yet to break ground but are expected to break ground within two years. At the end of the two-year period, a snapshot of the pipeline will reflect which phase of the pipeline those planned projects have progressed to.
View the full monthly Markets Stats PDF
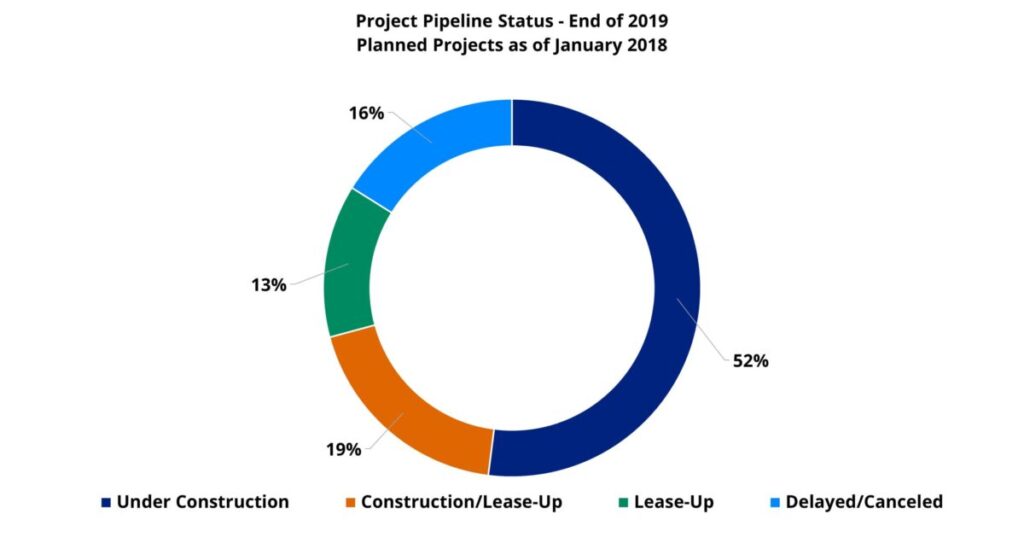
2018 and 2019
To begin 2018, ALN was tracking just under 1,200 planned projects nationally. By the end of 2019, 620 of the projects were under construction. Another 224 had already progressed to a construction/lease-up phase, and 156 were in a full lease up. For properties that began leasing in 2019, the average time from a construction start to a lease start nationally was fourteen months. That about one-third of planned projects at the start of 2018 had begun leasing by the end of 2019 fits well with that average construction duration.
There were nearly 200 properties that began the period in a planning phase and had dropped out of the dataset by the end of the period. These projects were either outright canceled or put on hold to the point that an estimated construction start date was unavailable or not within two years of the period end date. As a reminder, the pipeline phase for planned projects includes only those that are expected to break ground within two years.
The projects that had dropped out of the dataset by the end of the period equaled 16% of the total projects being tracked to start 2018. This metric, and its change over time, can provide a baseline for setting expectations regarding a conversion rate of planned projects to those brought to market for the current pipeline.
2020 and 2021
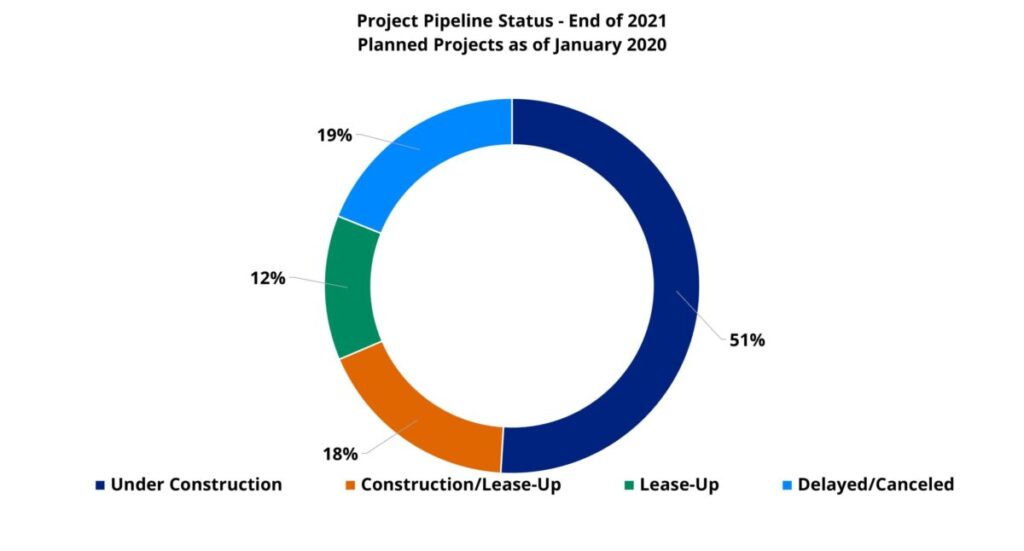
At the start of 2020, ALN was tracking approximately 1,250 planned projects nationally. This represented only a 4% increase in the number of planned projects from the beginning of 2018. By the end of 2021, 633 projects were under construction but not yet leasing. Another 219 properties were completing construction but already leasing and 155 projects were in a full lease-up phase. 30% of planned projects to begin the biennial period had started leasing by the end of that time – a slightly lower share than in the previous two-year period.
About 235 projects that were in the planned phase of the pipeline to start 2020 were no longer in the pipeline dataset by the end of 2021. These cancelled or significantly delayed projects accounted for almost 20% of total projects to begin the period compared to approximately 16% of projects in the same situation for the 2018 and 2019 evaluation period.
2022 and 2023
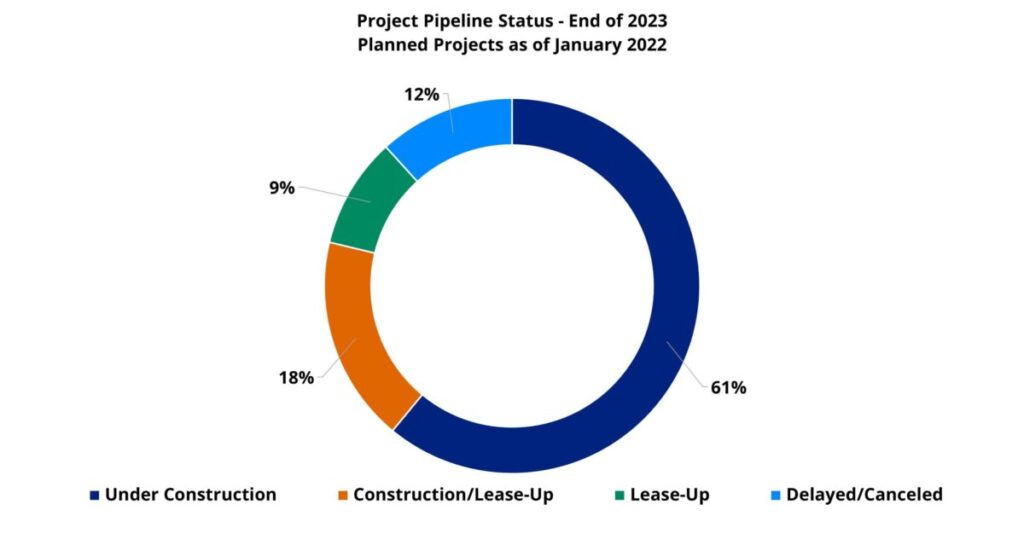
By the start of 2022 , there were almost 2,300 planned projects being tracked by ALN around the country. This marked a dramatic 84% increase in the number of planned projects compared to the start of 2020. At the close of 2023, just less than 1,400 projects were under construction but not yet leasing. A little more than 400 properties were finishing construction but already leasing. Roughly 220 additional properties were in a full lease-up with construction having been completed.
By the end of 2023, only about 27% of projects had started leasing. This continued the downward trend in this metric and reflected the growth in average construction duration that occurred in recent years. The average construction duration for projects that began leasing in 2023 was around eighteen months compared to the average of fourteen months from 2019.
Twelve percent of projects fell out of the dataset from the start of 2022 to the end of 2023. The total number of projects cancelled or considerably delayed was higher than in either of the previous two-year periods at about 270. Because the number of planned projects was so much higher, however, the percentage was quite a bit lower than in the previous periods.
It is important to remember that for most of 2022 average occupancy remained unusually high thanks to the explosion of demand in 2021 that sent net absorbed units far beyond new units delivered. This leftover average occupancy cushion allowed average effective rent growth in 2022 to exceed 8% for new leases despite lackluster demand. While 2022 net absorption and upcoming supply portended trouble, average occupancy and rent growth helped to paper over those warning signs. The result was full steam ahead for planned projects.
Current Construction Pipeline
To start 2024, there were 12,353 planned projects being tracked nationally by ALN. Obviously, this was a huge number, but some caveats are relevant. For full two-year evaluation periods, projects that are postponed or canceled have the full two years to be resolved in the data. For the pipeline at the start of 2024, thousands of these projects will be pushed back beyond the two-year cutoff to be included as planned projects in ALN’s pipeline data, but those delays have not yet officially occurred.
Despite these limitations, there is a clear bottleneck in the pre-construction pipeline. Some of the projects that have been delayed in previous years have gone on to break ground or have been outright canceled, but many others remain in a limbo of incremental delays. Specifically, the bottleneck includes nearly 9,400 planned projects with estimated construction start dates from August through December of this year. For these projects, as their anticipated start date approaches, ALN will be able to gather further updates on their pending start status. For the vast majority, they will likely be pushed into next year or beyond.
In terms of what is known now, about 130 projects that were in a planned phase to start the year have already dropped out of the two-year pipeline. The fact that nearly half of the previous two-year period’s total number of significantly delayed and canceled projects have occurred in just the first seven months of 2024 indicates the extent to which the development environment has changed. Nearly 700 projects that began the year in a planned phase had already broken ground by the start of August. It is these projects that will make up the bulk of shorter-term new supply.
Takeaways
The new construction pipeline has been active to a level not seen in decades in recent years. New national deliveries will remain elevated in 2024 and 2025, but there are early signs that 2026 will feature a much-needed drawdown.
Much remains to be settled in the 2024 data, but major delays and cancellations appear to be increasing significantly. Projects that have already broken ground will provide the new supply for the rest of this year and next year, and so, high supply has already been baked in for the short term. Longer-term, the beginning of a considerable decline in new supply appears to be playing out.
Why choose ALN for Budget Season?
Our flagship platform’s roots go back to 1996 when we were among the first research firms to digitally provide data in the multifamily industry. Since then, we’ve helped countless multifamily professionals transform their budget season from a daunting task to an opportunity for growth and optimization.
Disclaimer: All content and information within this article is for informational purposes only. ALN Apartment Data makes no representation as to the accuracy or completeness of any information in this or any other article posted on this site or found by following any link on this site. The owner will not be held liable for any losses, injuries, or damages from the display or use of this information. All content and information in this article may be shared provided a link to the article or website is included in the shared content.