Despite Challenges, 2021 Deliveries Already Well Beyond Recent Years
With 2021 coming to a close, and with apartment demand and rent growth rightly garnering a lion’s share of the attention, it is time to check in one last time this year on the new construction pipeline. Despite supply chain challenges and labor shortages, more new units were delivered through November of this year than in any recent complete year – and by a sizable margin. Nationally, about 325,000 new units were delivered through eleven months of 2021. 2020 was the only other year of the last five with more than 300,000 new units brought to market with just more than 305,000 units, and again, 2021 still has December numbers to be added to the annual total.
View the full monthly Markets Stats PDF
With all of this in mind, let’s have a look at markets with high levels of new supply delivered in 2021 and then some markets high levels of upcoming deliveries.
New Units Delivered
Unsurprisingly, multiple Texas markets were in the top five at the end of November for most new units delivered this year. Dallas – Fort Worth led the way with just over 25,000 new units. Houston placed third with more than 15,000 new units and Austin fourth with just more than 12,000 new units delivered. New York, with around 18,000 units delivered, and Washington DC with just under 12,000 new units rounded out the top five. All told, seven markets have already added 10,000 new units or more this year with one month to go for the annual numbers. Two areas that were close by the end of November were Seattle and Denver – Colorado Springs.

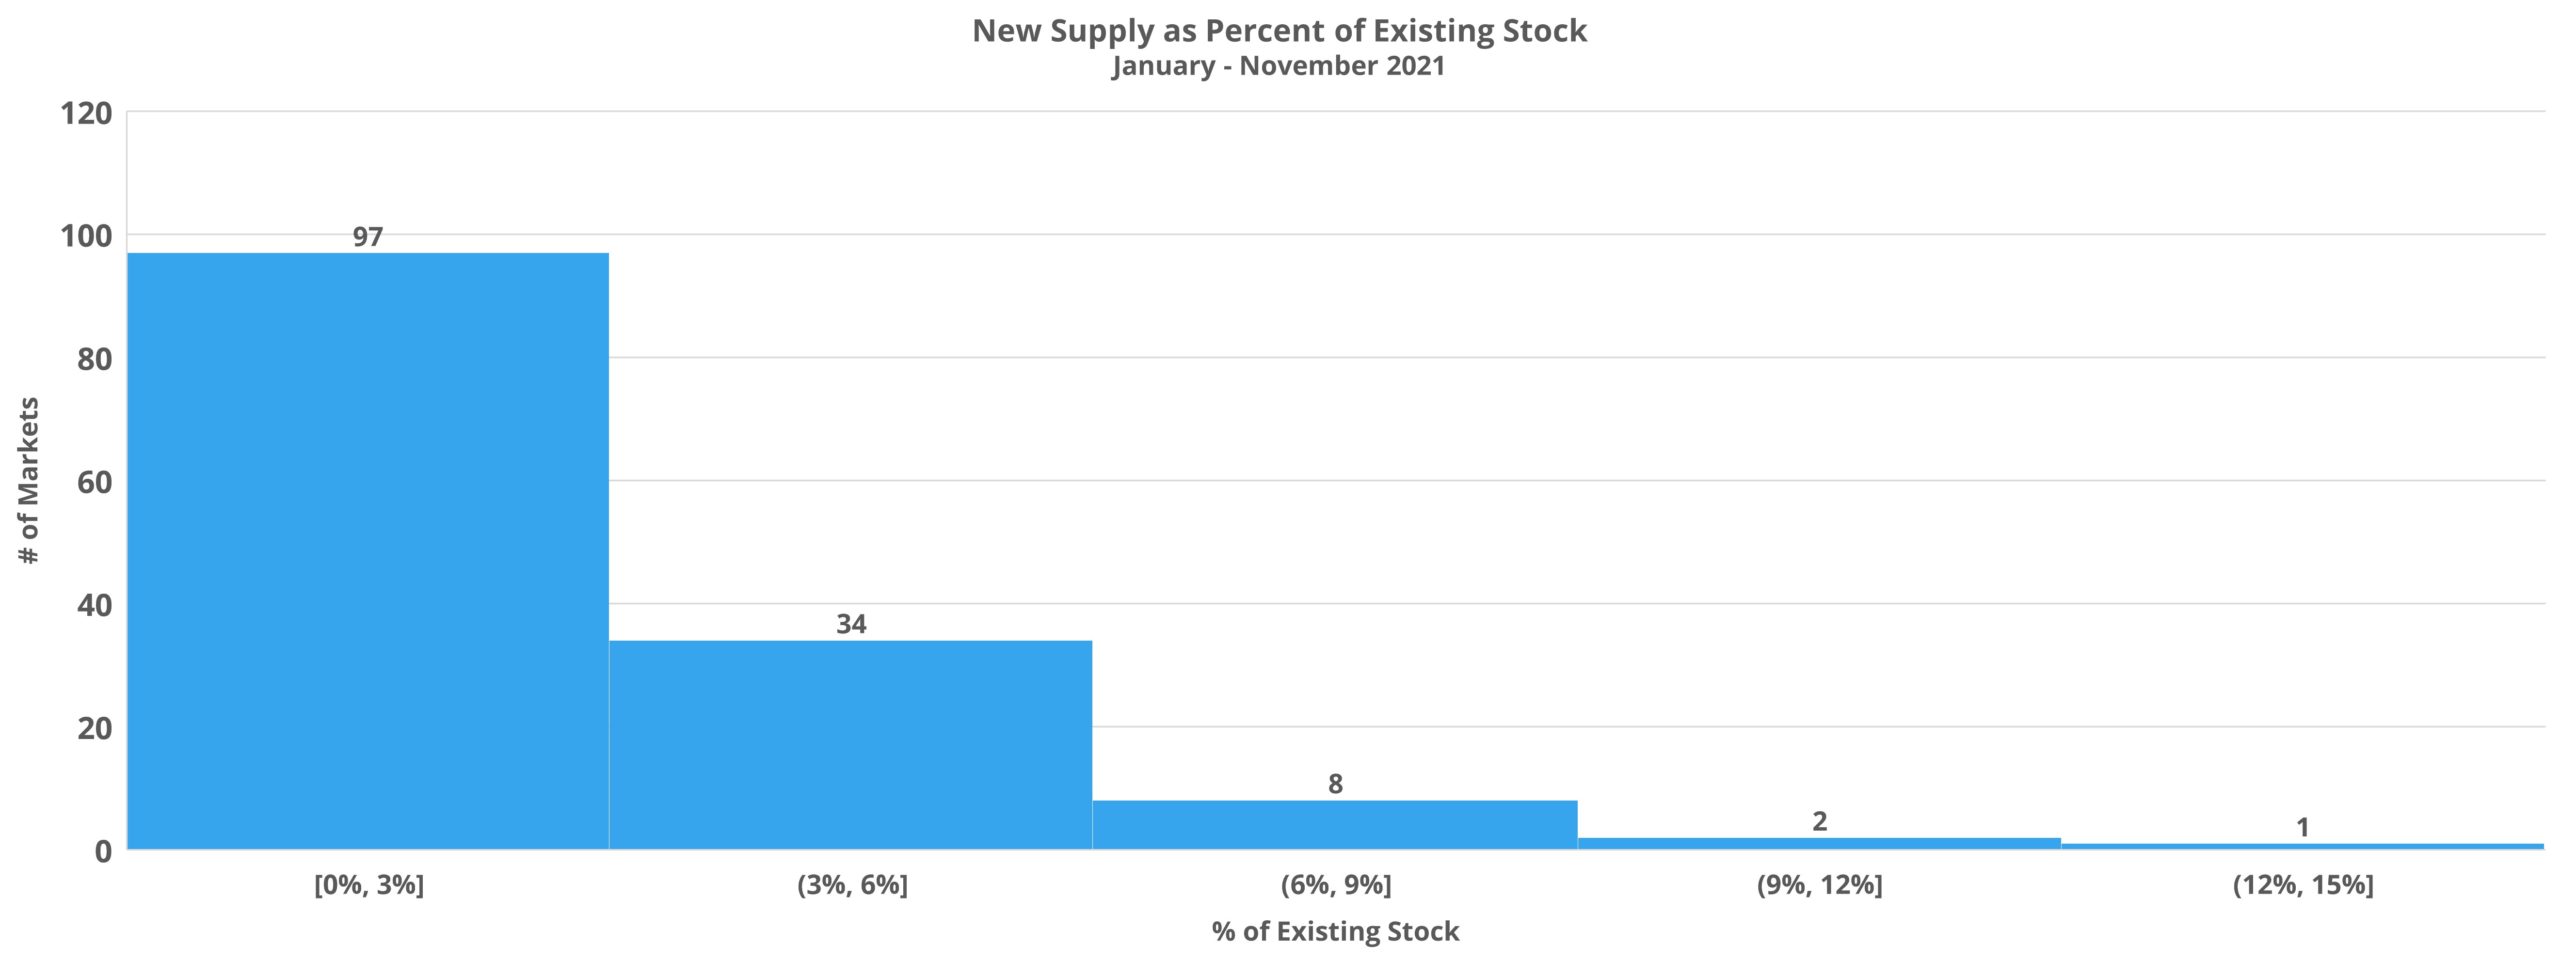
Of course, large markets will always appear at the top of the list for new supply, but there are also smaller markets with a relatively high rate of construction activity. Taking recently delivered units as a percent of existing stock brings a different set of markets to the forefront.
Rapid City, SD and Honolulu, HI have each added at least 10% of existing stock in new supply this year – 15% and 10% respectively. More than 2,000 new units in Midland – Odessa, TX represented a little more than 9% of existing units, and the South Carolina markets of Charleston and Greenville – Spartanburg each saw new supply equal to around 8% of existing stock.
Boise must be mentioned here too as a market at the epicenter of population growth in the nation. About 1,900 new units represented 9% of existing capacity. Expanding the results to the top 15 markets on a percentage basis includes areas such as Pensacola and Fort Myers – Naples in Florida, Myrtle Beach, SC and larger markets like Austin and Miami.

In our series Takeaways, ALN Apartment Data Senior Market Analyst, Jordan Brooks, shares more insight into the final thoughts on the April 2024 newsletter article…
Under Construction
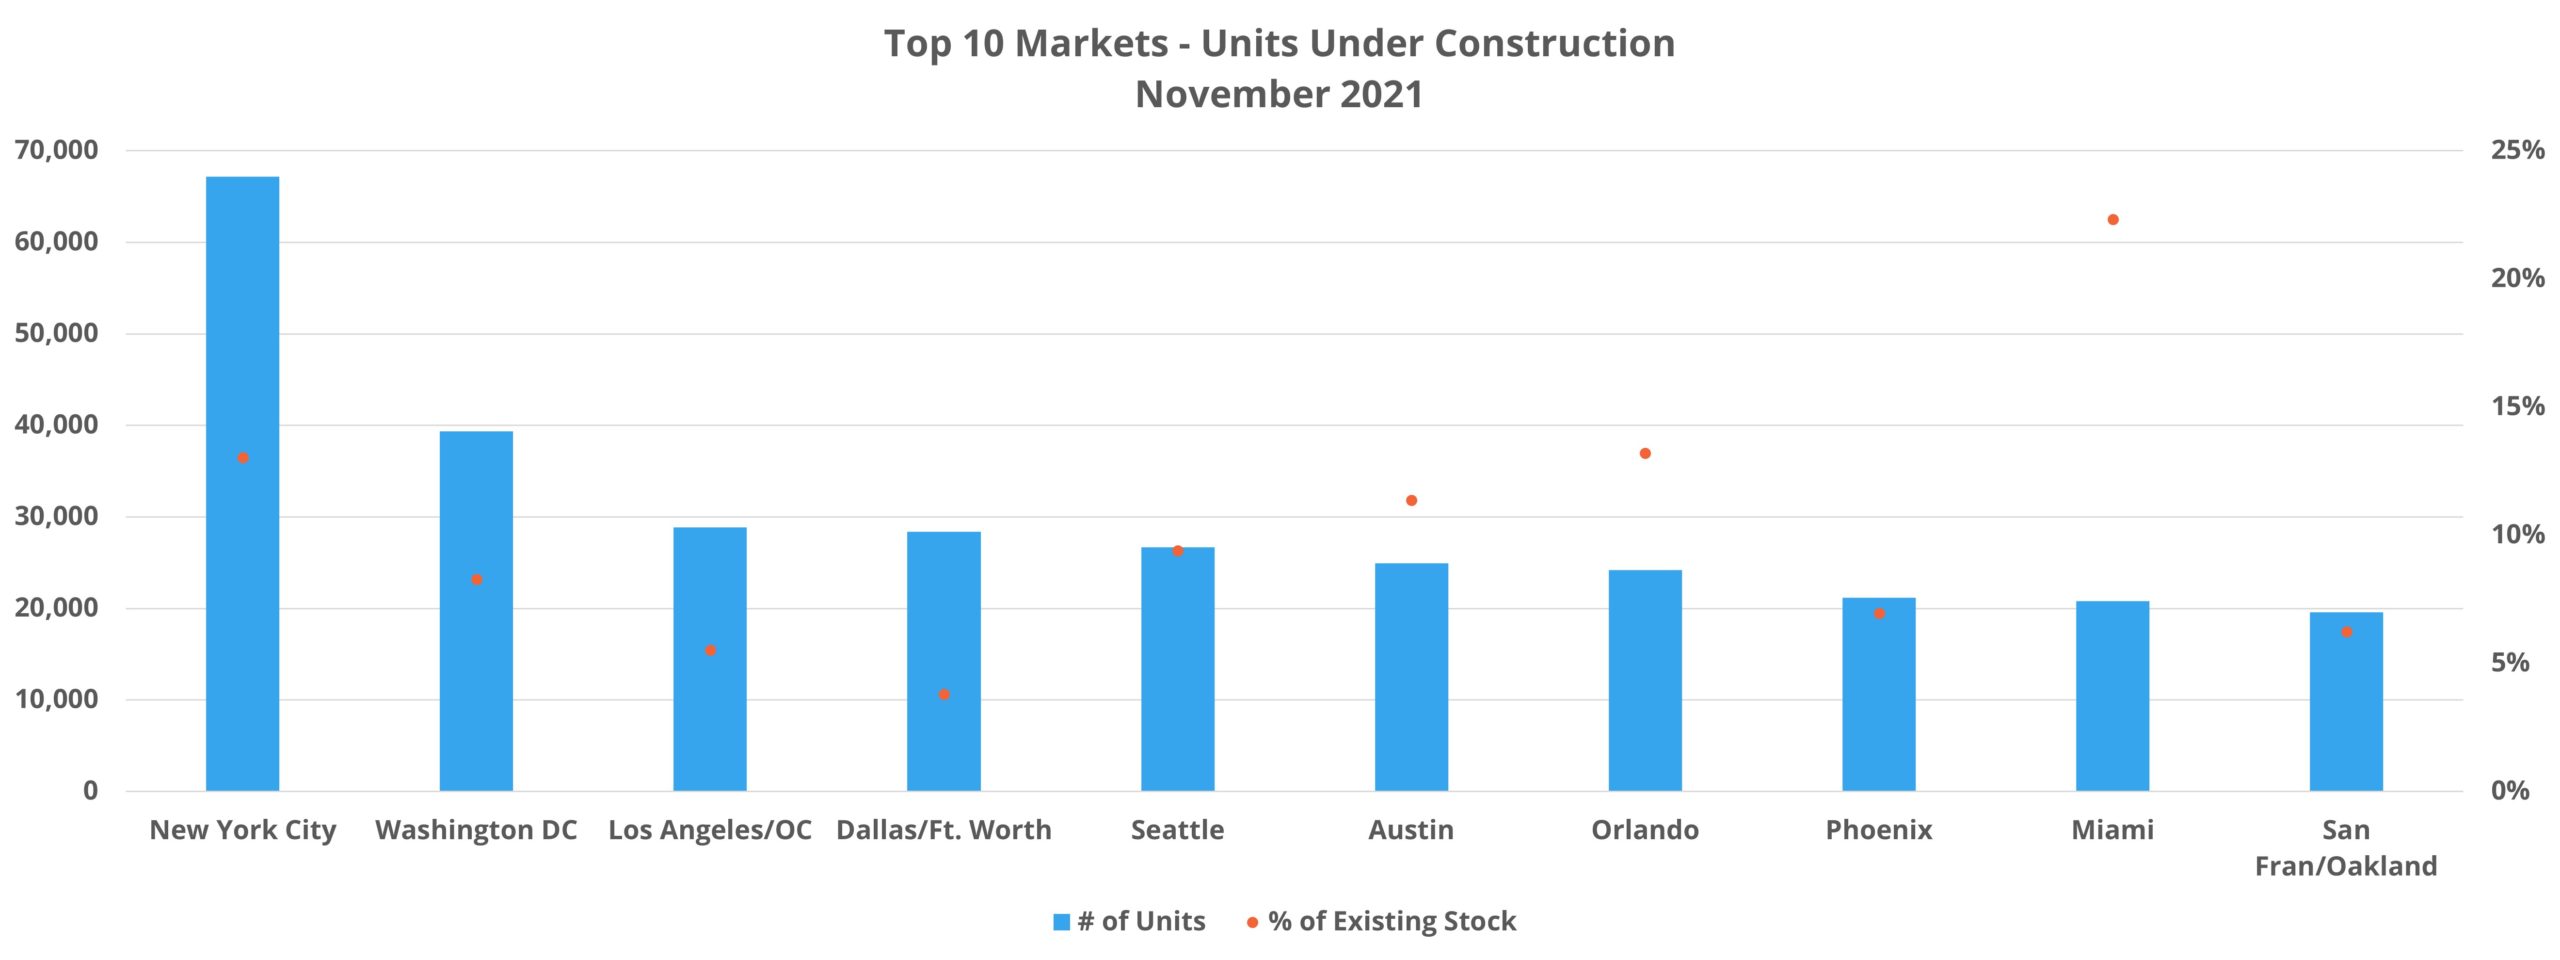
Projects in this stage of the construction pipeline have already broken ground but have not yet begun to lease. Of the nearly 700,000 multifamily units in this phase of the pipeline, no individual market has more than New York’s approximately 67,000 units.
No other area came close to New York in terms of units under construction, as the market with the second-most was Washington DC with about 40,000 units. Los Angeles – Orange County, Dallas – Fort Worth and Seattle rounded out the top five – each with between 24,000 and 28,000 units currently being built. Growth markets populated the back half of the top 10 with areas like Austin, Orlando, Miami, and Phoenix all with at least 20,000 units under construction.

While New York leads the way among US markets in terms of units under construction, evaluating on a percentage basis brings other markets into focus as well. Miami, already mentioned as a market within the top 10 for units under construction, led the nation at the end of November with these units representing more than 20% of existing stock.
1,400 units in Augusta – Portland, ME also totaled just over 20% of existing market capacity there. Concord, NH, Myrtle Beach, SC, Huntsville, AL, and Boise, ID each had at least 15% of existing market supply in the pipeline as units under construction. In all, 15 markets had 10% or more of existing stock in this pipeline category at the close of November.
It is important to keep in mind that although the percentages mentioned for these markets are each well above those based on recently delivered units, these under construction units will not all be delivered within the next twelve months. As covered in a recent blog post, for new properties that began leasing in 2021, the average time from construction start to lease start was approximately 16 months. This metric has been on an upward trajectory for the last handful of years, and that trajectory appears unlikely to reverse in the near term.
Takeaways
Despite a host of challenges impacting new multifamily supply, 2021 saw more new units delivered through November than in any recent full year. Historic demand has fueled unheard-of rent growth in markets around the country and was more than enough to offset a fairly dramatic increase in supply. In fact, despite well over 300,000 new units entering the market, average occupancy through November has risen 2.5% nationally to 94%.
The most active markets, both in terms of recent new supply and upcoming deliveries, correspond reasonably to the regions experiencing the strongest population growth. The obvious outliers there would be Los Angeles and New York, the two metros to suffer the largest population losses in 2020 according to data from the Census Bureau.
Aside from those, markets across Florida, Texas, the Mountain West, and the Lower Atlantic have generally displayed the level of development activity that would be expected for growing regions. A notable exception is Tampa, a metro that ranked seventh in population growth in 2020. While it is a growth market within a growth state, it barely cracked the top 20 in terms of new units through November of this year. The result was nation-leading rent growth among large markets at almost 30%.
It will be especially important moving forward to pay attention not only to which markets have the most upcoming new units, but how the demographic profiles of the markets are evolving. COVID-19 strengthened some trends that were already in place: rising demand in suburbs, secondary cities near major hubs, and population growth across the Mountain West and South.
High construction volume in growth markets like Boise, Dallas Fort – Worth or those across Florida will impact those markets quite differently than in expensive urban markets like the New York metro area or the California Bay Area that have experienced pronounced population loss.
Search, Analyze & Compare
ALN OnLine is a web portal that allows our clients to search properties, access submarket and markets trends, new construction, and more. Since 1991, we have continued to refine our business practices and methodology in order to offer our clients the absolute best in multifamily data.


Disclaimer: All content and information within this article is for informational purposes only. ALN Apartment Data makes no representation as to the accuracy or completeness of any information in this or any other article posted on this site or found by following any link on this site. The owner will not be held liable for any losses, injuries, or damages from the display or use of this information. All content and information in this article may be shared provided a link to the article or website is included in the shared content.

