

Decoding Multifamily: Demand and Rent Correlations
The link between demand and rent growth shapes investment and management decisions in multifamily. Rolling correlation analysis, which tracks this relationship over a 12-month window, can reveal dynamic market shifts. Using data from July 2017 to July 2025, we analyzed national trends and four illustrative markets – Nashville, New York (NYC), Chicago, and Detroit.
Understanding Rolling Correlation Analysis
Correlation measures how two variables move together, ranging from -1 (opposite directions) to 1 (same direction). A rolling correlation uses a 12-month window to track changes over time, unlike static snapshots.
Apartment demand, as measured by net absorption, is generally expected to drive rent growth. Rolling correlation captures changes in this relationship, such as during the pandemic or the recent new supply surge, offering a dynamic view.
The analysis used monthly net absorption and effective rent change from July 2017 to July 2025, an eight-year period capturing pre-pandemic and volatile recent years.

Unlock the latest insights and rental market trends anywhere in the United States with ALN Online!
Nationally, correlations ranged from 0.131 to 0.921 during the analysis timeframe. This reflected both periods of strong demand-driven rent growth and unusual disconnect between absorption and rent performance.
Market-specific data for Nashville, NYC, Chicago, and Detroit revealed interesting nuances. These markets were chosen because they each represent a different supply and demand scenario during the analysis timeframe.
Each market had periods with negative correlations. These were indications of supply pressure or economic pressure. Intriguingly, resident price sensitivity was seemingly not as much a factor during periods of disjointedness between apartment demand and rent performance. More on that later.
National Trends
The national demand-to-rent relationship fluctuated significantly in recent years. From 2018 through 2019, correlations were robust (0.725–0.921). This reflected strong demand that was driving rent growth in a healthy pre-COVID market.
The economy was rolling, and the subsequent multifamily supply boom had not yet kicked in. An equilibrium between new supply and demand allowed strong occupancy to maintain rent growth momentum.
The pandemic shattered this status quo in 2020. Correlation between net absorption and average effective rent change decreased to 0.191 that year. This reading indicated only a weak positive relationship between net absorption and rent change. In other words, apartment demand was not equating to rent growth. However, this was due to a black swan event rather than underlying market fundamentals.
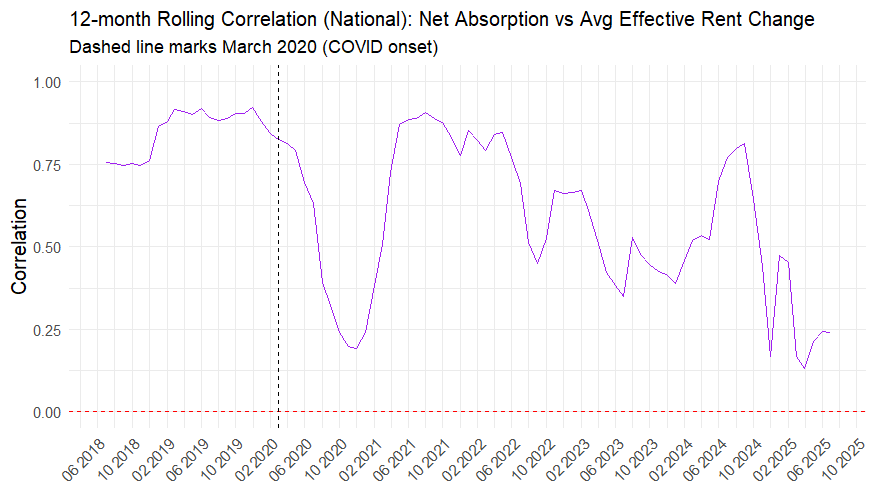
A 2021 demand surge, fueled partially by stimulus and unrealized demand from 2020, pushed correlation back to a peak of 0.907, with strong rent growth. During 2021, net absorption outpaced new supply by a wide margin. This drove occupancy to unusual heights and allowed demand to translate cleanly into rent growth at a level comparable to the pre-pandemic years.
By 2023, the impact of an imbalanced supply and demand environment had taken hold. Correlation fell to 0.416 that year, and by July 2025, it was down to 0.241. Annual national deliveries outpaced net absorbed units in 2022, 2023, and 2024. This is likely to be repeated in 2025 despite surprisingly strong demand this year.
Apartment demand has not been as impactful in driving rent growth in recent years due to supply pressure and economic factors. Rent growth is hard to come by when average occupancy is significantly below its normal range and lease concession availability is above its pandemic peak.
Economic factors have also played a role. The end to stimulus payments in 2022, runaway inflation, and the return of student loan payments have impacted the financial position of households relative to 2021. Higher interest rates and softer market conditions have also limited transaction volume over the last few years. This was another headwind to rent growth.
Regression Analysis
The correlation measure is symmetric. This means it describes the association between net absorption and effective rent change without inherently specifying which is the cause or effect. Although there were no negative correlation values in the national data, there were in the market data.
A negative correlation indicates that as one variable increases, the other tends to decrease, and vice versa. Therefore, a negative correlation means that as absorption increases, average effective rent change decreases. A negative correlation also implies that as average effective rent change increases, net absorption tends to decrease. The former would seem to be counterintuitive for multifamily. The latter is more straightforward and would indicate price sensitivity on the part of renters.
Regression analysis can add some clarity by revealing the direction of the relationship between the two variables. Regression analysis distinguishes whether negative correlations stem from supply pressure, economic factors, or price sensitivity by modeling directional relationships.
What this analysis showed was that in the national data, and for all four sample markets, positive rent growth predicted higher net absorption. This is an indication of a demand-driven environment rather than one in which rent growth applies downward pressure to apartment demand. This would be expected during a period in which much of the net absorption was happening within lease-up properties which tend to have higher rents.
If the negative correlation values at the market level were not due to price sensitivity, then the focus moves to supply and economic pressures. The specific culprit varied by market.
Market-Specific Insights
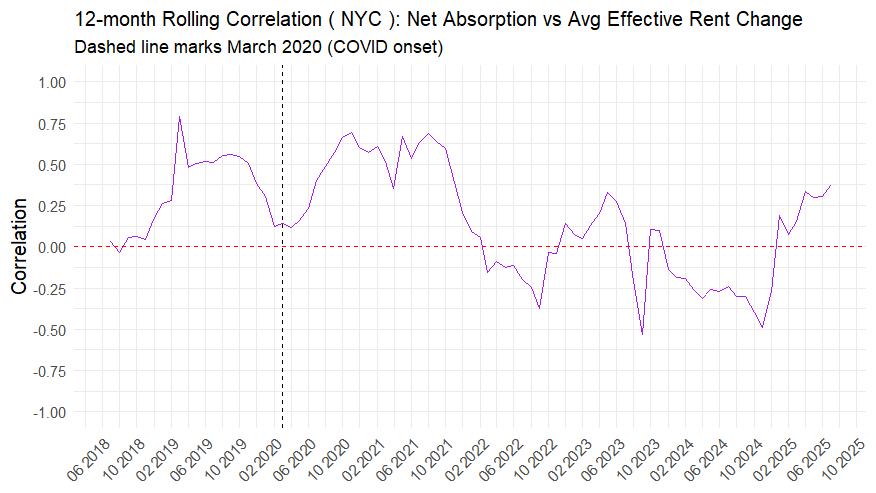
Granular analysis of Nashville, NYC, Chicago, and Detroit reveals diverse market forces. All showed negative correlations during portions of the analysis period. New York was the most pronounced with a minimum value of -0.533 and extended periods in negative territory in both 2022 and 2024.
New York was an example of a high supply and low demand market for this timeframe. Once adjusted for multifamily stock, New York had above-average new supply and below-average net absorption for the analysis period.
Negative correlations in much of 2022 reflect economic pressure such as out-migration and the prolonged pandemic shutdown in that market. The negative correlations in 2024 suggest supply pressure. Periods of robust absorption corresponded with slowing rent growth – a hallmark of the recent supply peak.
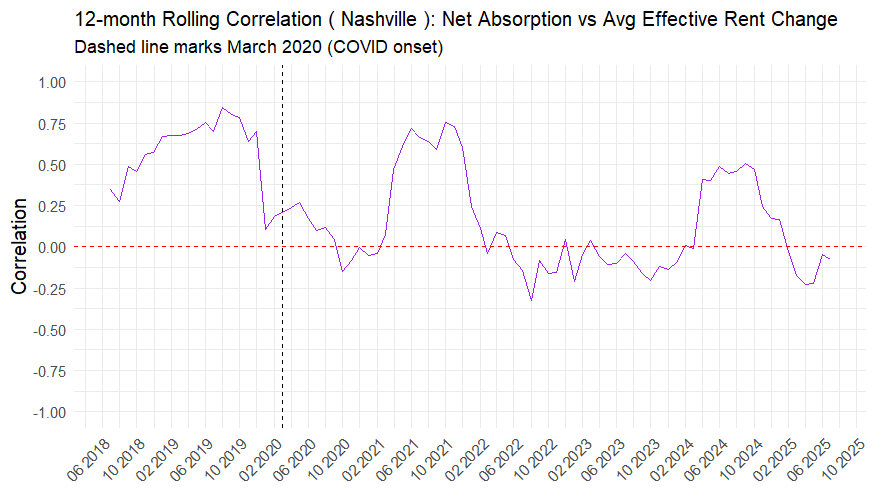
Nashville was an example of a high supply and high demand market. It saw negative correlations as low as -0.324 in 2022 and has been in negative territory for all of 2025. For Nashville, the glut of new deliveries was too much for demand to handle in so short a period. The resulting low occupancy has prevented rent growth that would generally be expected along with that demand.
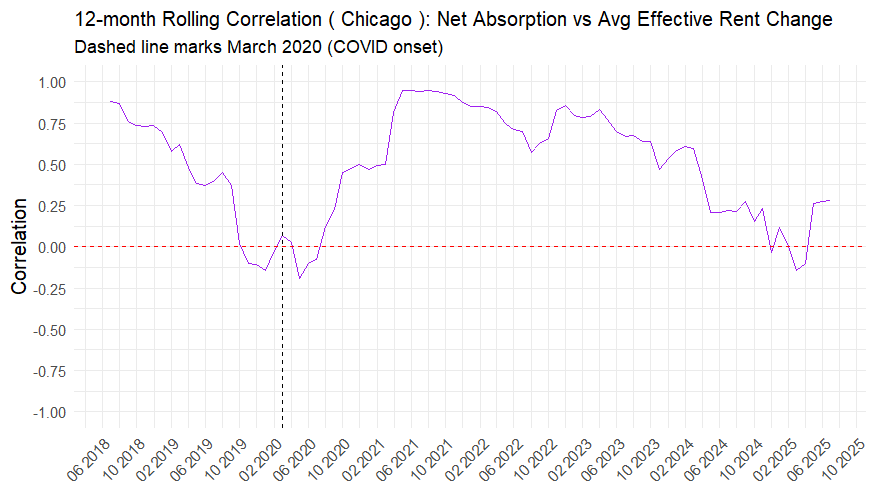
Chicago provides an example of a low supply and high demand market for the analysis period. It had brief negative correlations in late 2024 and early 2025 with a minimum value of -0.141 in March of this year. Above-average apartment demand and below-average supply, both adjusted for market size, allowed for mostly strong positive correlations as relatively tighter market conditions amplified the impact of demand.
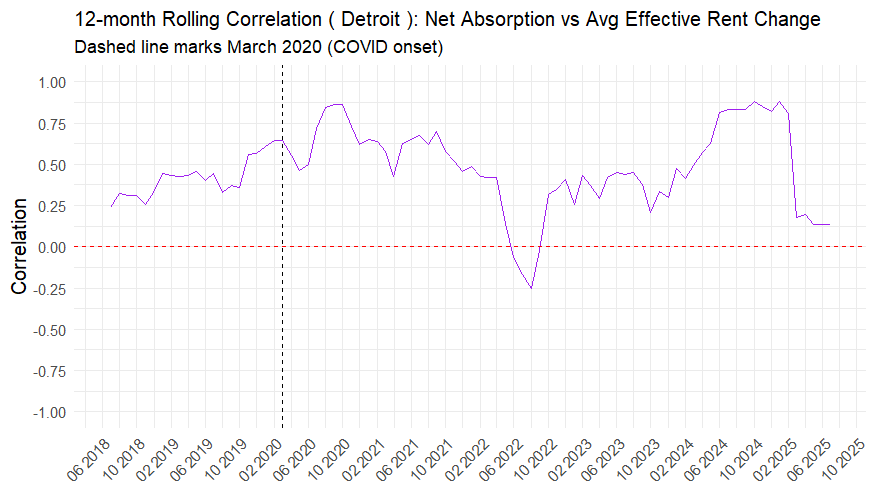
Detroit is an example of a low supply and low demand market. The area showed negative correlations only briefly in 2022 with a minimum value of -0.254 in August of that year. Both supply pressure and resident price sensitivity can be ruled out for Detroit in the analysis. Hence, this brief period was likely due to economic and pandemic-related factors.
Takeaways
Rolling correlation analysis offers a powerful lens for understanding multifamily market dynamics by revealing how demand and rent change interact over time. Nationally, correlations fluctuated from a robust 0.921 in 2018–2019 to a low of 0.191 in 2020, recovered to 0.908 in 2021, and then dropped again to 0.241 by July 2025.
This decline highlights the impact of a multi-decade supply peak and economic pressures, which have decoupled demand from rent growth at various points throughout recent years. The weakening of the relationship between apartment demand and rent growth in recent months is a potential warning sign for the continued momentum of improving rent performance. However, the anticipated further drawdown in supply next year should provide a boost in 2026.
Market-specific insights further enrich this picture. New York’s pronounced negative correlations signal periods of both economic and supply challenges, while Chicago’s strong correlations reflect tight supply that has amplified demand. Nashville and Detroit show supply and economic pressures, respectively.
By tracking evolving demand-rent relationships, market shifts can be identified. The underlying causes of those shifts can be assessed, and regional conditions can be compared. All of this empowers data-driven decisions, enabling the multifamily industry to navigate complex market conditions with added confidence.
Disclaimer: All content and information within this article is for informational purposes only. ALN Apartment Data makes no representation as to the accuracy or completeness of any information in this or any other article posted on this site or found by following any link on this site. The owner will not be held liable for any losses, injuries, or damages from the display or use of this information. All content and information in this article may be shared provided a link to the article or website is included in the shared content.
ALN Apartment Data delivers industry-leading multifamily market intelligence, empowering thousands of apartment industry professionals with accurate, research-driven insights.
- Owners and Management Companies leverage ALN OnLine for property search, rental market analysis, and competitor benchmarking—ensuring data-driven decision-making. Discover more about ALN OnLine here
- Multifamily Suppliers & Service Providers trust Vendor Edge Pro to identify property management companies, target apartment communities, and optimize B2B sales strategies with our curated data and must-have features like sales routing. Get started with Vendor Edge Pro today
- Enterprise-Level Multifamily Suppliers scale their business with Compass, the ultimate tool for nationwide property and management company insights, targeted prospecting, and market expansion strategies. Explore Compass now
Not sure how we can help you? Learn more about all of our services for Multifamily Professionals