Clouds Gather on the Multifamily Horizon
After a historic 2021 in which apartment demand and rent growth rocketed well beyond their typical ranges, the expectation for 2022 could be broadly summarized as “robust, but not 2021”. National rent growth projections for this year have commonly been in the 5-7% range across various sources. This is based partially on the thinking that supply constraints, a fully re-opened economy, and remaining high demand would continue rent growth momentum even if that growth likely peaked in 2021.
To be sure, there are many reasons to be optimistic about multifamily performance in 2022. National average occupancy is unusually high and housing supply remains especially low for single family as well as non-premium multifamily. Other economic indicators also bode well: the unemployment rate is back below 4%, labor force participation has gained momentum over the last five months or so, and transaction volume is at a record level as international and institutional money continue to pour into the sector.
View the full monthly Markets Stats PDF
However, as is always the case, there are also some downside risks. These clouds on the horizon will not necessarily bring a storm, but they are worth taking a little time to consider. And so, wandering a little further from ALN’s data than is typical for our monthly newsletter – here are a few potential rain clouds for your consideration.
Decline in Demand
More than 600,000 net units were absorbed across the country in 2021. This demand drove lease concessions down, rent growth into double digits, and average occupancy to nearly 95% — even as more than 300,000 new units were delivered. Last year had some built-in advantages that did not carry over into the new year like re-opening regional economies from a near stand-still, artificially deflated demand in 2020, and the injection of mountains of cash into the broader economy and people’s bank accounts.
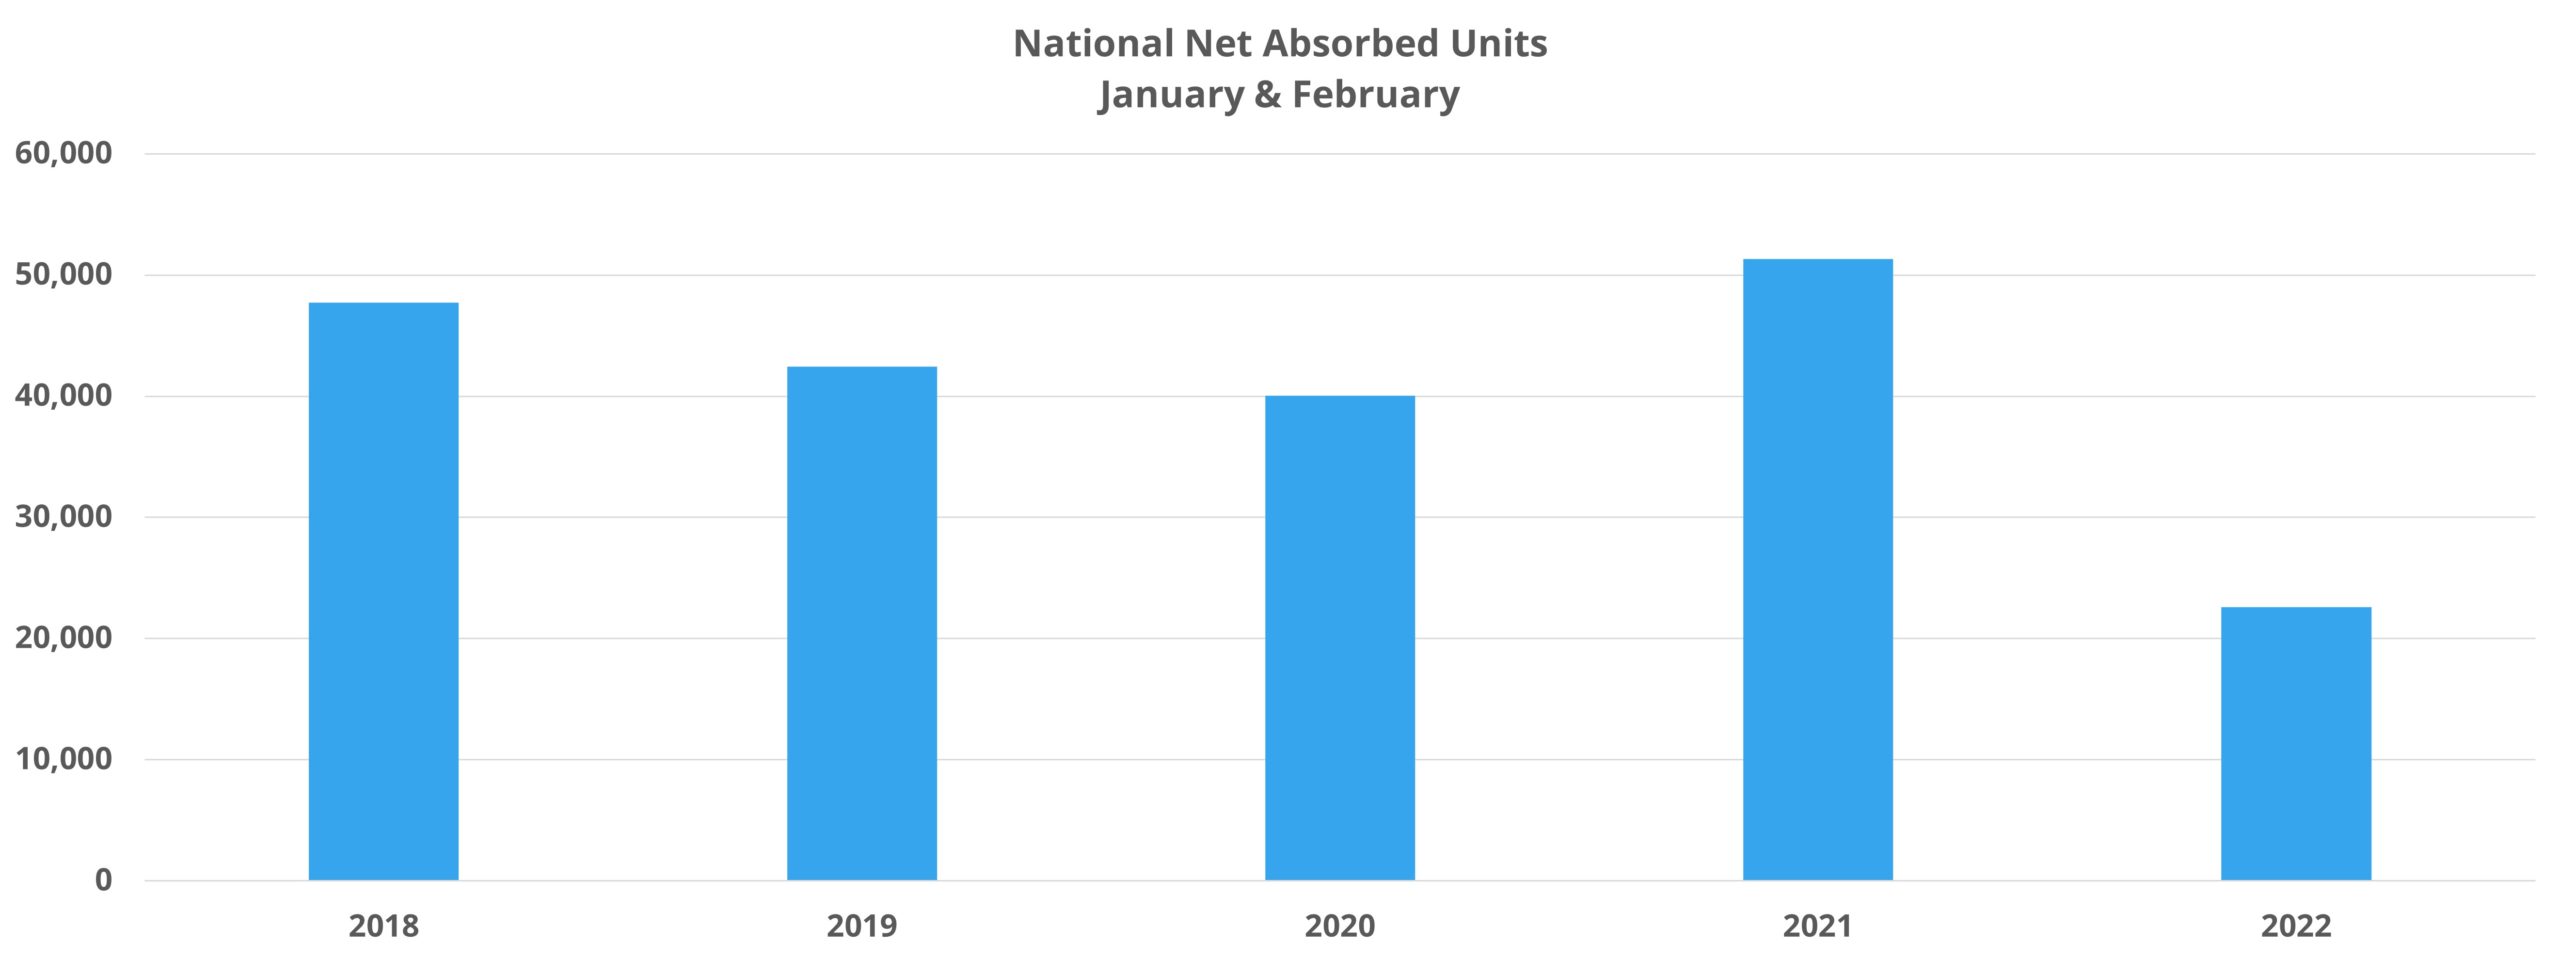
Without some of those atypical tailwinds and after national effective rent growth of 15% in 2021, apartment demand has been more tepid to start 2022. National net absorption in January fell by about 75% compared to January 2021. Even with something of a bounce back in February, around 16,000 net absorbed units represented a 30% decline from last February.

As has been discussed on the ALN blog in various posts for a few months now, it seems reasonable to expect the first signs of price pressure on apartment demand to appear in the workforce housing segment. In particular, the Class C space where residents tend to have lower incomes and a higher rate of jobs that cannot be made remote or hybrid. Also, they may populate the gap between higher incomes and incomes low enough to qualify for various assistance programs.
And indeed, after net absorption totaling almost 10,000 units in the Class C and Class D tiers in the first two months of 2021, those two price classes have suffered a net loss of more than 2,600 leased units in the same period this year. The bulk of those lost units, nearly 1,900, have come from Class C properties.
Affordability Crunch – Rent
The inverse relationship between price and demand is one right out of Economics 101, as is the caveat that demand tends to be less elastic for necessity goods. But, how much has the affordability picture changed recently? Answering this question in-depth could of course be its own topic, but we can sketch a general picture.
One perspective is to evaluate the share of US median household income accounted for by US median apartment rent. This provides a big picture view with some noise introduced by wide variance in both median rent and household income across the country, as well as differences in household size and the associated rent according to the number of bedrooms in a unit. Nevertheless, it provides useful context as a broad measure. Just from 2019 to 2021, with an estimated value for 2021 income that includes two stimulus payments, median effective rent rose from about 20% to just over 23% of median household income.

What does that look like in dollars? From 2019 to 2021, using the same 2021 estimate, median household income grew by 4% while median effective rent rose by 19%. That equates to an additional $233 per month in median household income and an additional $227 per month in median effective rent. The net change is actually negative though because median household income is a pre-tax metric. Factor is the loss of stimulus payments combined with a return to normalcy on the Child Tax Credit and the picture darkens further.
Affordability Crunch – Broader Inflation
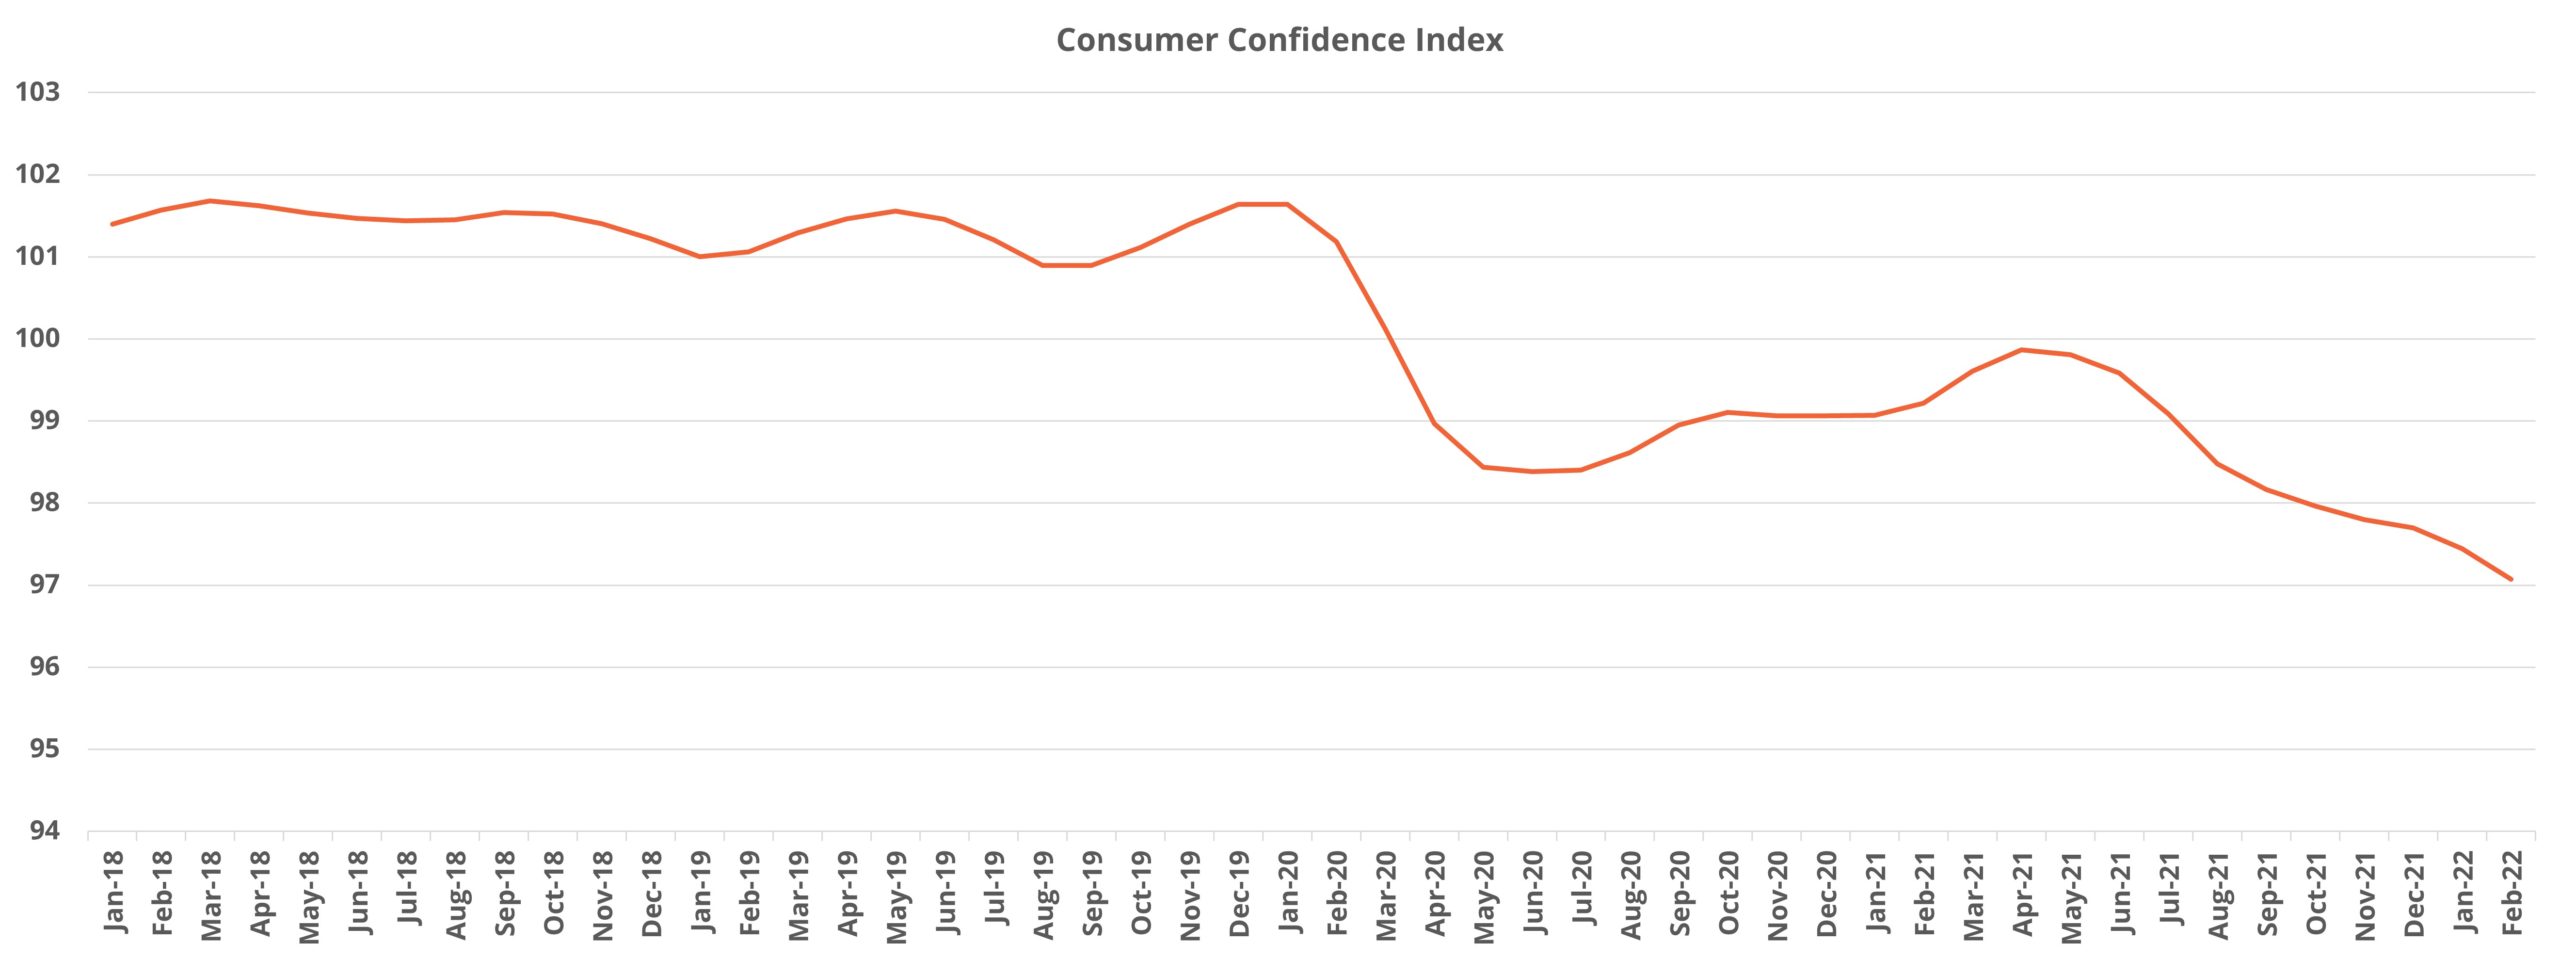
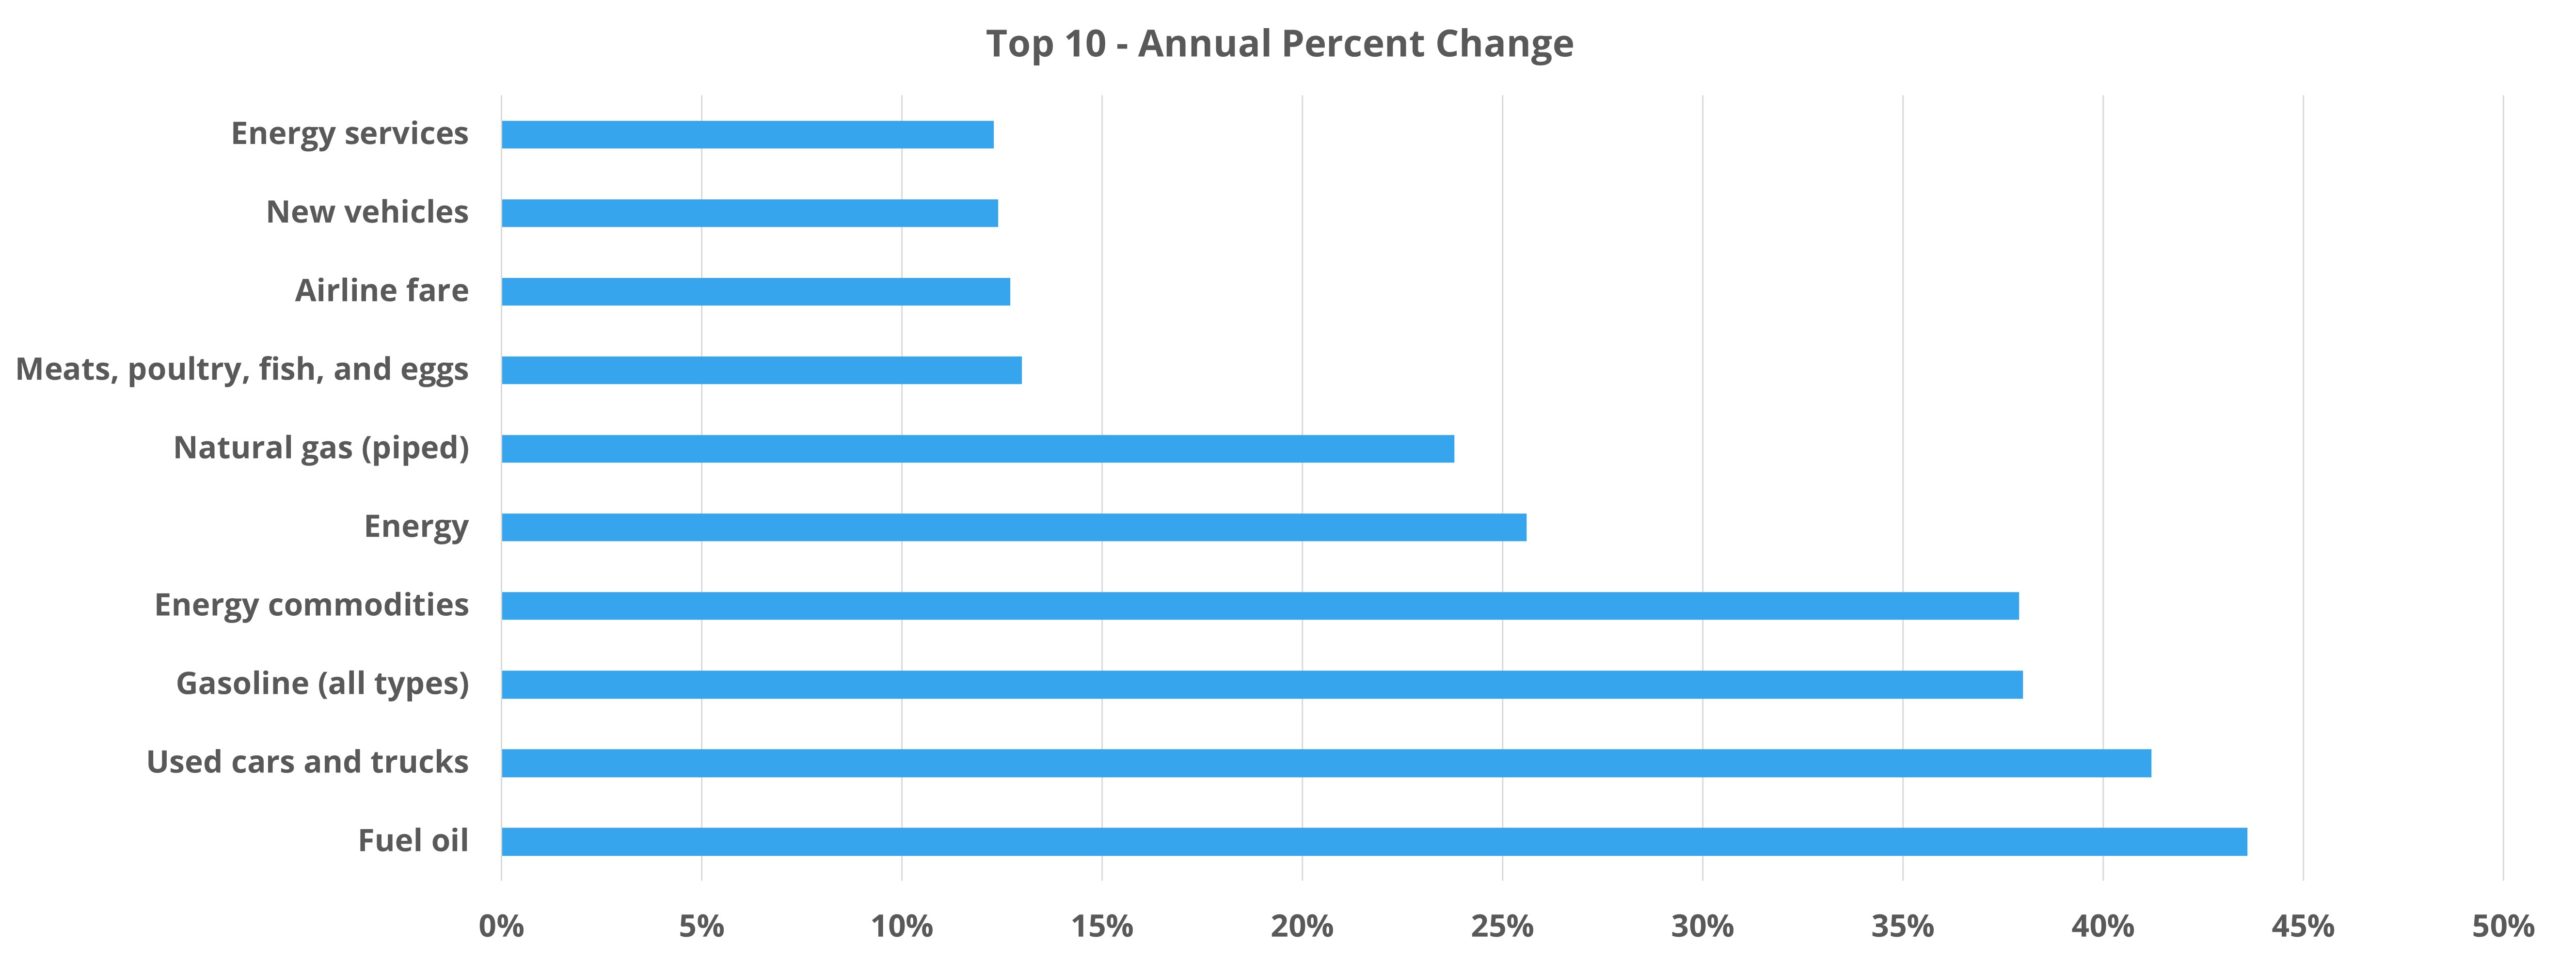
Aside from rent growth, general inflation also has to be mentioned in any assessment of housing affordability in the current moment. The consumer price index rose 7.9% in February, led by a 12-month change in energy prices of just over 25%. Inflation has not just hit energy though. The cost of groceries as a category has gained more than 8% in the last year and used cars and trucks have increased by more than 40%.
At this time last year, rent growth was just beginning to reemerge after a year of stasis, a third stimulus payment had just been dispersed, and inflation was a concern but not yet a reality. In the time since, average effective rent has gained more than 15% nationally, inflation is at the highest point in decades, and the last stimulus payment has long been in the rearview mirror.

Anecdotally, some operators have expressed concern regarding the ability of residents to pay the higher rent, specifically on renewals where residents typically are not re-screened. To mitigate a rising delinquency risk, it may be that capturing a rent gain that is manageable for residents is ultimately more beneficial than attempting to capture the full increase that the market seems to indicate is there.
Pandemic-Era Evictions
Another potential rain cloud on the multifamily horizon has to do with evictions. Here, a brief thank you is due to Owner and CEO of UMoveFree.com, Nick Barber. Not only did Nick point out to me the pandemic-era ‘eviction deficit’ as he coined it, but also passed along some useful data from The Eviction Lab, a project associated with Princeton University.
The eviction moratorium at the federal level ended in late August of 2021. In the time since, most states and localities have phased out moratoriums as well, but some as recently as just the last few weeks. Quality eviction data is difficult to come by, and The Eviction Lab unfortunately has a limited geographic reach. Even so, the data set includes a good number of primary markets.
Although eviction moratoriums were initially intended to prevent a flood of evictions during the early days of the pandemic, the net effect of the various local, state, and federal measures was a dramatic decline in evictions to well below historical norms. In an area like Dallas where no local or state moratorium was added after the expiration of the CDC order, eviction filings were below the historical average established from the previous three-year period every month from March 2020 through February 2022. The total shortfall for filings in the period was in the tens of thousands. Filings had been steadily climbing in Dallas since the expiration of the CDC order before exploding in the most recent March data to more than 200% of the historical average.
Evictions Looking Forward
Other markets like Austin, Houston, Jacksonville, Las Vegas, and Tampa are all now seeing eviction filings at an above-average volume after being artificially reduced in the earlier days of the pandemic. Despite all of those markets being Sunbelt markets, this is not a regional phenomenon.
Markets around the country in which eviction moratoriums phased out by the end of Q3 2021 are seeing similar results. Areas like Boston and New York that instituted additional eviction moratorium policies well after the expiration of the CDC order remain well below the historical average for filings, though that seems unlikely to persist in the coming months.

In our series Takeaways, ALN Apartment Data Senior Market Analyst, Jordan Brooks, shares more insight into the final thoughts on the April 2024 newsletter article…
Not only has multifamily average occupancy been somewhat inflated by evictions not being processed at a normal rate over the last two years, but these residents now being moved through the process will potentially fall out of the traditional resident pool for some time and could have an impact on apartment demand more generally – especially in the workforce housing segment.
The issue of rising evictions may be mitigated somewhat by a few factors. One is that higher than normal average occupancy and presumably healthy property cash flows after the last year of rent growth should provide some cushion for operators. As already mentioned, there is likely some noise in the occupancy data related to evictions, but the challenge is certainly better met with 95% average occupancy than 92%.
Additionally, some operators may have been getting in front of the problem to the extent possible by using non-renewal as a tool as leases expired. It should also be kept in mind that delinquent residents will be replaced by paying residents, even if that has to come at the expense of maximal rent growth, and so the impact should be somewhat blunted from a net rent per unit perspective.
Takeaways
After robust performance essentially across the board for multifamily in 2021, there is reason to believe positive results will be more concentrated in 2022. Soft apartment demand to begin the year relative to recent history may be an early indication that headwinds for the industry are beginning to have an impact. Multifamily absorption in the next couple of months as we enter the traditionally strong portion of the calendar for the industry will be very telling.
Affordability, perpetually a concern in the modern era for residential real estate has only been exacerbated in recent years. With the cost of everything from gas to groceries on the rise with little chance of a reversal in the near-term, only so much rent growth can be absorbed by residents before pricing pressure impacts demand.
Evictions, and the impact of their rising tide on occupancy, will continue to be felt across the industry this year. There could be some disruption in the short-term, especially where the issue is most concentrated. Fortunately, the heady performance metrics of the last year should help owners and operators ameliorate the impact of these delinquencies going forward.
This month’s newsletter highlighted a few potential rain clouds, but it is not an exhaustive list. Rising interest rates, continued supply chain disruptions, and the wider ramifications of unprecedented international sanctions and geopolitical risks not seen in decades could have been addressed as well.
None of this takes away from the strong fundamentals of the multifamily industry or the positive momentum carried into the year from 2021. The picture is not one of just doom and gloom to be sure, a slowdown could simply resemble a reversion to the mean. However, it is certainly the case that a more jarring change to the status quo is possible. Now is not the time for rose-colored glasses – at least not without an umbrella.
Reliable Multifamily Data
ALN Apartment Data offers access to web portals that allows our clients to search properties, access submarket and markets trends, new construction, and more. Since 1991, we have continued to refine our business practices and methodology in order to offer our clients the absolute best in multifamily data.

Disclaimer: All content and information within this article is for informational purposes only. ALN Apartment Data makes no representation as to the accuracy or completeness of any information in this or any other article posted on this site or found by following any link on this site. The owner will not be held liable for any losses, injuries, or damages from the display or use of this information. All content and information in this article may be shared provided a link to the article or website is included in the shared content.

