A Historic Year is in the Books
2022 is here, and it is time to give 2021 one last look before diving headlong into the new year. Whereas 2020 was a historic year for mostly undesirable reasons, 2021 will be a year multifamily industry participants reference and discuss for a long time to come. The story of 2021 was generational apartment demand and rent growth. Pent up demand from 2020, economic re-opening, stimulus efforts, population migration, changing renter preferences, and more fueled one of the most active years on record for the industry. As always, numbers will refer to properties of at least 50 units.
Population Change
As already mentioned, one important component of 2021 multifamily performance was the change in population various regions and states experienced during the year. As US population growth continues its decline toward stasis, population migration becomes even more vital. According to data from the US Census Bureau, the South was the only region of the country with positive net migration for 2021.
View the full monthly Markets Stats PDF
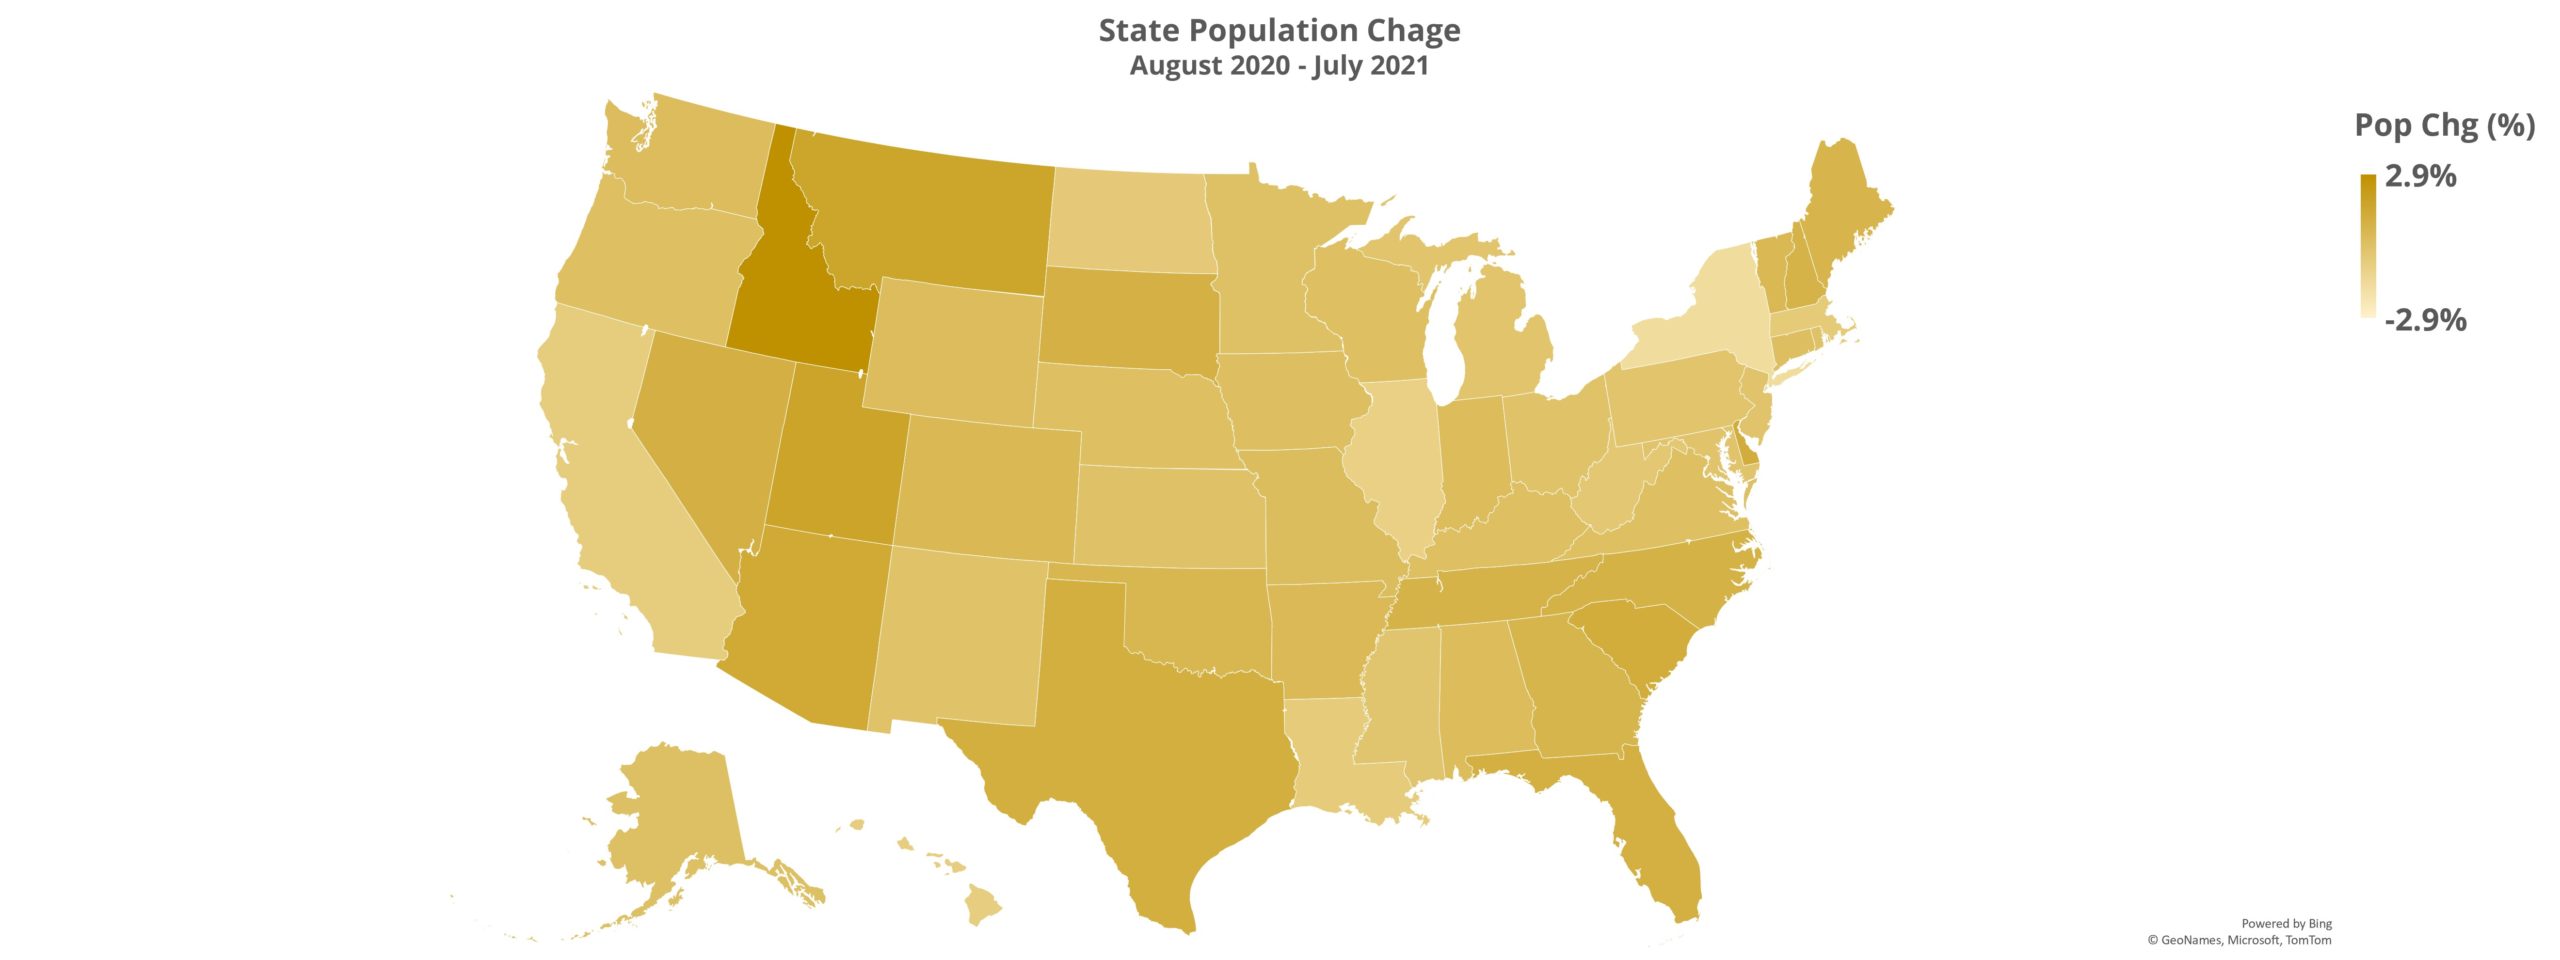
The West managed a gain in population despite negative net migration, but the Northeast was not able to overcome a net loss of nearly 390,000 people moving to other parts of the country. The state-level picture brings a bit more specificity. Again, according to the US Census Bureau, Texas added than 300,000 residents during the year – the largest gain in population of any state.
On a percentage basis, Idaho led the way with a 2.9% increase in population during 2021. New York lost about 320,000 residents during the year for the largest loss of any state. Washington DC suffered the largest decline on a percentage basis with a population decrease of 2.9%. New York’s continued population slide meant that the state closed 2021 with less than 20 million residents, leaving California, Florida, and Texas as the three states above that threshold. Isolating only domestic migration, Florida, Texas, and Arizona were the top three states for net new residents while California, New York, and Illinois lost the most net residents.

A methodological note it also important here. The Census Bureau’s population estimates are annual numbers calculated every July, so the population change numbers cover a period from August 2020 through July 2021. This is relevant, especially when discussing net domestic migration, because the trends propelling this movement did not dissipate during the summer.
Multifamily National Annual Performance
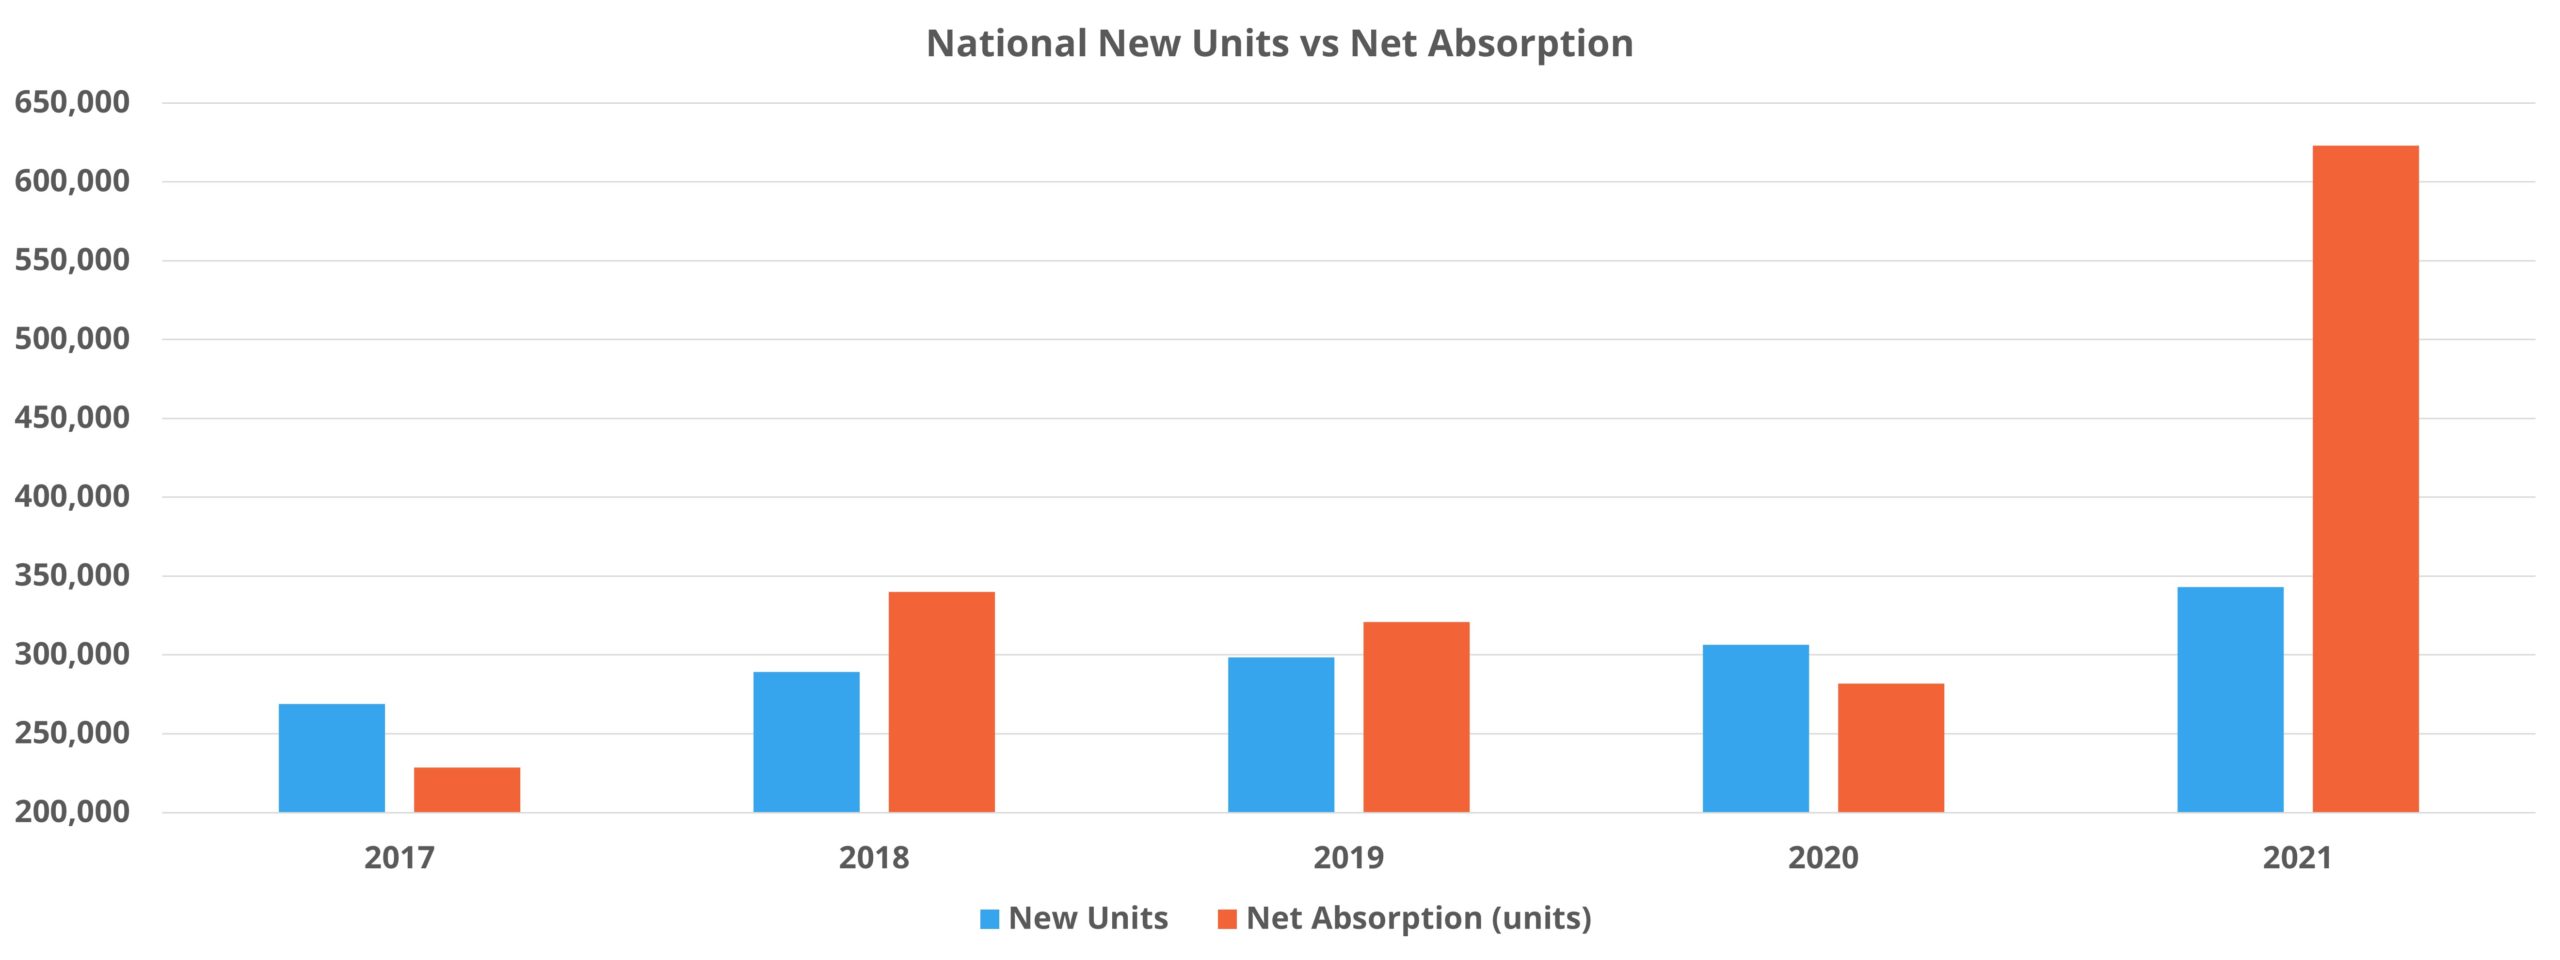
More than 620,000 net units were absorbed across the United States in 2021. Needless to say, this historic level of apartment demand was well beyond anything from previous years and could be considered the headline for the year. Still, some context is helpful. Net absorption in 2021 was about 120% higher than in 2020 and 95% higher than in 2019. Similarly, more net units were leased in 2021 than in 2020 and 2019 combined. This demand fueled an average occupancy gain of just under 2.5% for the year despite the new construction pipeline delivering more than 340,000 new units.
Even after an increase in new supply of almost 40,000 units compared to 2020, average occupancy ended 2021 at 94%. Not only did 2021 mark an increase in new supply from what was a very active 2020, but the last two years have been the only two years since 2000 in which more than 300,000 new multifamily units have been delivered.

If the 2021 headline was not apartment demand, it would be rent growth. Average effective rent rose by around 14% nationally to close December with the average unit leasing for $1,555 per month. The closest annual growth figure in the last five years to the 2021 figure was an 8% gain in 2017. The growth in 2021 more than tripled that from 2019. 2020, with all of the difficulties associated with the onset of the COVID-19 pandemic, managed only a 0.5% annual gain.
Helping to fuel the rent gain was a dramatic decline of nearly 60% in lease concession availability. Less than 10% of conventional properties around the country were offering a new lease discount by the end of December. Likewise, the average lease concession value declined by 20% to finish the year at under four weeks off an annual lease.
Price Class Performance
For the sake of space, a more detailed analysis of 2021 price class performance will be the topic of an upcoming ALN blog post, but a couple of main takeaways are worth mentioning here. Overall, the surge in apartment demand that occurred in 2021 was seen across the price classes, with no property group failing to at least double its net absorption from 2020. It is important to remember that although rent growth did not begin recovering until 2021, the demand recovery began in the summer of 2020 – so 2020 numbers are relevant as a point of comparison.
While the demand explosion was seen across the classes, Class A demand was in a category all its own. More than 200,000 net units absorbed was not only the most of any price class, but those units accounted for 36% of total national absorption. This is notable because Class A units represent only about 13% of nationwide units.

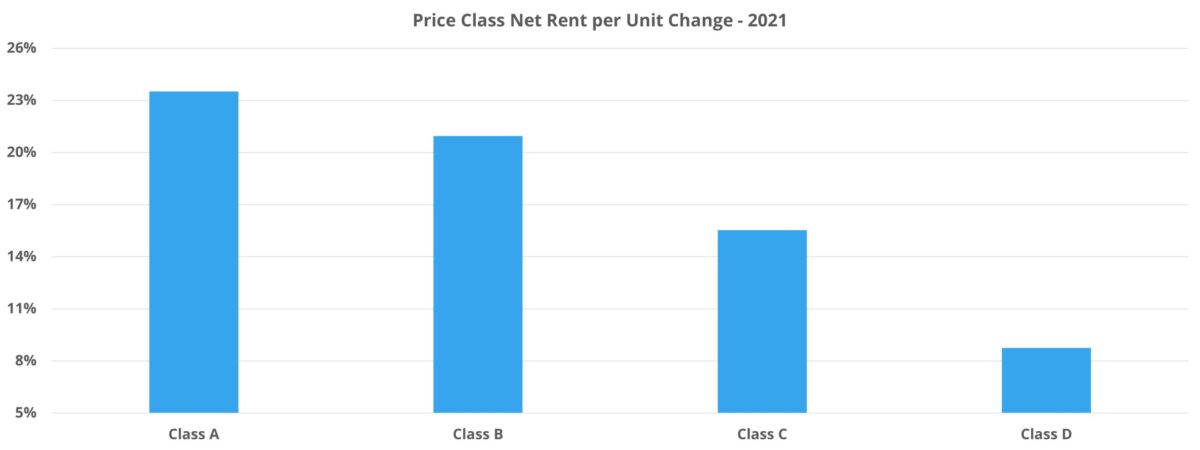
On the rent front, only Class D failed to cross the 10% average effective rent growth threshold. Still, an annual increase of 7% for those properties was easily the largest of the last five years. A 17% gain in the Class B space was the largest in 2021, followed by a 16% jump in the Class A subset and a 14% increase for Class C properties.
High-income residents fueled Class A demand, but the rent increases seen in the Class C and Class D space are more concerning. These residents have less ability to deal with short-term appreciation of that magnitude and the headlines associated with 2021 rent growth have helped to fuel an appetite for rent control and other counterproductive measures for the industry and for residents.
Market-level Performance
As with the price class look, more in-depth coverage of notable markets will be forthcoming on the ALN blog in the coming weeks. However, no annual recap would be complete without at least mentioning some markets on either end of the performance scale. In apartment demand, the leaders were the usual suspects.
Dallas – Fort Worth led the way with net absorption totaling just less than 50,000 units. Houston, Los Angeles – Orange County, New York, and Atlanta rounded out the top five markets. Considering demand as a percentage of units available to be absorbed brought some other markets into focus. Concord, NH absorbed over 80% of available units despite annual net absorption being less than 200 units.
Similarly, Columbia, MO leased more than three-quarters of available units. State College – Altoona, PA, Fort Myers – Naples, FL and Anchorage, AK also cracked the top five for that metric with none leasing less than 68% of available units. On the other side of the coin, Vermont, Montana, and South Dakota markets suffered a net loss of rented units, as did Green Bay – Appleton – Oshkosh, WI and Albany, GA.

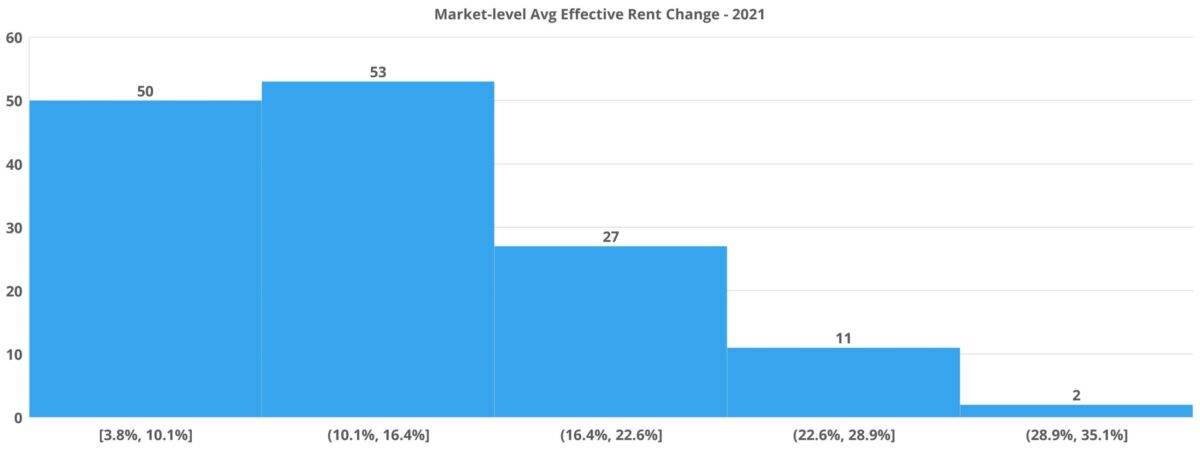
The top three markets in the country for average effective rent growth in 2021 were all in Florida: Fort Myers – Naples (+35%), Palm Beach (+30%), and Tampa (+29%). Phoenix and Austin were in the top five with each above 26% annual growth. Expanding out to the top 10 brings in three more Florida markets: Orlando, Jacksonville, and Melbourne. Rounding out the top 10 were Las Vegas and Myrtle Beach.
The markets with the most tepid rent growth in 2021, a designation that was especially relative last year, include areas like Topeka, KS, Bismarck, ND, Moline, IL, and all of Vermont. Larger markets that struggled relative to the rest of the country were Minneapolis – St. Paul, New York, and San Francisco – Oakland. Even so, the worst of that trio was a 6% gain in the Twin Cities.
Takeaways
To say 2021 was a bounce back year for multifamily would be an understatement. Historic and broad-based apartment demand propelled average occupancy and rent upward, lease concessions downward. It did so across price classes, markets of different sizes, and the urban-suburban-outlying divide. The year presented a cornucopia of interesting angles to be covered, and there was only space for some highlights here.
Population change, and specifically domestic migration, is an important influencing factor for the industry as overall US population growth continues to decline. It should be no surprise that the state with the most domestic migration last year, Florida, accounted for six of the top 10 markets for effective rent growth. Texas and Arizona were two and three for domestic migration, and both Austin and Phoenix were in the top five for market-level effective rent growth nationally.
Laggards relative to the rest of the country in rent growth like New York and San Francisco – Oakland were markets within states that suffered a population loss.
Looking ahead into the new year, uncertainty around COVID-19 and its economic and political ramifications remain. Last year had the benefit of artificially reduced 2020 demand finally being realized that 2022 will not, and so it is unlikely that apartment demand and rent growth numbers will match those from 2021. And yet, many of the drivers of 2021 performance remain in place. Short of some further major calamity, 2022 may well shape up to be a year that resembles something from the 2017 or 2018 period – certainly nothing to sneeze at as a follow-up to a historic 2021.
Search, Analyze & Compare
ALN OnLine is a web portal that allows our clients to search properties, access submarket and markets trends, new construction, and more. Since 1991, we have continued to refine our business practices and methodology in order to offer our clients the absolute best in multifamily data.

Disclaimer: All content and information within this article is for informational purposes only. ALN Apartment Data makes no representation as to the accuracy or completeness of any information in this or any other article posted on this site or found by following any link on this site. The owner will not be held liable for any losses, injuries, or damages from the display or use of this information. All content and information in this article may be shared provided a link to the article or website is included in the shared content.

