Class A Properties Feeling the Squeeze
Class A properties have been especially impacted in a year in which apartment demand cratered thanks to a global pandemic during what is normally a strong portion of the year for the multifamily industry. This was in part due to the influx of new units from the new construction pipeline and in part from a move toward affordability on the part of residents this year.
What the overall price class numbers obscure, and especially in the net rent metric because of new lease-up properties in Class A, is that stabilized Class A properties are more precisely where the pain has been felt.
View the full monthly Markets Stats PDF
ALN Price Class
Before moving to the numbers, what is meant by price class? ALN assigns conventional properties of at least 50 units to one of four price classes, A through D, based on the property’s percentile rank in its market for average effective rent per square foot. This allows for more apt comparisons of properties across markets by grouping properties of a similar position in their respective market. Class A represents the top 12% of properties in a market, Class B is the next 20%, Class C is the next 38% and Class D is the remaining 30% of properties.
National View
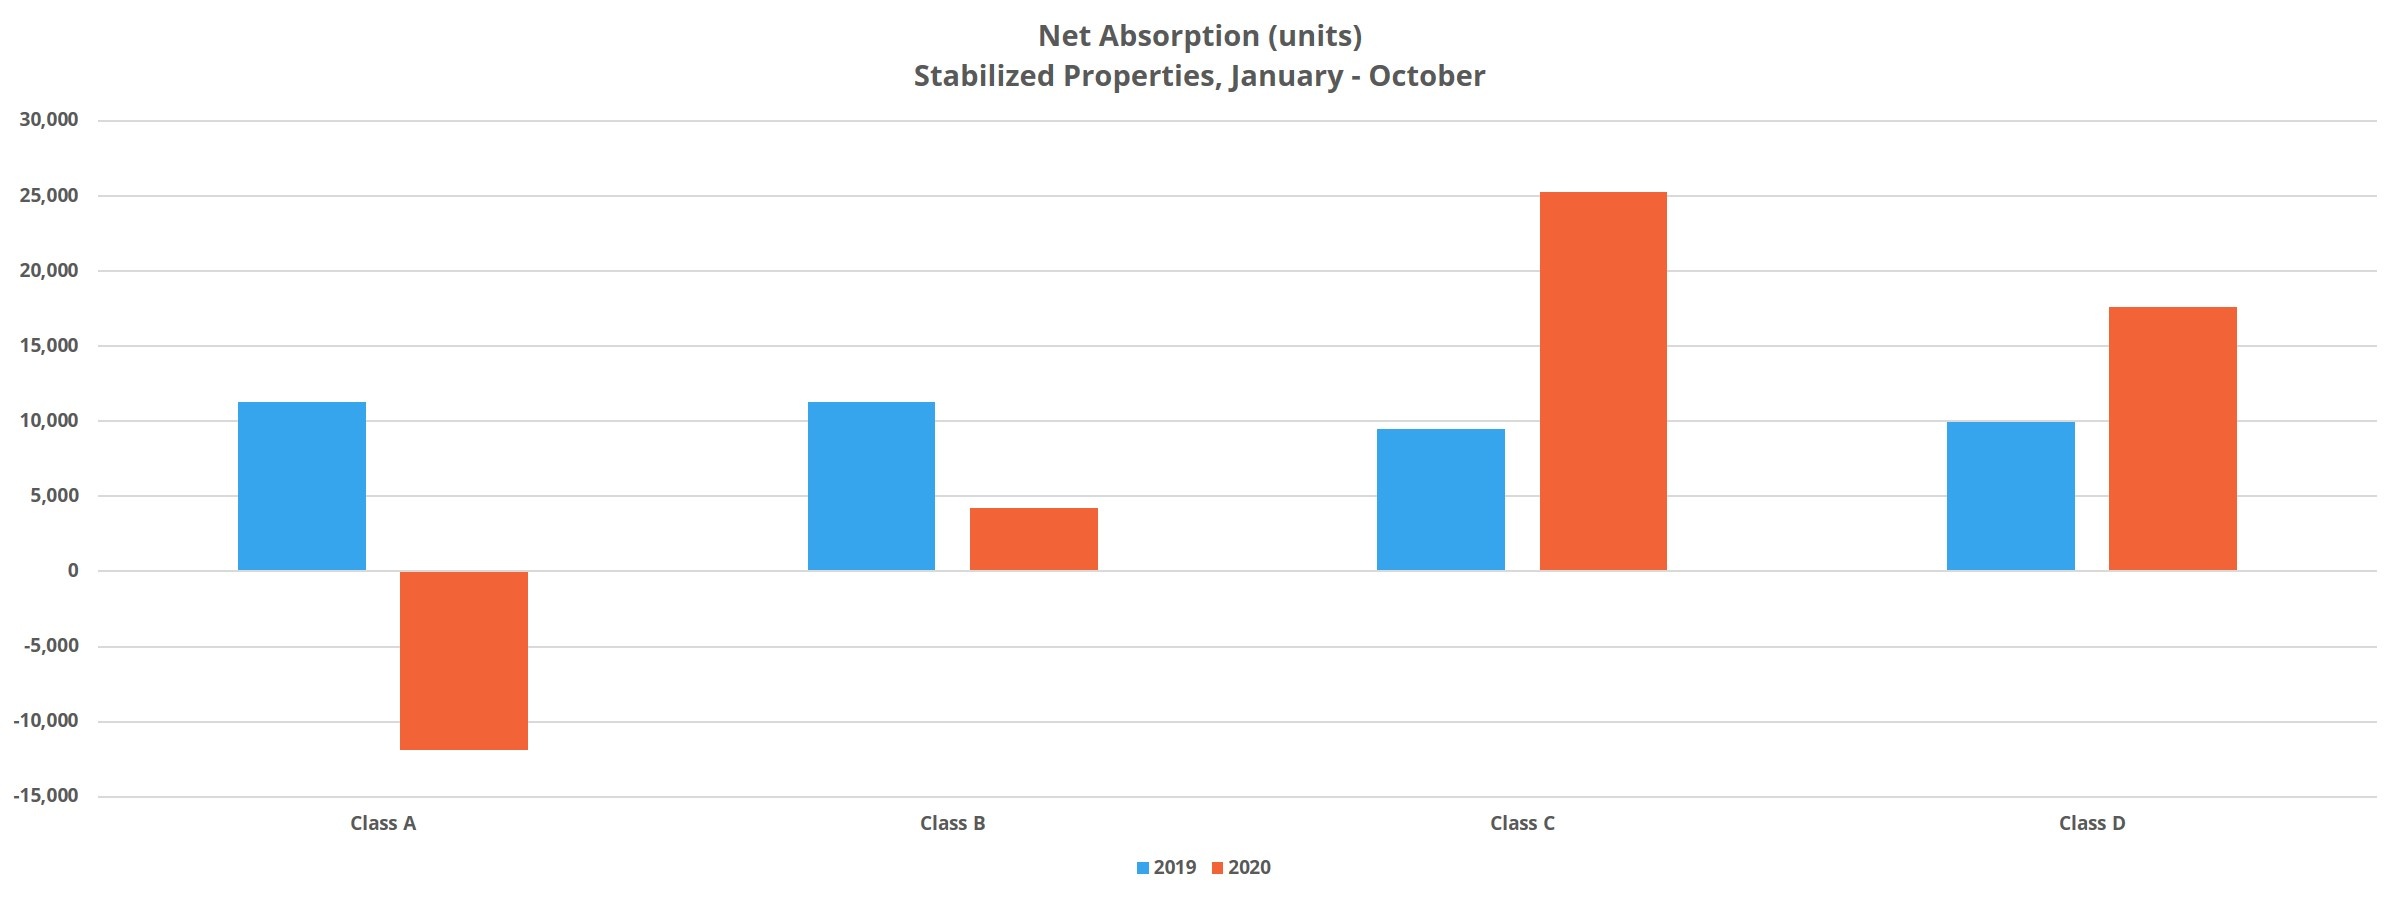
Through the first 10 months of 2020 the only price class to lose ground in average occupancy among stabilized properties was Class A, with a 1.3% decline to 92%. This is not an alarmingly low figure, but it is a few percentage points below the other three price classes which all finished October between 94% and 95%.
The culprit for the average occupancy decrease was negative demand. Net absorption, defined as the net change in the number of rented units for a specific period of time, was negative by 12,000 units on a year-to-date basis. Stabilized Class A properties have been the only price class to suffer a net loss of rented units this year. For context, during the same 10-month portion of 2019, stabilized Class A properties added more than 11,000 newly rented units. This was good enough for a 1% average occupancy gain to end October 2019 at around 94%.

The result of negative demand and a lower average occupancy has been a 1.2% decrease in average effective rent this year to $1,930 per unit. This is compared to a 2.7% increase in the same period last year. One of the main differences between this year and last for this subset of properties is that the availability and average value of rent concessions have increased through October of this year while both decreased during that time last year. 23% of stabilized Class A properties ended October offering a discount, up from about 17% to start 2020. Likewise, the average discount value has increased to 9% off a 12-month lease – equal to nearly five weeks off an annual lease.
Class A Market View
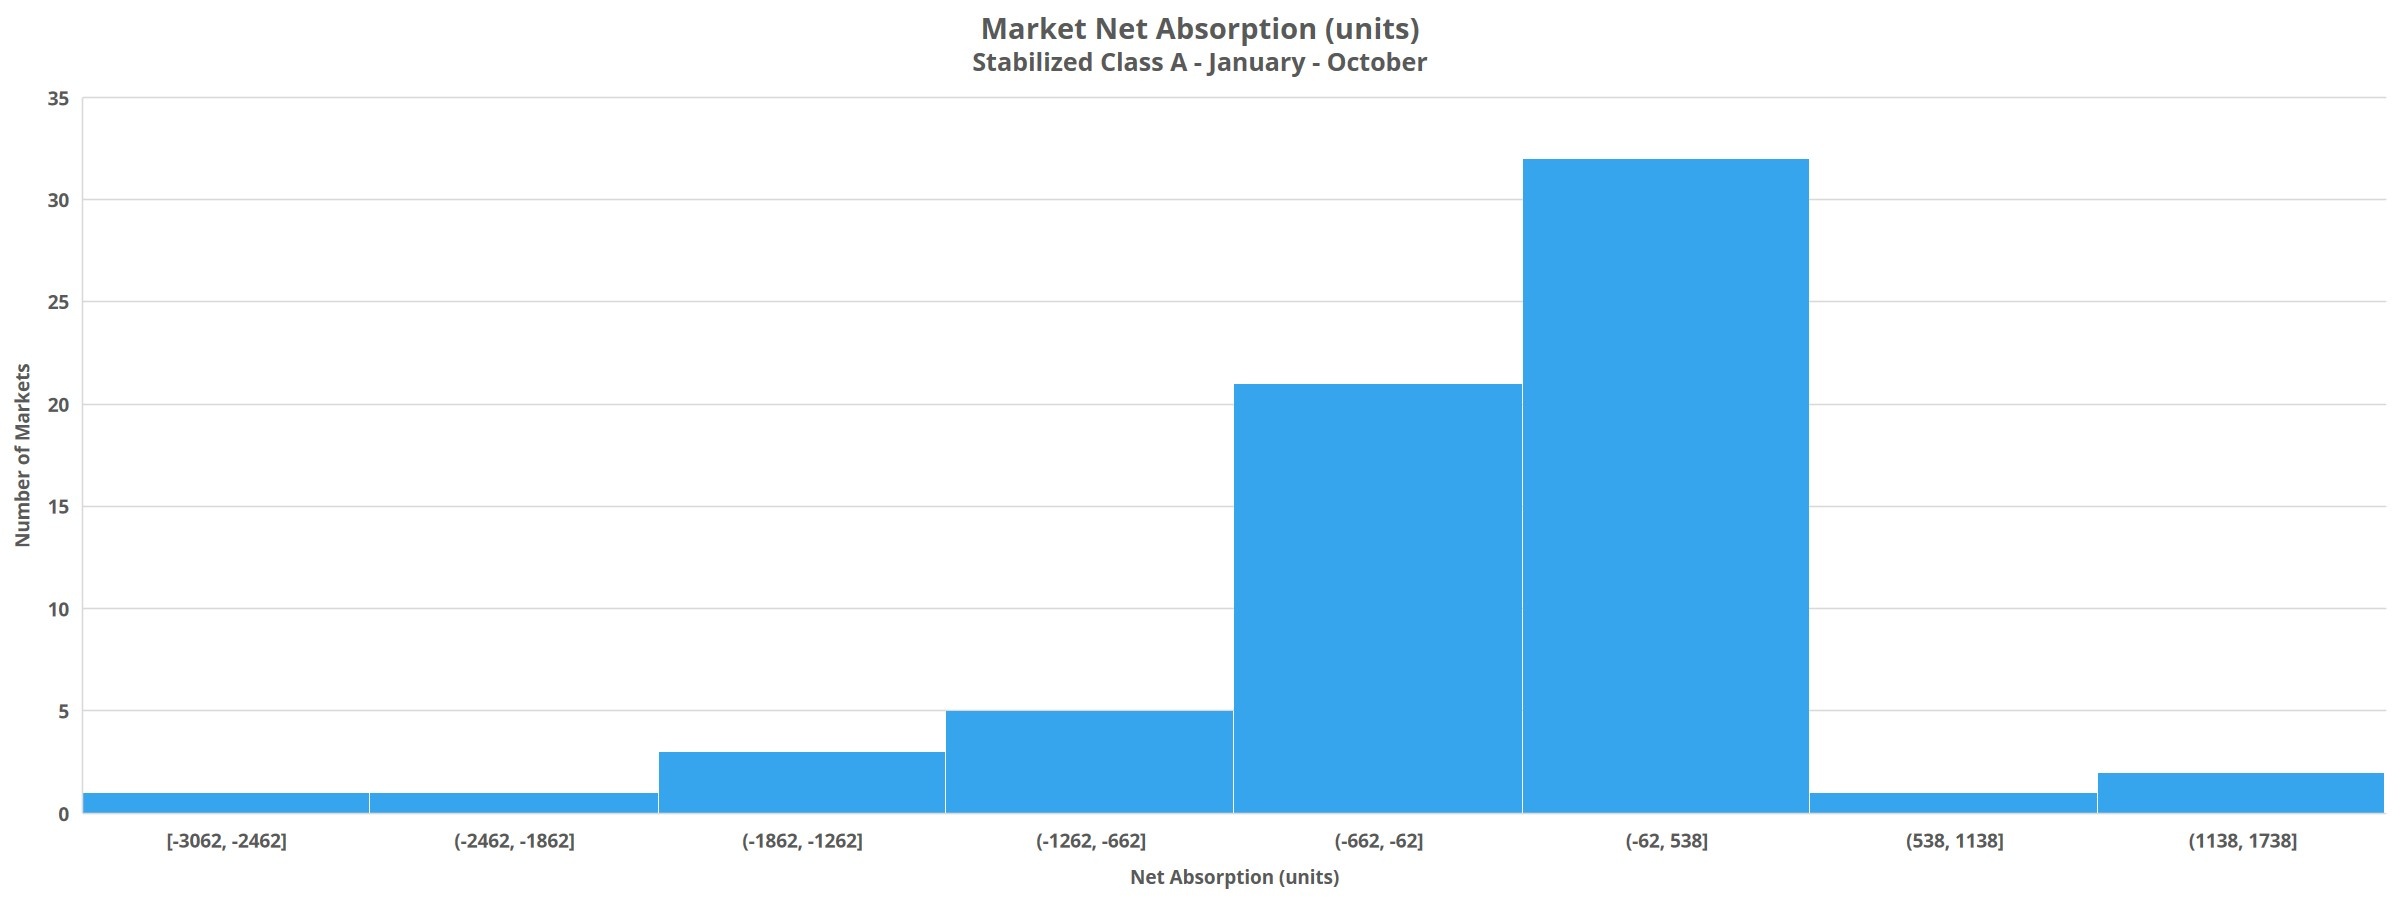
There are a good number of markets that would be interesting to zoom in on, but in this space the focus will be on a few markets especially hard-hit. The first is San Francisco – Oakland. Average occupancy there for stabilized Class A properties fell from 95% to start the year to 87% at the close of October after shedding more than 3,000 net rented units. Average effective rent has fallen by 4% since the start of the year for these properties.
Similarly, in the Boston area average occupancy also fell from 95% to 87% for stabilized Class A properties in the first 10 months of this year after losing more than 1,300 net rented units. Average effective rent was even more impacted, declining by 7% so far this year.
In the New York City area, more than 2,300 previously occupied units were vacated in this basket of properties. This drove average occupancy down from 96% to 92% and sent average effective rent lower by 1.4%.

There are others that could be mentioned like Los Angeles – Orange County, Washington DC, Chicago and more: large and dense urban markets largely on the coasts and already with some of the most expensive rents in the country. But another that stood out that does not fit that profile is Nashville. A loss of more than 700 net rented units in stabilized Class A properties there brought average occupancy down 5% to 89% and drove average rent down by 5% as well.
Takeaways Episode 45
Takeaways
Residents have clearly become more price sensitive in 2020. This is borne out by strong demand numbers in the bottom two price tiers as well as increased concessions across the board and the fact that Class A properties, stabilized or otherwise, have suffered the brunt of the impact of this year’s economic disruption.
Net absorption through October of this year was half that of the same period last year for Class A properties overall. Even so, after adjusting for the number of units in each price class, it has been Class A that has accounted for the largest share of absorbed units on a percentage basis this year. Given that price sensitivity appears to have increased and also that net absorption has been negative this year for stabilized Class A properties, how can this circle be squared?
On the national level, the average lease-up unit rents for $150 less per month than a stabilized Class A property. In many of the markets where stabilized Class A properties have fared worst, that gap is much wider whether measured by dollars or on a percentage basis. This means price-conscious residents can choose between a new lease-up property or a price Class B level property and be well below the monthly rent of a stabilized Class A.
Markets that have had a comparatively rougher go of it this year have generally fallen into one of a few categories. Either they are expensive, dense urban markets on the coasts, they are tourism or energy sector-oriented markets, or they are high-growth markets with a lot of new supply and rent growth in recent years. Another broad stroke that can be added is that regardless of market performance this year, even in areas that have done relatively well, stabilized Class A properties have fared worse than other segments.
ALN OnLine is a web portal that allows our clients to search properties, access submarket and markets trends, new construction, and more. Since 1991, we have continued to refine our business practices and methodology in order to offer our clients the absolute best in multifamily data.
Search, Analyze & Compare
ALN OnLine is a web portal that allows our clients to search properties, access submarket and markets trends, new construction, and more. Since 1991, we have continued to refine our business practices and methodology in order to offer our clients the absolute best in multifamily data.

Disclaimer: All content and information within this article is for informational purposes only. ALN Apartment Data, Inc. makes no representation as to the accuracy or completeness of any information in this or any other article posted on this site or found by following any link on this site. The owner will not be held liable for any losses, injuries, or damages from the display or use of this information. All content and information in this article may be shared provided a link to the article or website is included in the shared content. Illustration by Freepik Stories


