Decrease in New Supply Not Enough to Outweigh Demand Slide
The biggest impact of uncertainty and upheaval of the last few months has been the drastic reduction in multifamily demand. Depending on the area or the product type, either average occupancy or average effective rent may have been adversely affected more than the other – but net absorption decline has been the rule everywhere.
The saving grace for many markets has been a reduction in new supply during the same period. In some areas, residential non-subsidized properties were not considered essential activity. In others, labor shortages or supply chain issues delayed projects. Elsewhere, deliveries continued unabated. This month, using conventional properties of at least 50 units, let’s take a look at new supply volume and some specific markets that have stood out in the last three months.
View the full monthly Markets Stats PDF
Nationwide
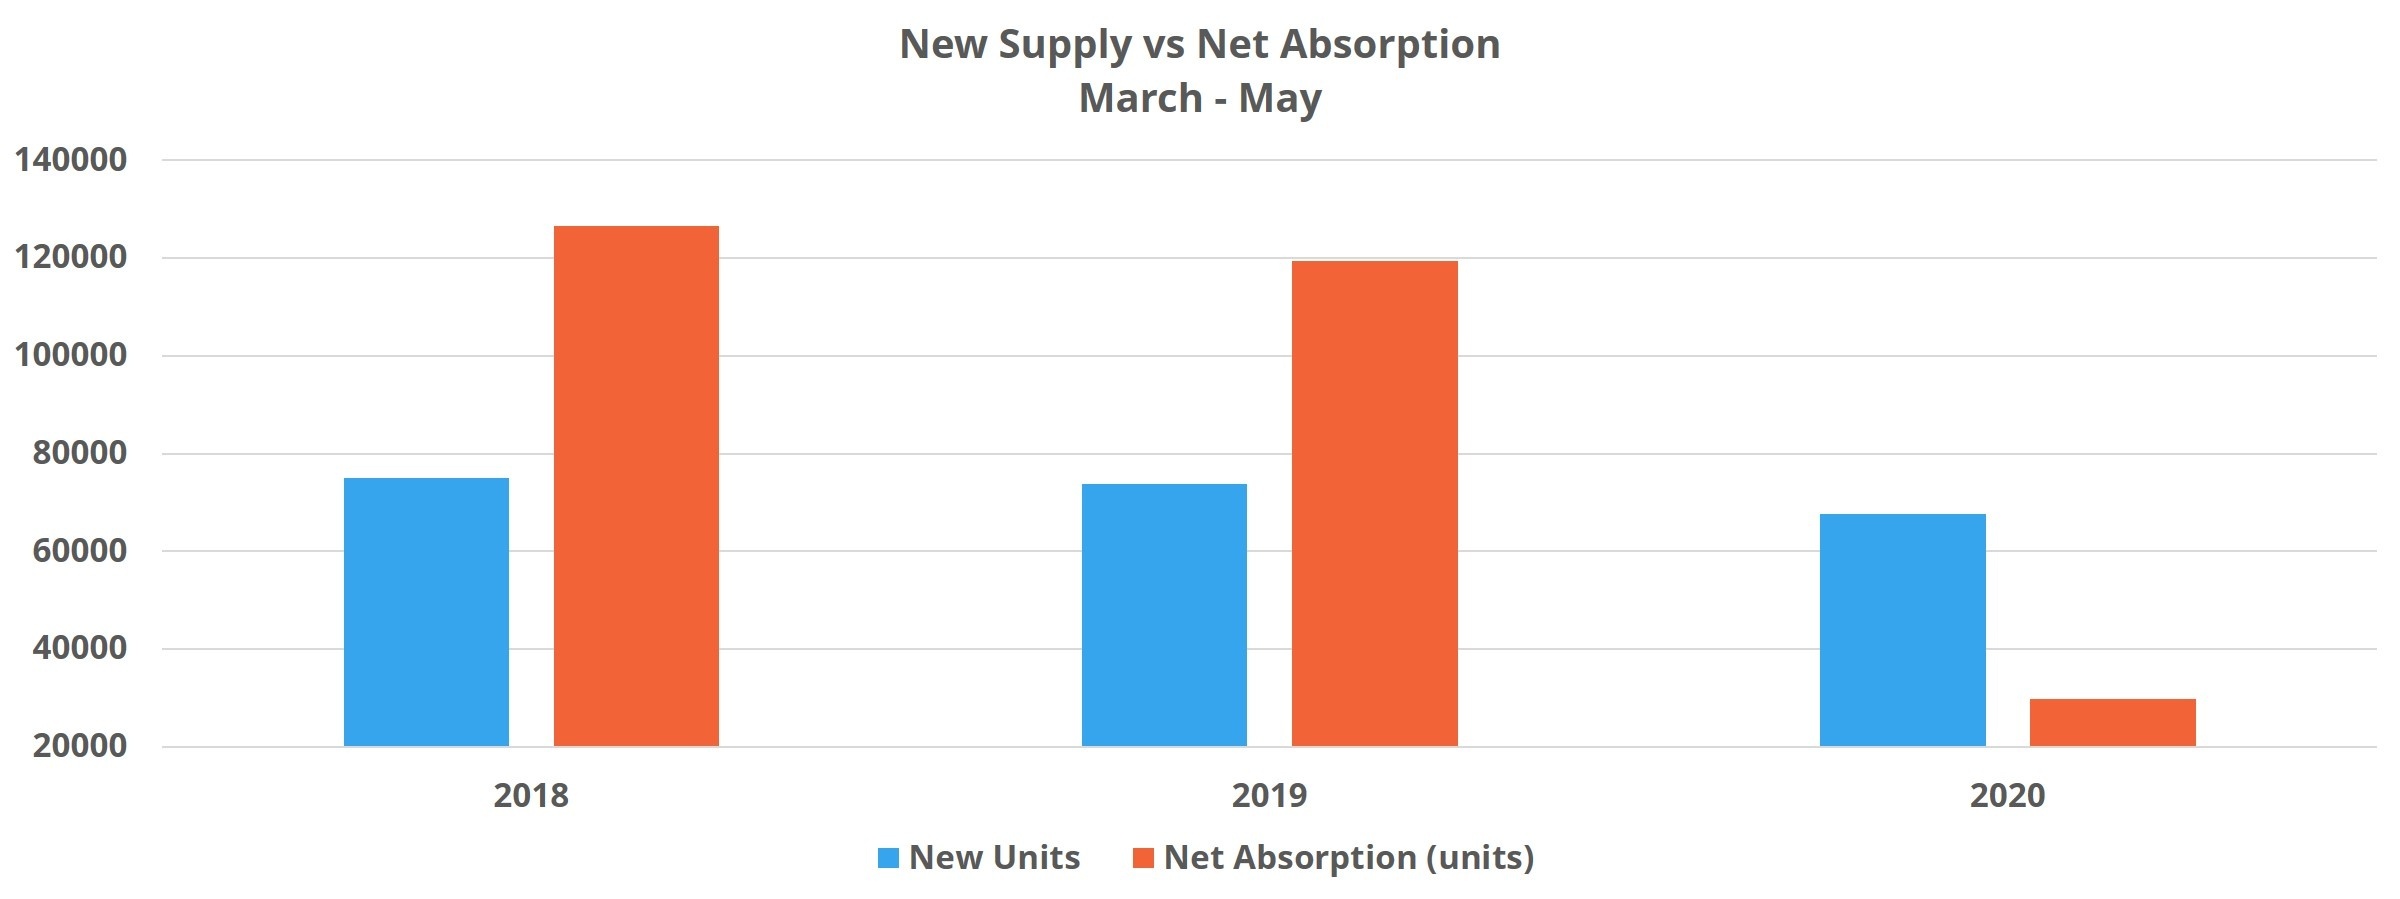
In the period from March through May in 2018 and 2019, the average volume of new supply delivered was approximately 74,000 units. This year that figure fell to just under 68,000. On a national scale, a difference of 6,000 units is not a huge one but does represent a more than 8% year-over-year decline for the period.

Unfortunately, net absorption fell by 75% compared to those same three months in 2019. The result was a 0.4% decline in average occupancy. Meanwhile, rent growth slowed from 2.3% in 2018 to 1.7% in 2019 to 0.1% in 2020.
Increased Deliveries
Five markets delivered at least 1,000 more new units between March and May of 2020 than in the same period in 2019. Unsurprisingly, the average occupancy decline in these five markets was double that of the national average.
Richmond, VA and Kansas City, MO were the two hardest hit markets from an occupancy perspective. Each lost at least 1%, led by Richmond with a 1.2% average occupancy decline. Houston, Phoenix and San Antonio each experienced occupancy declines of right around 0.5%. Despite its occupancy change being similar, Houston added 5,300 units while Phoenix and San Antonio added only around 2,500 new units each.
Two other major Texas markets just missed that 1,000-unit cut by adding about 900 more units this year than last. No market added more than the nearly 7,500 new units in Dallas – Fort Worth. Thanks to the largest number of newly rented units — almost 4,500 — average occupancy declined by just less than 0.4% despite that volume. In Austin, roughly 3,400 new units sent average occupancy tumbling more than 1.3%.
Decreased Deliveries of New Supply
A handful of markets stood out in terms of new supply reduction as well, and results were mixed. The most active market by far, even with the curtailment, was Denver – Colorado Springs. More than 2,700 units across a dozen properties came online and 1,800 net units were newly rented for an average occupancy decline of 0.4%. Orlando, a market heavily reliant on travel and hospitality for economic activity, lost 1% in average occupancy even while delivering 2,100 fewer units than last year.
Two areas managed to stave off occupancy declines thanks to a drastic draw-down in new units. The New York City metro area added 3,500 units, 2,700 fewer units than in March through May of 2019. The area managed to gain 0.3% in average occupancy. Similarly, the Seattle region delivered less than 500 new units after introducing more than 3,000 in the same period last year. This market actually managed a 0.2% occupancy gain in the period.

Net Absorption Decline
A loss of demand has been the main driver of the multifamily market for the last few months. So, which areas saw the steepest declines?
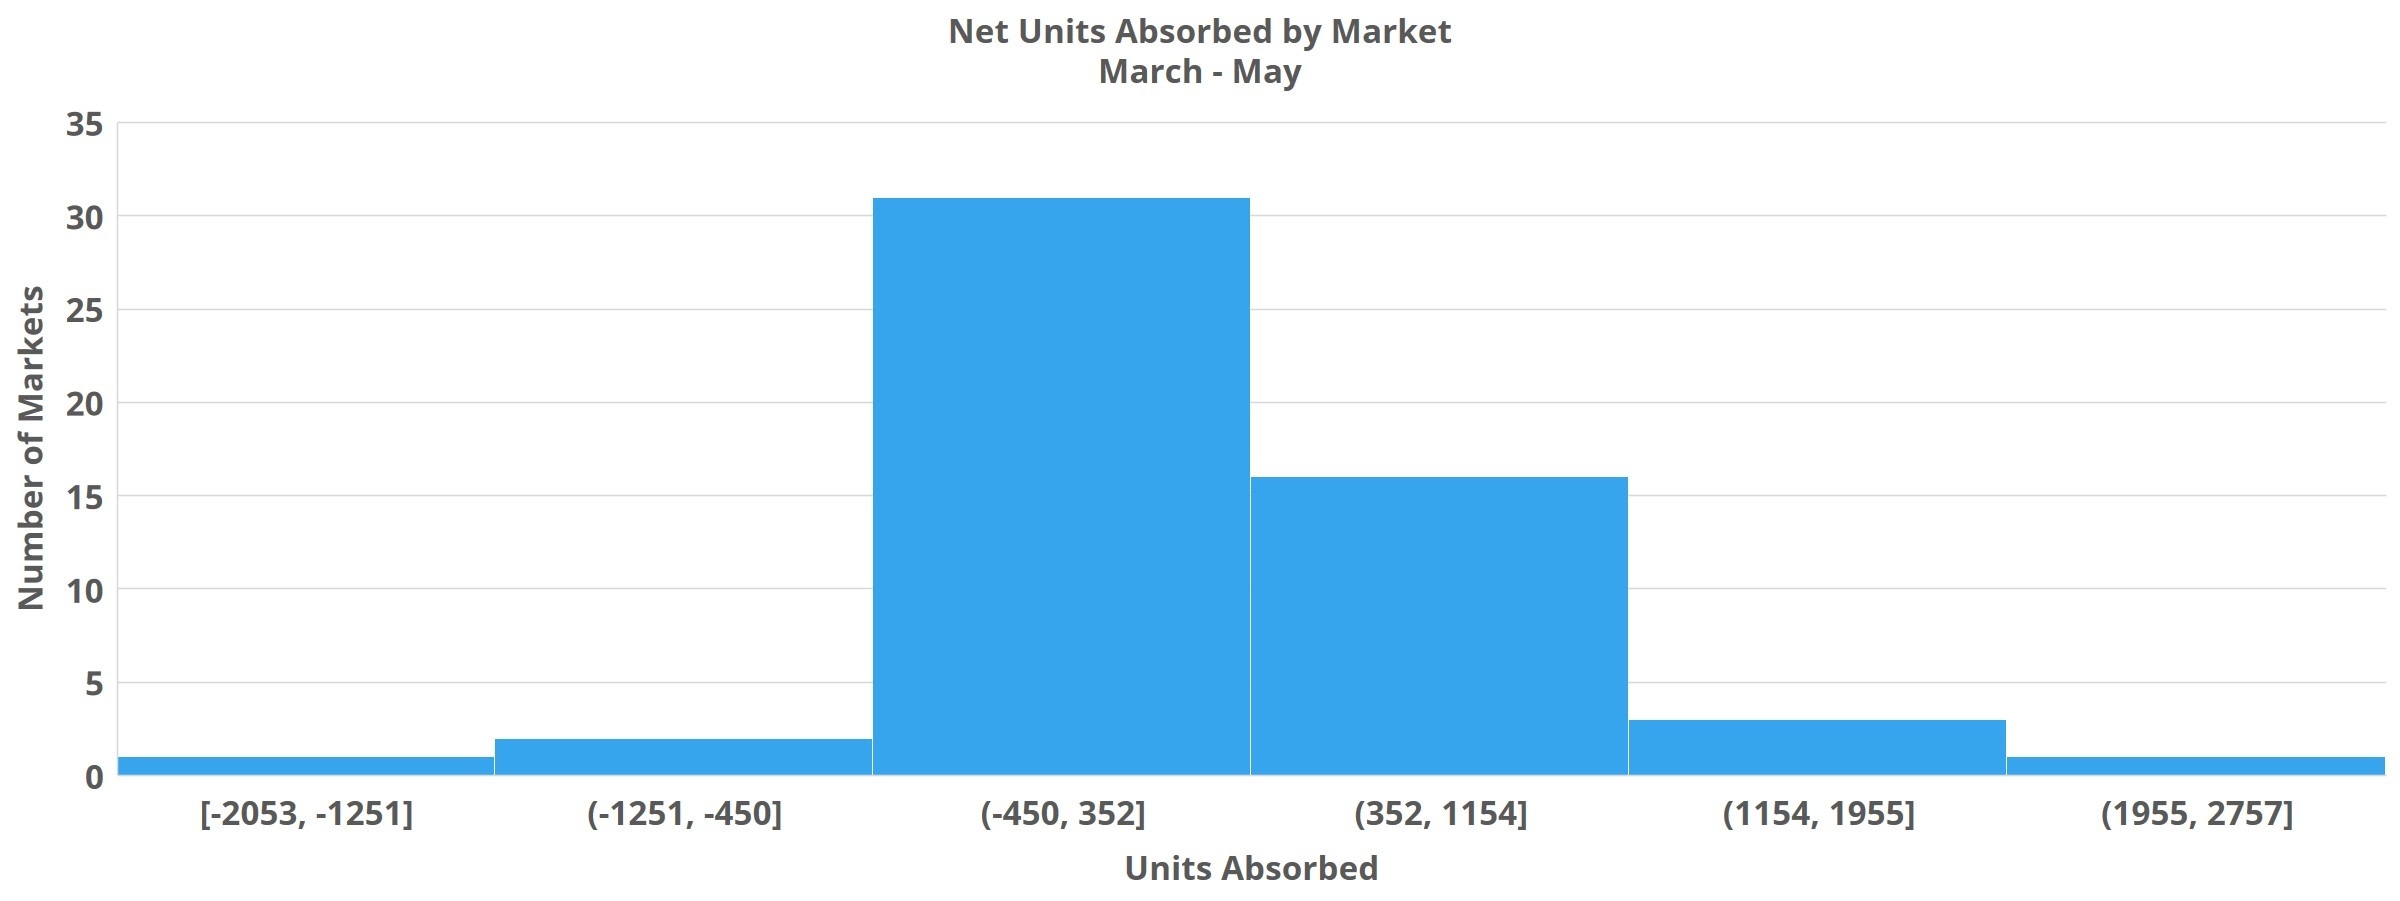
More than 60 markets shed net rented units in the period, led by a 2,000-unit loss in the Los Angeles – OC region. Midland – Odessa, a small market known most for oil suffered an average occupancy decline of more than 5% and an average effective rent decline of 10% after net absorption was negative by more than 800 units. Other markets that have not already been mentioned include Cincinnati – Dayton and Birmingham – each losing more than 500 net rented units over the past three months.
Other larger markets like Miami, San Diego and New Orleans all landed in the top 10 for markets with the largest reduction in the number of rented units.
Takeaways
The supply of new units between March and May of 2020 fell by 8% compared to the same period in 2019 while net absorption fell by 75%.
On a national level, average occupancy change turned negative. Average effective rent avoided a slide backward, but growth was non-existent.
As the country continues to re-open, whether or not a second wave of infections occurs will largely determine how the rest of the year plays out. Projects that have yet to break ground can be put on hold, but the tens of thousands of units in projects that have already broken ground are likely to be a drag on both average occupancy and effective rent in the near term. This is especially true for the most expensive markets as well as markets in which hospitality, travel and energy are major economic drivers.
Disclaimer: All content and information within this article is for informational purposes only. ALN Apartment Data, Inc. makes no representation as to the accuracy or completeness of any information in this or any other article posted on this site or found by following any link on this site. The owner will not be held liable for any losses, injuries, or damages from the display or use of this information. All content and information in this article may be shared provided a link to the article or website is included in the shared content.

