

A Bumpy First Half of the Year Comes to a Close
The halfway point of the year has now come and gone, making this month a perfect time to pause and evaluate how the first six months of 2023 played out for the multifamily industry. Following a 2022 that was disappointing on the apartment demand front, though not in rent growth, this year has had its share of challenges. Net absorption has remained underwhelming, and rent growth continued to flag after an incredible run of nearly two years in the face of falling occupancies.
All numbers will refer to conventional properties of at least fifty units.
View the full monthly Markets Stats PDF
New Supply and Net Absorption
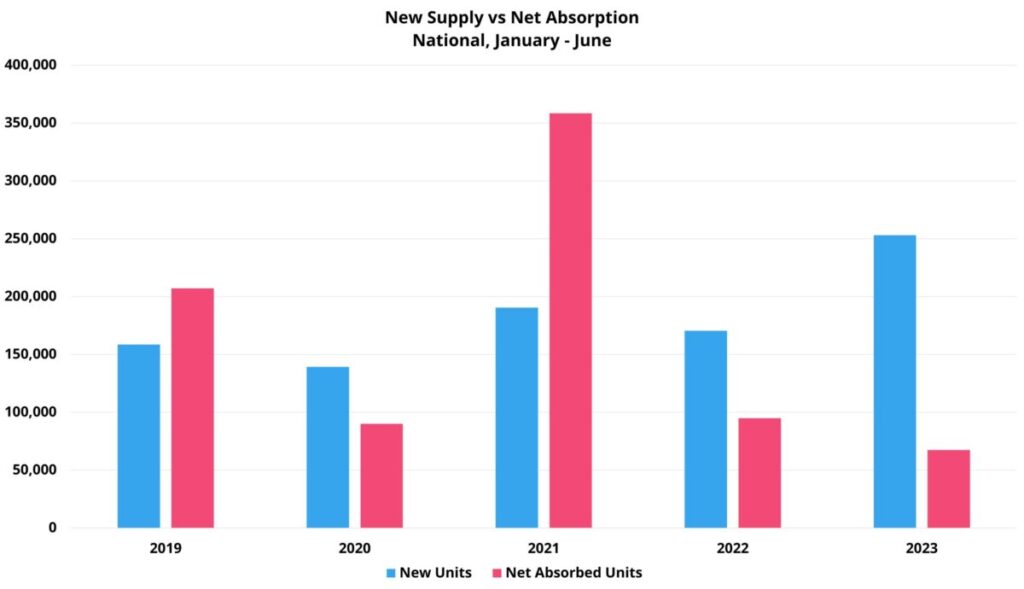
One notable development in the first half of the year, and one that is likely to continue into next year, was the increase in new supply. Deliveries through June have been about as expected, but a little more than 250,000 new units was a huge number – expected or not. No recent year has seen even 200,000 units delivered in this portion of the calendar, let alone a full quarter of a million.
Generally speaking, the Sunbelt markets are at the epicenter of the building boom. This has come in response to the consistently robust population growth for many of the markets in the region both pre-pandemic and since. Even so, the Gateway markets have been active this year as well. Dallas – Fort Worth and Houston led the way in deliveries with approximately 15,000 and 11,000 new units respectively. New York, Phoenix, and Los Angeles rounded out the top five with each introducing at least 10,000 new units.
Just as new supply has surged, apartment demand has largely failed to regain momentum after a sluggish 2022. Around 67,000 net absorbed units nationally was the fewest of the last five years. Last year, net absorption of about 95,000 units through June was followed up by a net loss of leased units in the back half of the year. With myriad headwinds to demand, this eventuality is not out of the question again this year. Somewhat ominously, national net absorption fell from roughly 28,000 units in May to less than 9,000 net units in June.
The total effect of a flood of new units and tepid apartment demand has been a 140-basis point decline in national average occupancy to finish June at 90%. Given the expectations for deliveries in the back half of the year, it is a virtual certainty that 2023 will close with national occupancy below 90%.
Average Effective Rent and Lease Concessions
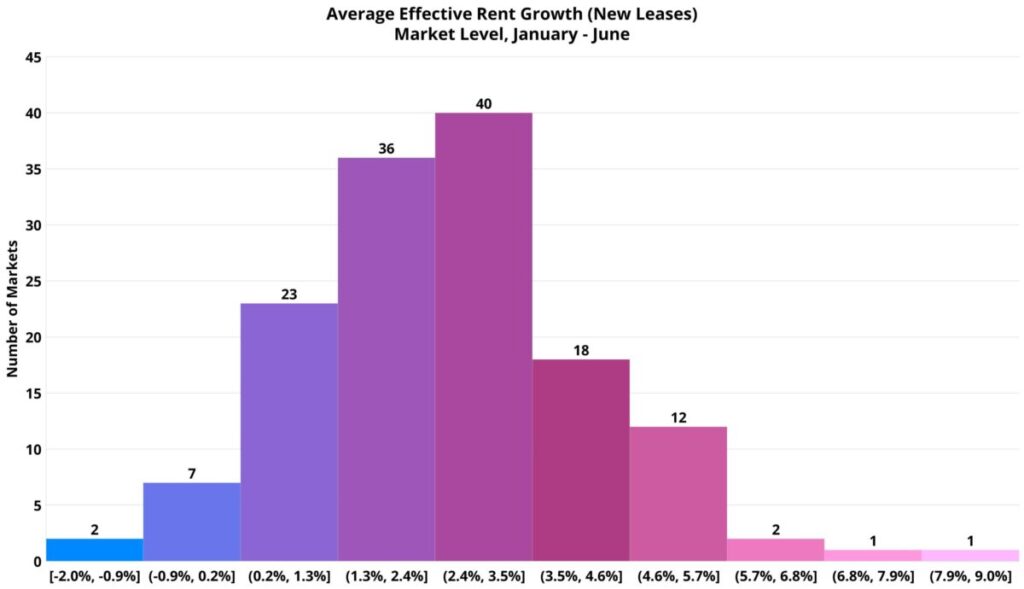
Average effective rent for new leases rose by just under 2% in the first six months of the year. This was below any recent year with the exception of 2022 but was certainly respectable given the absorption and occupancy realities. Effective rent growth has been solidly positive for five consecutive months after briefly moving into negative territory during the winter. More than that, rent growth has ticked up for two straight months – though by a small margin.
Interestingly, only the Class D subset of properties has seen rent growth approach zero. A gain of less than 0.5% in the period was a far cry from last year’s 5% jump in the same period and reflects the struggle on the demand front for a group of properties that suffered a net loss of almost 20,000 leased units through June. At the top of the market, both the Class A and Class B segments managed to add 2% to the average effective rent. Class C was not far behind with appreciation of about 1.5%. Each of those three price tiers saw rent growth in excess in 6% in the same portion of 2022.
As would be expected, the role of lease concessions has continued to grow. An almost 25% increase in the availability of discounts for new residents in the first half of the year meant that around 14% of conventional properties around the country were offering a lease concession at the end of June. That level of availability was a little bit higher than in the years immediately preceding the pandemic, and significantly higher than the trough in availability that occurred last year.
Market Notes
On a net rent basis, accounting for both occupancy and rent change, it has been the smaller markets that have fared better so far this year. In general, less pressure from the construction pipeline and net absorption that has been at least in positive territory has allowed many of these markets to maintain their relatively high occupancies and continue to capture rent growth. Areas like Midland – Odessa, TX, Roanoke, VA, Augusta – Portland, ME, Northwest Arkansas, and Springfield, IL would fit this bill.
On the other end of the spectrum, some markets have struggled with the combination of active deliveries and negative net absorption. For New York and Los Angeles, around 10,000 new units each have been met with a net loss of about 3,200 and 2,400 leased units respectively. Similarly, almost 7,500 new units in Atlanta were delivered as the markets suffered a net loss of approximately 1,100 leased units through June.
Notable in the demand data was the fact that some unusual markets populate the top of the list for net absorbed units through June. Some of this year’s leaders were later to the recovery party in 2021 and did not reach the same dizzying heights with respect to demand or rent growth seen more commonly in the Mountain West and Sunbelt. Chicago has led the way so far this year with about 4,600 net absorbed units. Minneapolis – St. Paul and San Francisco – Oakland followed with around 4,300 net absorbed units each. After that top three, more familiar names such as Seattle, Dallas – Fort Worth and Phoenix populate the list.
Missing from the demand leaders are other typical markets like the aforementioned Atlanta and New York, but also Houston and Washington DC.

Takeaways Episode 45
Takeaways
The first half of the year has been something of a bumpy ride for the multifamily industry. Sluggish demand paired with a significant increase in new supply has led to a steady decline in average occupancy and further momentum coming out of rent growth.
Much is somewhat of an unknown for the back half of the year. The labor market has remained tight, but cracks have begun to emerge. Manufacturing activity and other leading indicators for economic performance have started to soften. The return of student loan payments in October will have an effect on the industry, but to what extent and how widespread the impact remains to be seen. elevated inflation persists, but progress has been made and there is reason to think the decline of recent months may continue.
There is also the issue of seasonality. 2023 had appeared to be reverting to a more-normal seasonal pattern with apartment demand ramping up in the spring out of a slower winter. However, the precipitous decline nationally in June does not fit the usual seasonal pattern. One month could be an outlier, but the June number should be counted as a red flag.
As the second half of the year unwinds, one certainty is that new supply will not be slowing. Expectations are for at least as many new units to be delivered in the final six months of the year as were delivered in the first six months. With the likelihood being that the same symmetry will not ultimately the case for apartment demand – seatbelts should remain fastened.
It’s Budget Season Again!
Property owners and managers must make informed financial decisions for their budgeting process, and the secret to unparalleled success is harnessing accurate, reliable data. Explore the reporting, current and historical data, and the power of ALN OnLine today.
Disclaimer: All content and information within this article is for informational purposes only. ALN Apartment Data makes no representation as to the accuracy or completeness of any information in this or any other article posted on this site or found by following any link on this site. The owner will not be held liable for any losses, injuries, or damages from the display or use of this information. All content and information in this article may be shared provided a link to the article or website is included in the shared content.