A Closer Look at Lease-up Vacancies
It is no secret that new construction has been the major story in multifamily for the last handful of years. In terms of raw units, the volume has been nearly unprecedented. However, when evaluating new supply as a percent of existing capacity volume has been comfortably within the range established since the turn of the century.
View the full monthly Markets Stats PDF
It’s been more than six months since we evaluated the construction pipeline and how markets around the country are dealing with the new units, so let’s take a closer look. All numbers will refer to conventional properties of at least 50 units.
Vacancies
Before getting to the current construction pipeline it’s helpful to evaluate how markets have fared with recent new supply. As recently as the annual period from February 2017 through February 2018 a dozen of the 51 largest markets had total vacancies accounting for more than 10% of the market’s existing capacity. That list is now down to four markets – Oklahoma City, Houston, San Antonio and Louisville. Furthermore, none are higher than the 11.4% in Oklahoma City.

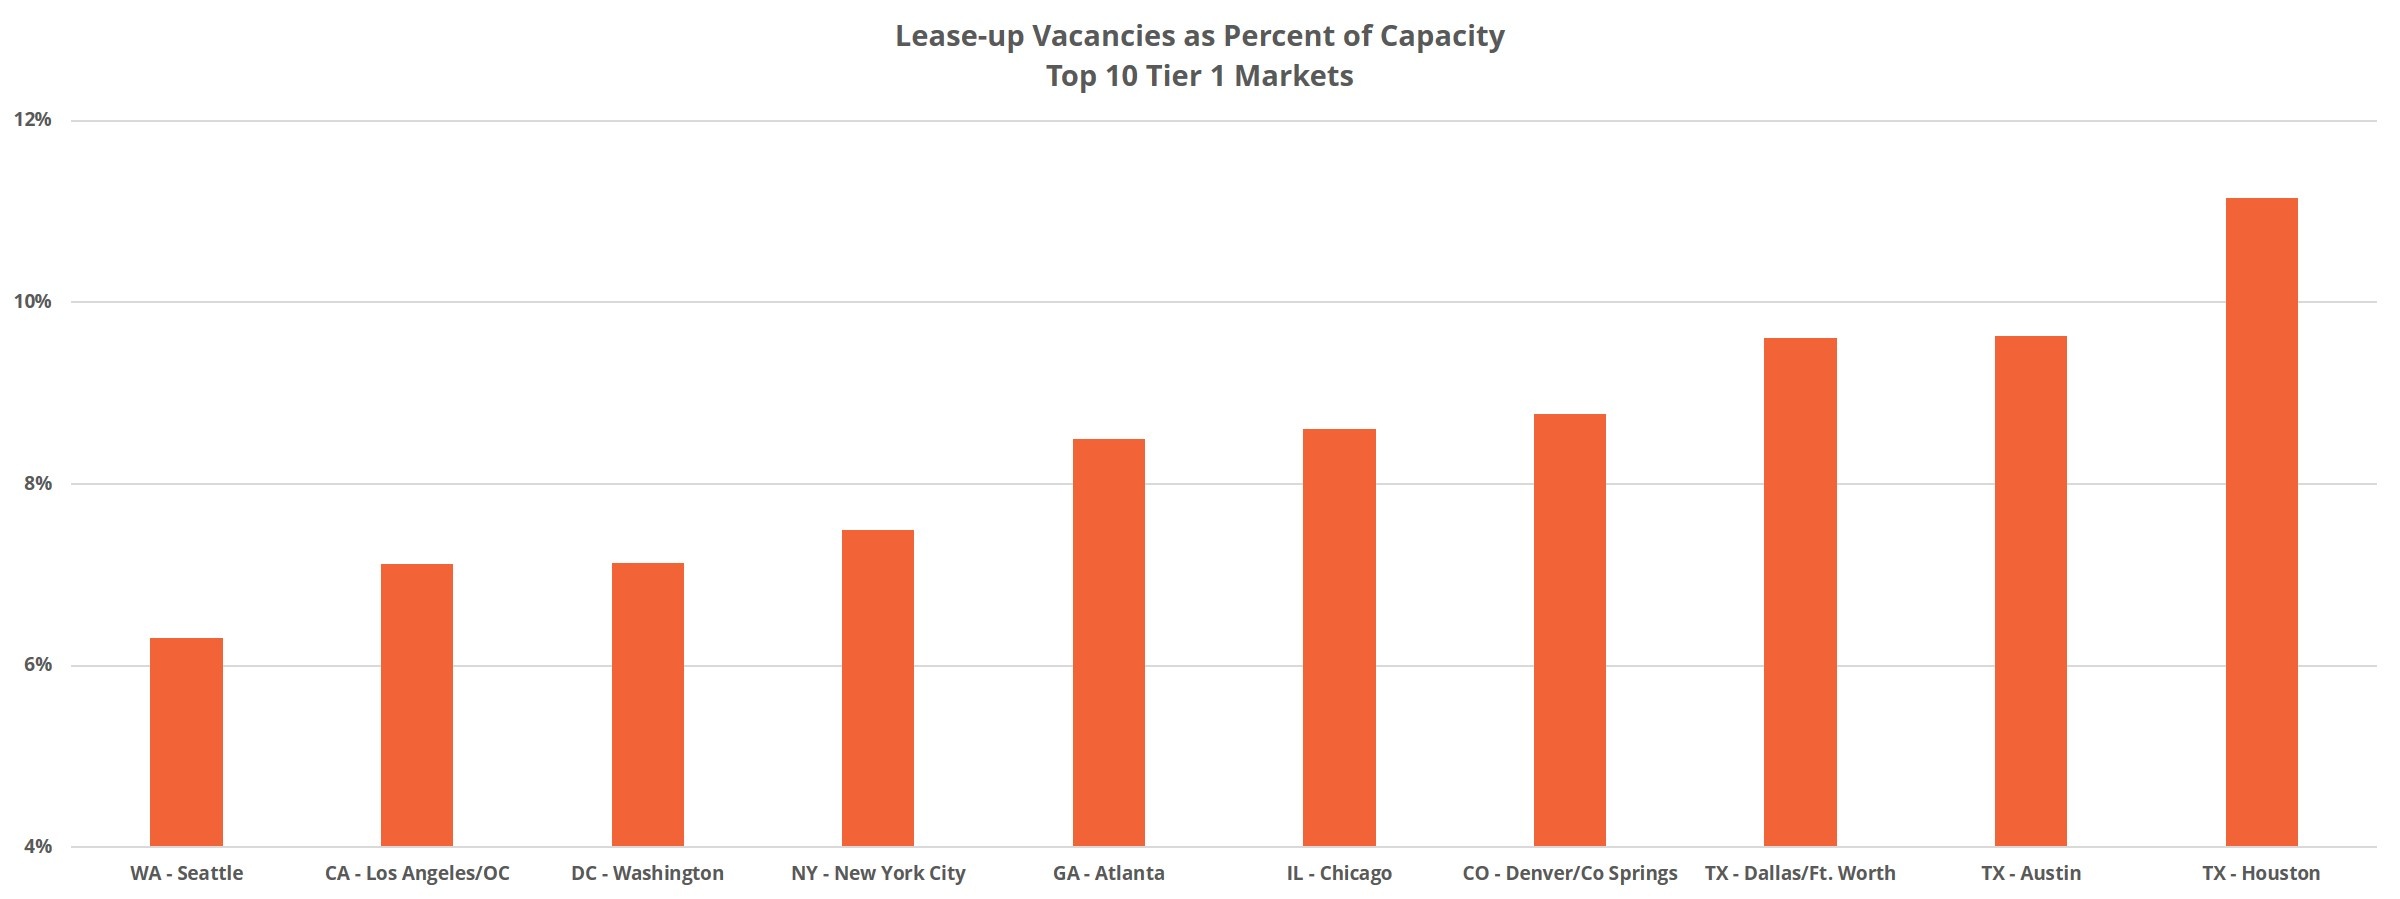
In terms of vacancies only within lease-up properties, six markets have at least 10,000 vacant units. These markets in descending order are Los Angeles -Orange County, Dallas – Fort Worth, New York City, Houston, San Francisco – Oakland and Washington DC. Chicago narrowly missed the cutoff with more than 9,950 vacant units in non-stabilized properties while LA tops the list with more than 21,000 vacancies.
At first glance it may come as a surprise to see Los Angeles atop the list given the housing supply issues in California, but after considering that the average effective rent per unit in these lease-up properties is $700 more per month than the already high overall market average, it begins to make sense.
Vacant Units and Net Absorption
Of course, vacancies are not necessarily a bad thing when it comes to lease-up properties – lease-ups don’t happen overnight. A useful point of context is to bring net absorption* into the mix. The same six markets previously mentioned have an average of two and a half years’ worth of lease-up absorption sitting as vacant lease-up units using the absorption of the last 12 months as an estimate.
In this metric, Houston has the highest value at 3.1 years followed closely by New York at 3 years. Coming out best is the DC area which has 1.3 years’ worth of absorption currently vacant in new non-stabilized properties.
These numbers reflect the current backlog of new units. They don’t account for supply still on its way.
Under Construction Units
Under construction properties represent units that will be delivered regardless of circumstance, whereas pre-construction projects can be delayed or cancelled if market conditions change. We typically expect new construction properties to enter the market within two years. Currently, there are more than 610,000 conventional units under construction nationally.
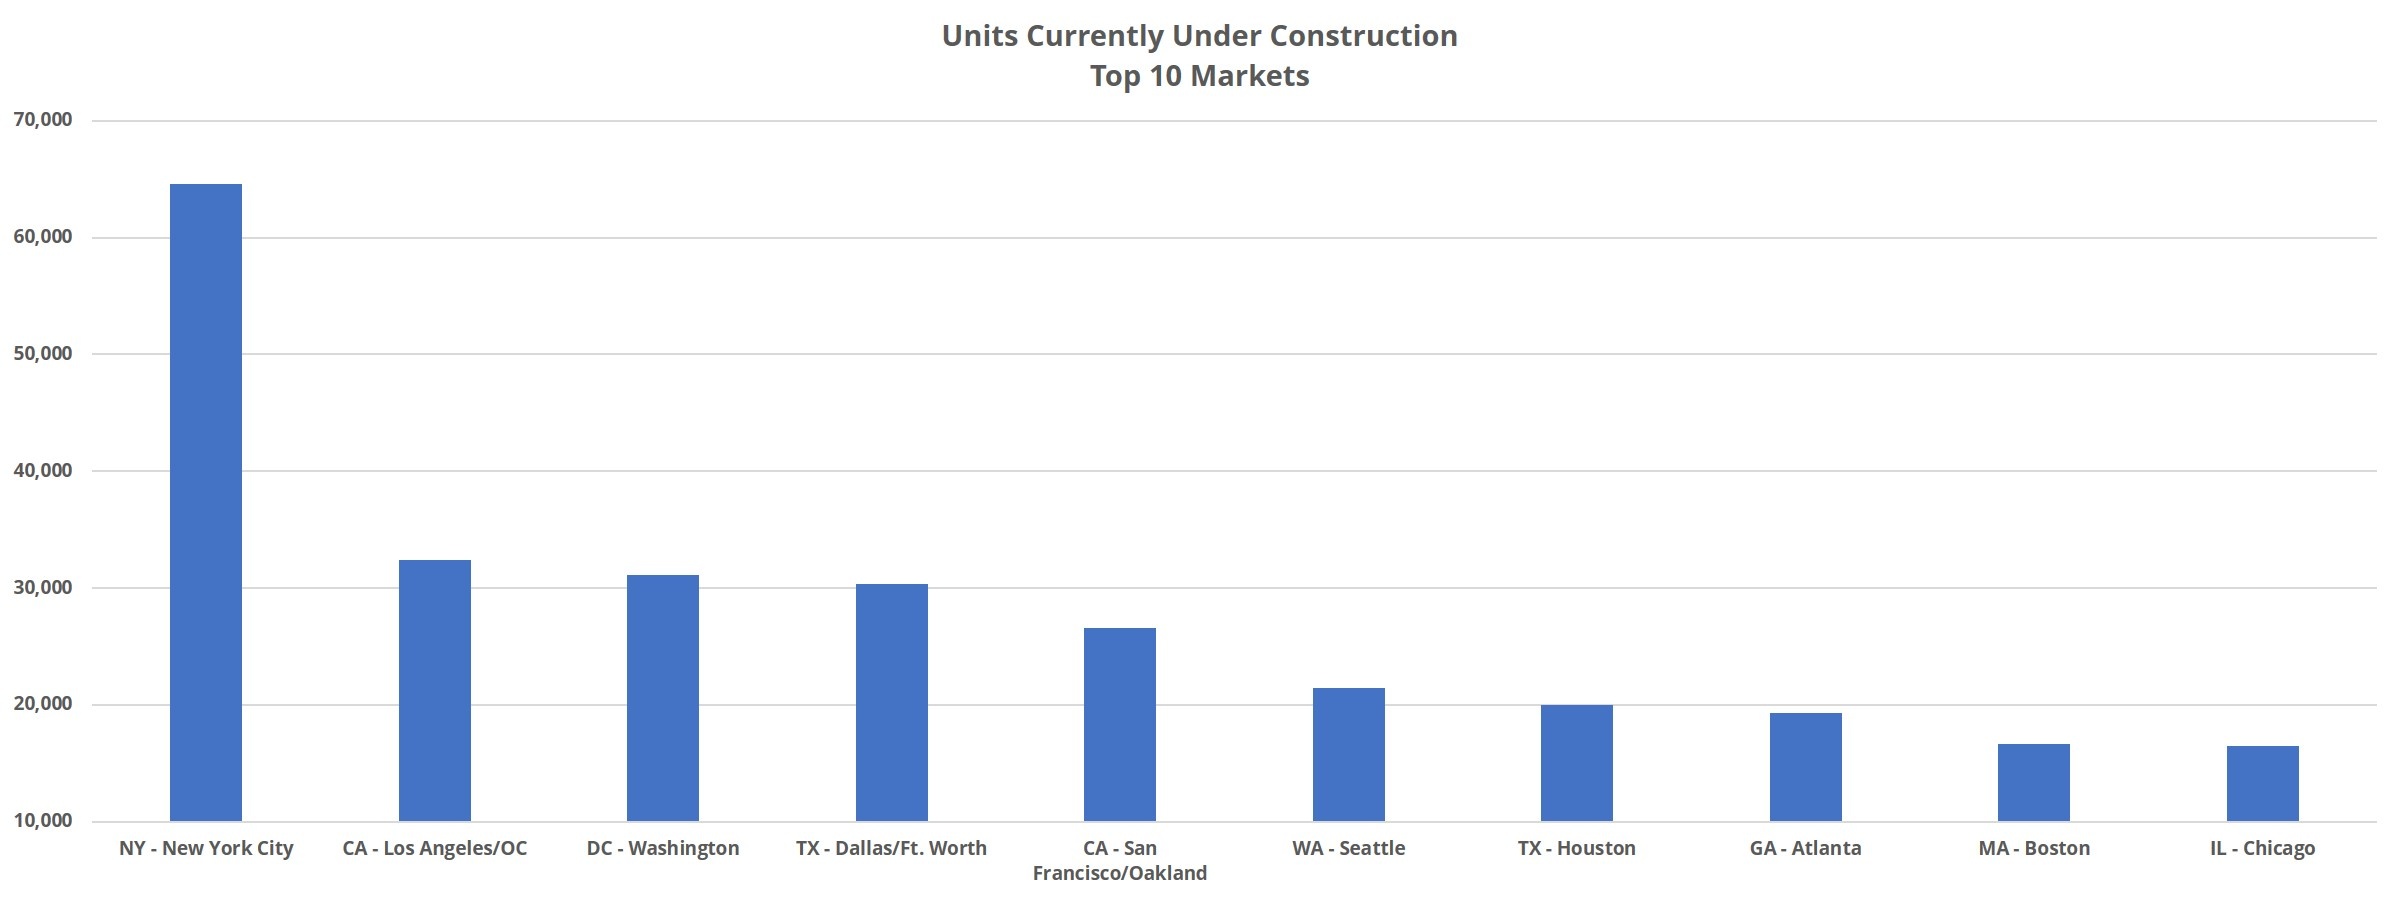
The top markets for under construction units contain some familiar names. In descending order, New York City, Los Angeles – Orange County, Washington DC, Dallas – Fort Worth and San Francisco – Oakland round out the top five markets. New York leads the way with just less than 65,000 units being built and the Bay Area ends the list with a little more than 26,000 units. Other areas to meet the 20,000-unit threshold are Seattle and Houston.
Under Construction Units and Net Absorption
Because the new supply yet to be delivered represents more units than the current lease-up vacancies in these markets, a similar metric accounting for the units relative to total annual net absorption results in even higher values here. The average value is 3.8 years’ worth of new supply, again, using the last 12 months of demand as an estimate. The highest value is in the Bay Area, with 6.8 years. The lowest value is Dallas – Fort Worth at 1.3 years.
Moreover, consider that total absorption in any given market is split between lease-up properties and existing properties. Given this, evaluating upcoming deliveries relative to total demand leads to an overestimation of demand likely to be found amongst units under construction when they are introduced to the market. If demand over the last 12 months within only new non-stabilized properties is used, the metric rises further for each market. These new values top out at 10.7 for New York and the lowest value is 2.9 years’ worth of new supply in Dallas – Fort Worth.

Takeaways
The six markets with the most lease-up vacancies can be split into two groups – those with demand mostly within new properties, and markets with demand split evenly between lease-ups and stabilized properties. Dallas – Fort Worth, New York City and Houston fall into the latter group while the Bay Area, Los Angeles and Washington DC fall into the former.
For areas like Dallas – Fort Worth and New York, where annual net absorption has regularly surpassed 15,000 and even 20,000 units over the last few years, the impact of these new units on occupancies and rent growth is likely to be less of a headwind. However, the number of units under construction in New York is more than double any other market at this time and will undoubtedly have a short-term negative impact on occupancies.
In areas like the Bay Area and LA, aside from LA in 2017, absorption has typically been less than 10,000 annual units. New units in those markets are doing nothing to address the affordability issue while still providing headwinds for occupancies. One mitigating factor for occupancies is that absorption in these markets is heavily skewed toward the new units. While not enough to keep pace with new supply, at least the new units are being met with some demand.
Multifamily demand appears likely to continue to rise due to a confluence of factors the industry has going in its favor. However, there is an increasing delta between rents in new properties and those found in existing properties, and this difference is especially pronounced in some markets.
In specific areas around the county, the volume is mostly aligned with fundamental demand, but increasingly misaligned with respect to price. Higher and higher rents in already expensive markets limit the pool of potential new residents that haven’t simply been poached from other top-tier properties more and more. It also has to be mentioned that the coronavirus presents a wildcard and time will tell what the overall economic impact will be and how those impacts will affect multifamily.
*Net absorption (or absorption) refers to net change in the number of rented units
Disclaimer: All content and information within this article is for informational purposes only. ALN Apartment Data, Inc. makes no representation as to the accuracy or completeness of any information in this or any other article posted on this site or found by following any link on this site. The owner will not be held liable for any losses, injuries, or damages from the display or use of this information. All content and information in this article may be shared provided a link to the article or website is included in the shared content.

