Q1 2020 Multifamily Performance
The topic on everyone’s mind in Q1 in the multifamily industry and beyond is COVID-19 and the response to it. In addition to the helpful resources and content being released by NMHC and countless others, ALN has addressed the topic on our blog both with stand-alone posts as well as an ongoing series.
In this space though, we’ll stick to our regular programming and take a look back at some standout results from the first quarter. Some areas were affected earlier than others by shelter-in-place orders and the like, but for the most part, a majority of the opening quarter of the year was carried out under relatively normal market conditions. All numbers will refer to conventional properties of at least 50 units.
View the full monthly Markets Stats PDF
Q1 Nationwide View
Before getting to some specific markets that stood out to open the year in terms of new supply, demand and rent change, let’s take a look at the nation as a whole for some context.
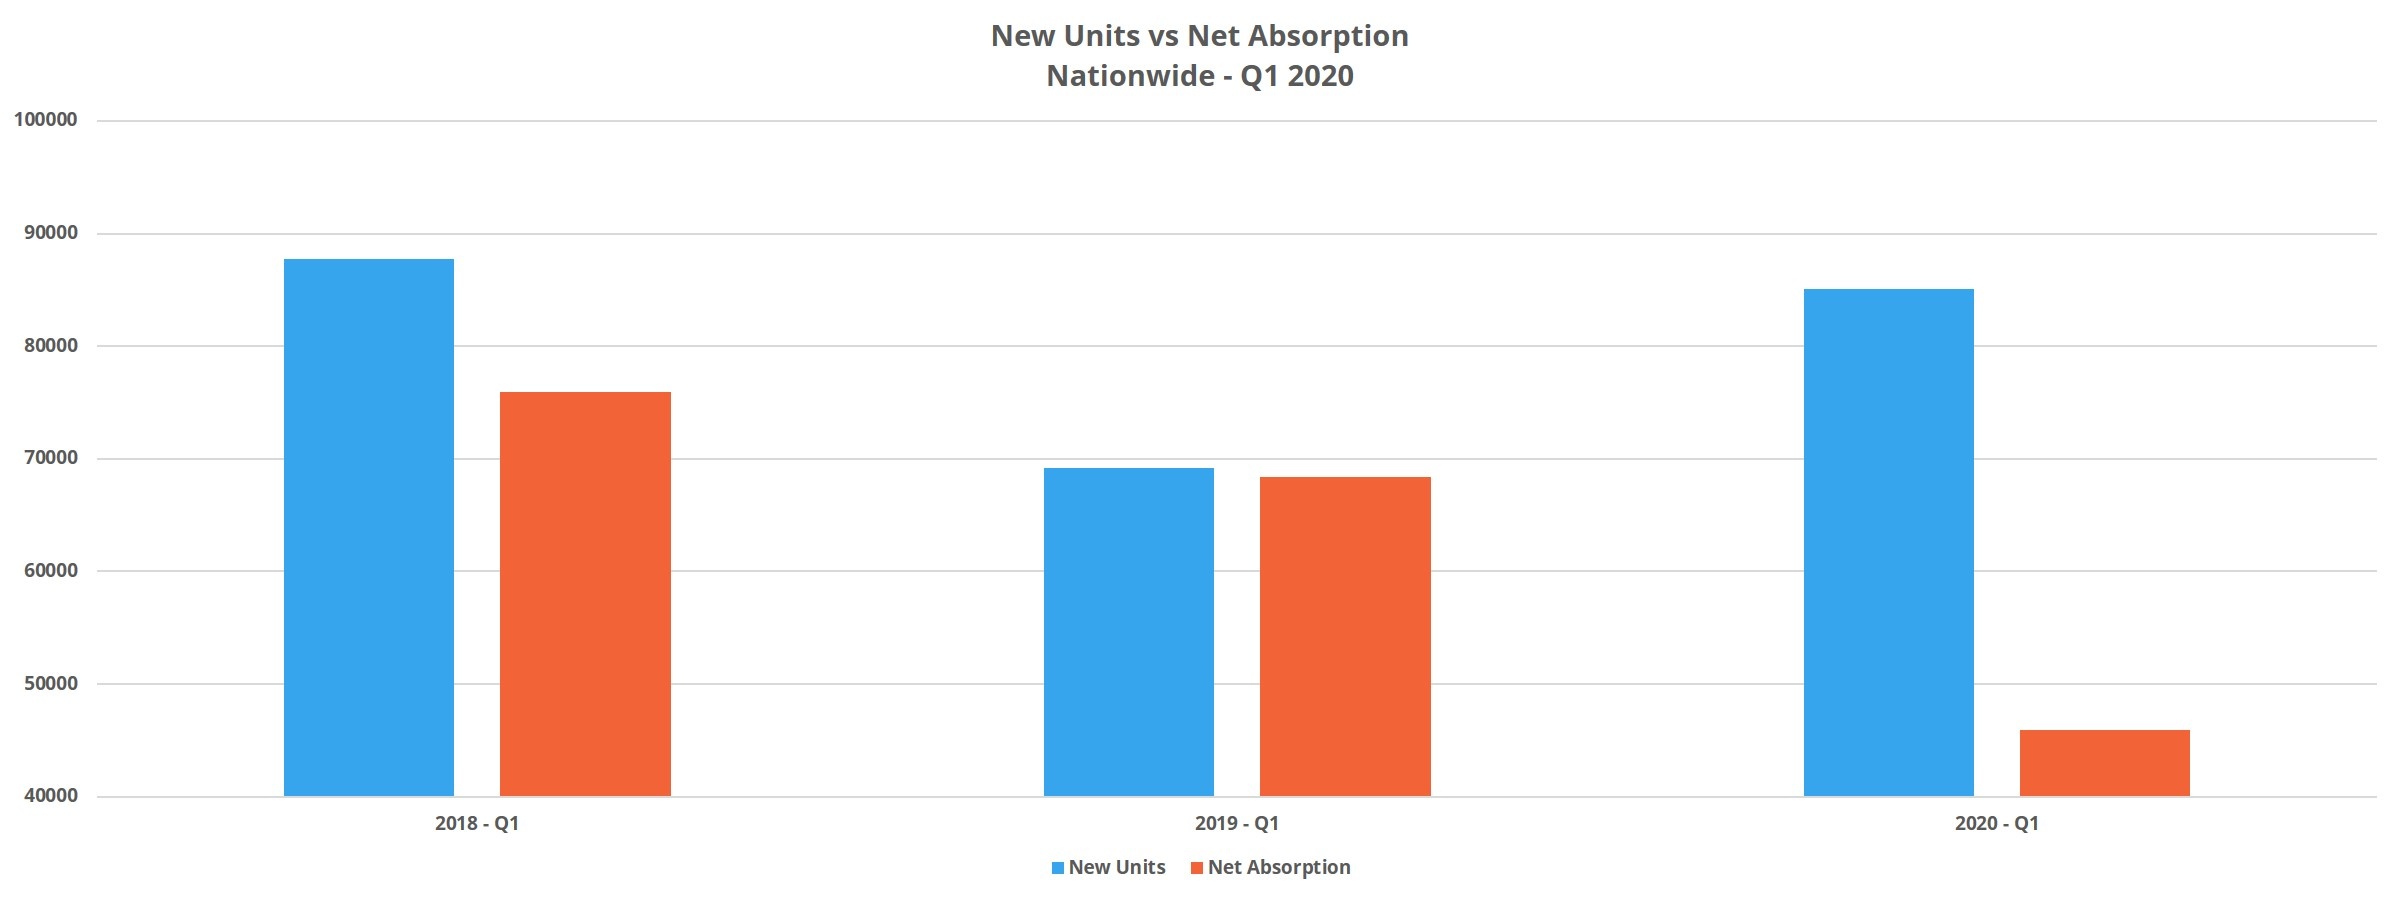
Just over 85,000 new units were delivered in Q1 which was well above the approximately 69,000 new units from the same period in 2019. For the third consecutive year, quarterly net absorption fell – finishing March at just below 46,000 units. For reference, net absorption was about 68,000 units in Q1 2019 and 76,000 units in Q1 2018. This year’s figure was no doubt negatively affected by COVID-19 but is also part of a multi-year trend of declining first quarter demand. As a result, national average occupancy declined by 0.4% to end March at just below 92%.

Average effective rent gain was about 1%. This is on par with last year’s result but short of the 1.3% quarterly gain in 2018. The average unit was leasing for $1,373 at the end of the quarter. The availability of rent concessions rose slightly in the period with just over 16% of conventional properties offering a discount. The average value of the discount, calculated only from those properties offering one, declined marginally to three weeks off a 12-month lease.
Q1 New Supply
As has become the norm, the Dallas – Fort Worth market must be put in its own category for new supply. More than 7,500 new units were delivered in the first three months of the year. Other Texas markets show up on the list of highest supply volume as well. Houston delivered the second most new units nationally with about 5,100 new units and the Austin area introduced just over 3,100 new units.
Other high-volume markets include Washington DC and Atlanta, with about 4,000 and 3,500 new units respectively.
When adjusting for market size by evaluating new supply as a percentage of a market’s existing supply, other markets stood out. Midland – Odessa, after a prolonged period of extremely high occupancies and the most expensive average effective rent in Texas, added units that accounted for 2.9% of the market’s existing stock. Similarly, Miami added 2.6% of existing supply in new units in the quarter. The Huntsville area added 2.3% of capacity in new supply.
Net Absorption and Average Occupancy in Q1
The Dallas – Fort Worth area also led the nation in first quarter net absorption, with about 4,500 newly rented units. Seattle managed second most by leasing around 3,500 previously unoccupied units. Other leaders were Washington DC, Los Angeles and Chicago. Each absorbed between 2,600 and 2,700 units in the period.
Looking at net absorption as a percentage of market capacity as of the end of Q1, so as to include new supply, brings some other markets into focus. Two small markets with very strong demand relative to the size of their multifamily presence were Bismarck, North Dakota and the Augusta and Portland region in Maine. Bismarck absorbed nearly 600 units in the quarter, which represents 10% of its overall supply. The Augusta and Portland area leased more than 550 previously vacant units, accounting for more than 8% of the area’s total capacity.
Illustrating how strong the results were in those two areas, the next highest markets are Fort Myers – Naples at 3.5% and Myrtle Beach at 3%. Two midwestern markets each came in just above 2.5% – Moline, Illinois and Madison, Wisconsin.
Average Effective Rent and Concessions
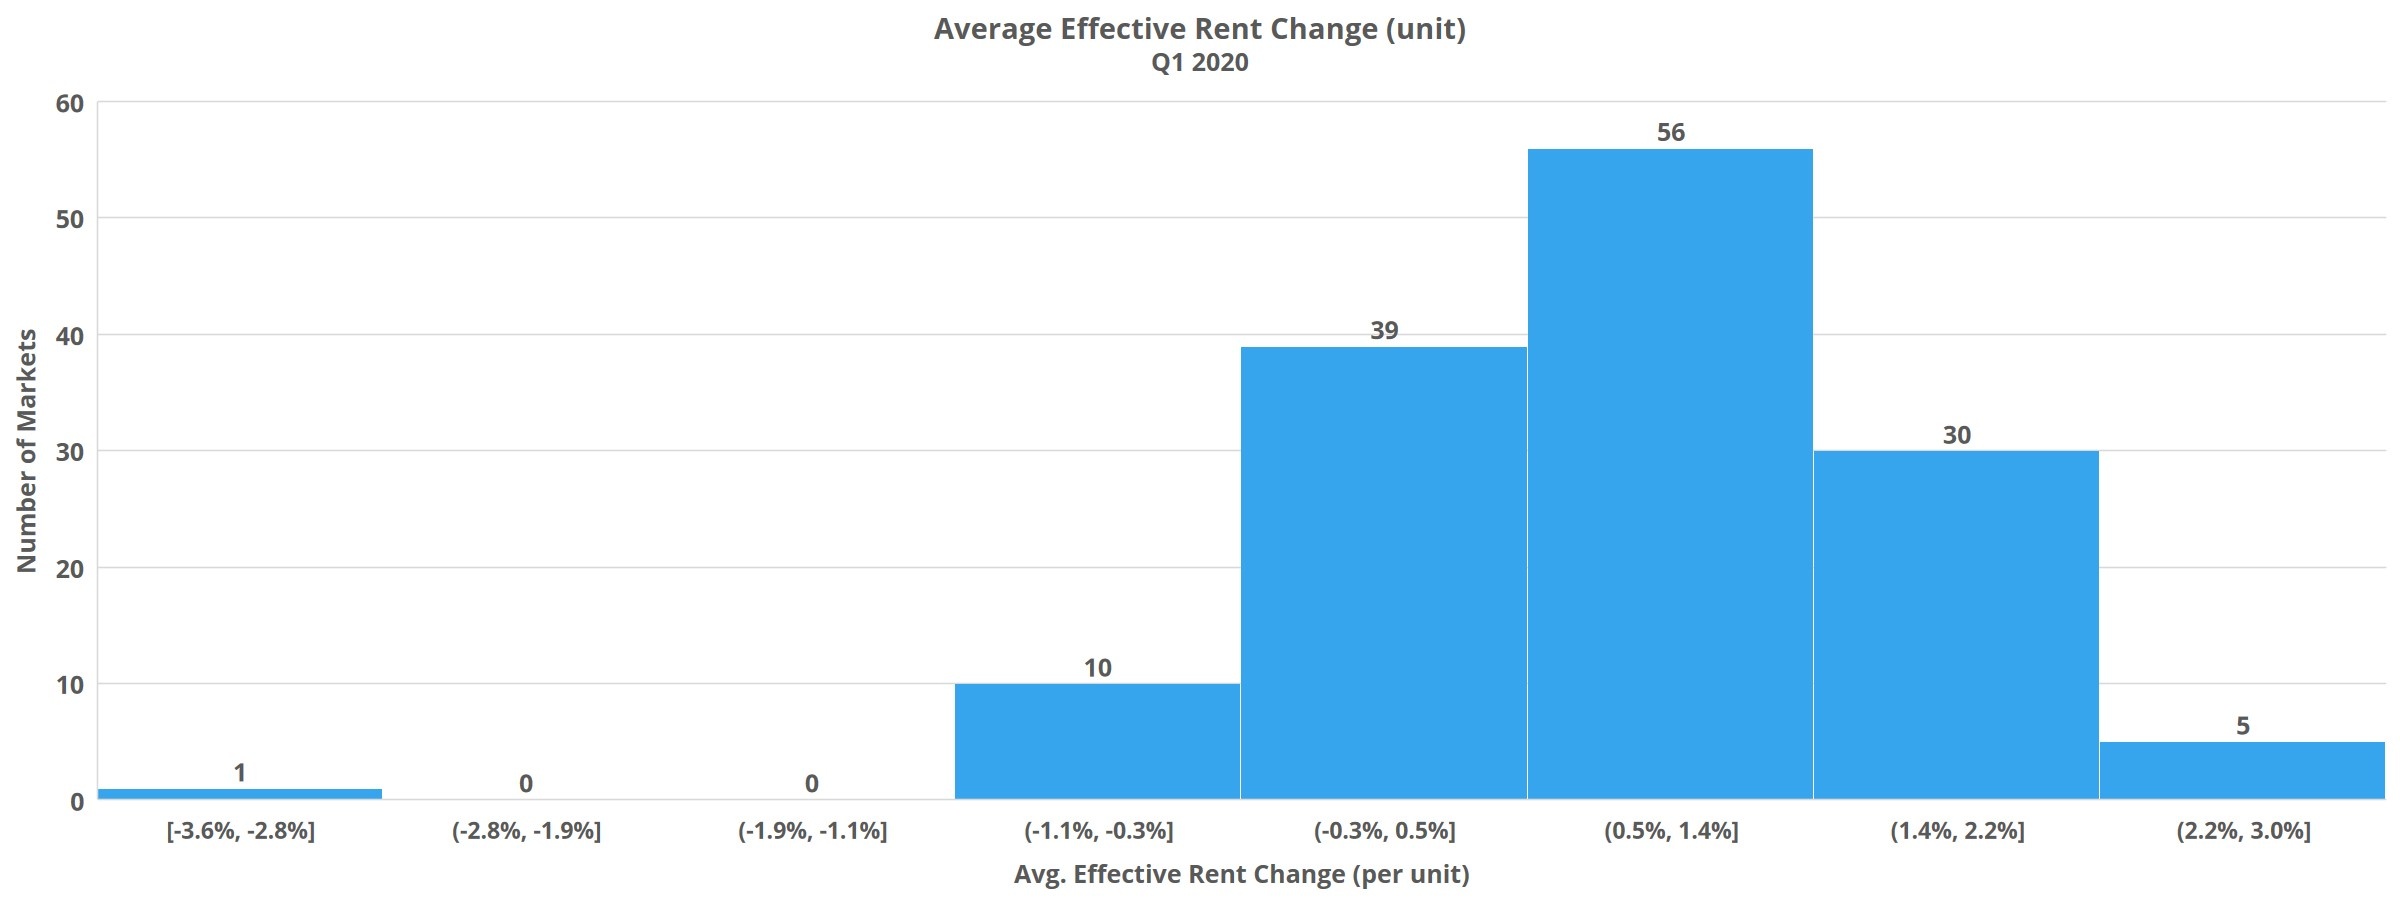
Smaller markets led the way in average effective rent gain to start 2020. Honolulu gained 3% bringing the average unit to $1,842 per month. Concord, New Hampshire was just behind with a 2.9% appreciation in the quarter to cross $1,400 at the average. Other strong performers were Springfield, Massachusetts and Mobile, Alabama – with gains of 2.4% and 2.3% respectively.

Of the larger markets with at least 150,000 conventional units, the 2% gain in the quarter for Phoenix was the highest average effective rent increase. Both Denver – Colorado Springs and Detroit managed 1.5% growth and areas like Tampa and Austin trailed just behind at 1.4%. Of the 26 ALN markets above the 150,000-unit threshold, half failed to reach 1% growth. Orlando earned the unhappy designation of being the only market to suffer a rent retraction in the period, with a loss of 0.25%.
Q1 Performance Takeaways
Q1 of 2020 ended under the massive shadow of COVID-19 and the response to it. However, while it may be tempting to attribute first quarter multifamily results to these factors, the data does not necessarily support that conclusion. Nationally, 36% of quarterly absorbed units came in the month of March, when the economic impact of shelter-in-place and social distancing policies really began being felt.
Additionally, average effective rent rose by 1% in the quarter, but that figure was at only 0.6% at the end of February. So, it’s not as if a terrible March eroded gains from earlier in the quarter. However, it should be noted that these nationwide generalizations don’t hold true in all cases at the market level.
In large markets like Los Angeles, Philadelphia and Chicago net absorption was higher after January and February than it ended up being to finish the quarter. On the average effective rent side, about 15% of markets saw retractions, almost exclusively in small markets.
New supply and average occupancy, despite the continued and increased decline in net absorption, finished Q1 comfortably within the range established by the three most recent opening quarters. Average effective rent growth, though not reaching the stellar levels of 2015 or 2016, nonetheless rose at a respectable pace. The second quarter is likely to be a rough one, but overall, the multifamily industry entered this period of uncertainty from a solid position.
For more specific information on individual markets, be sure to see our brand new Quarterly Market Reviews.

