Price Class: Nationwide Multifamily Performance
One of the ways to evaluate multifamily performance is to look at the usual metrics through the lens of price class rather than just by geography. This month, let’s consider the year-over-year nationwide performance of the ALN price classes—a period from July 2017 through July 2018.
View the full monthly Markets Stats PDF
Property Class is a subjective classification and can change from market to market. Every professional in the industry could have a slightly different definition or perception of what a Class A or a Class C property is, depending on any number of factors. As a result, ALN assigns conventional properties to a **price class depending on each property’s average effective rent per square foot percentile within its market. This allows for a clearer apples-to-apples comparison of market segments around the country.
The Nation
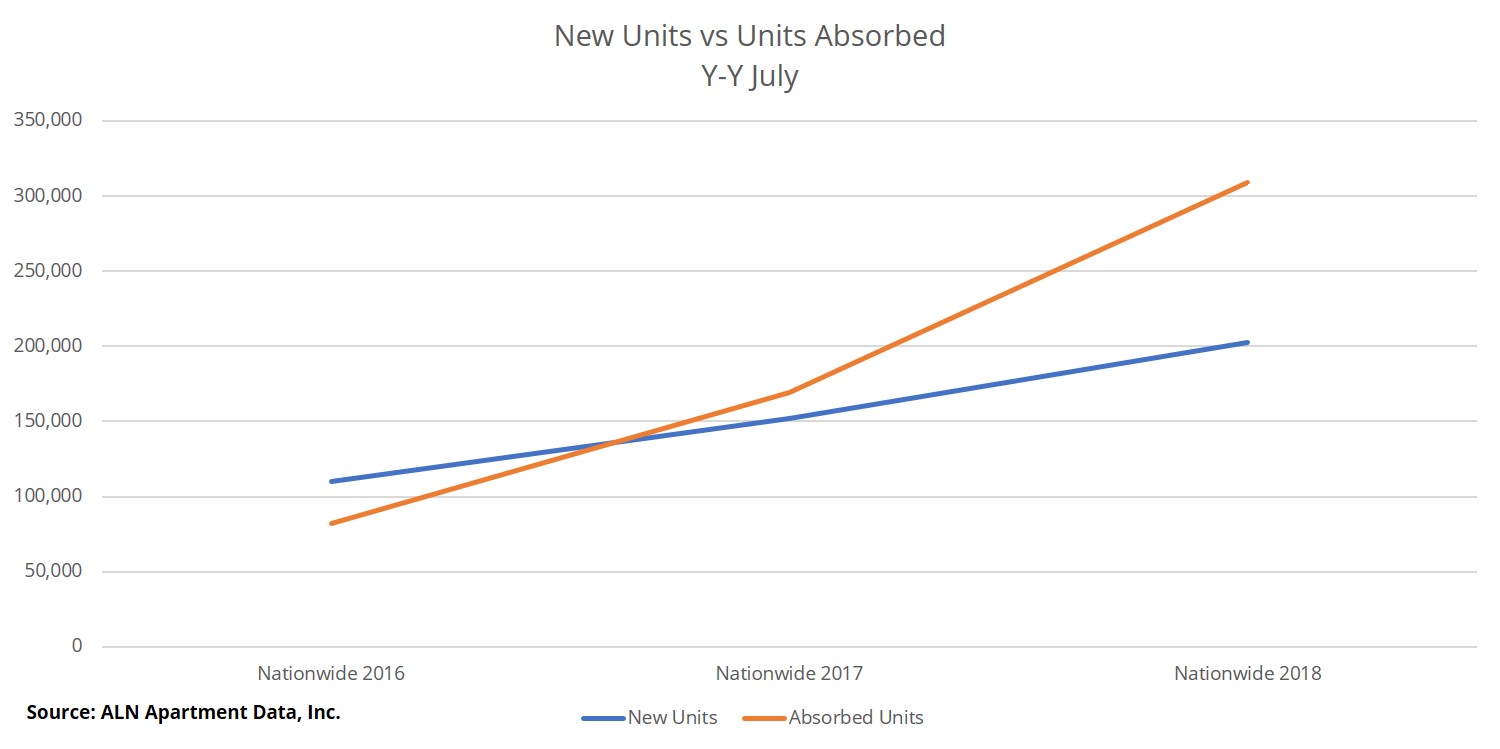
The last 12 months have been stellar for *net absorption. During the period, more than 309,000 new units have been rented. For context, the figure for the previous 12-month span was just over 169,000 units. About 82,000 units were absorbed from July 2015 to July 2016. Interestingly, not only have the raw absorption numbers increased over the last three periods, but the difference between the newly rented units and the new supply has also increased. This has occurred despite levels of new deliveries not seen in decades.

Price Class A
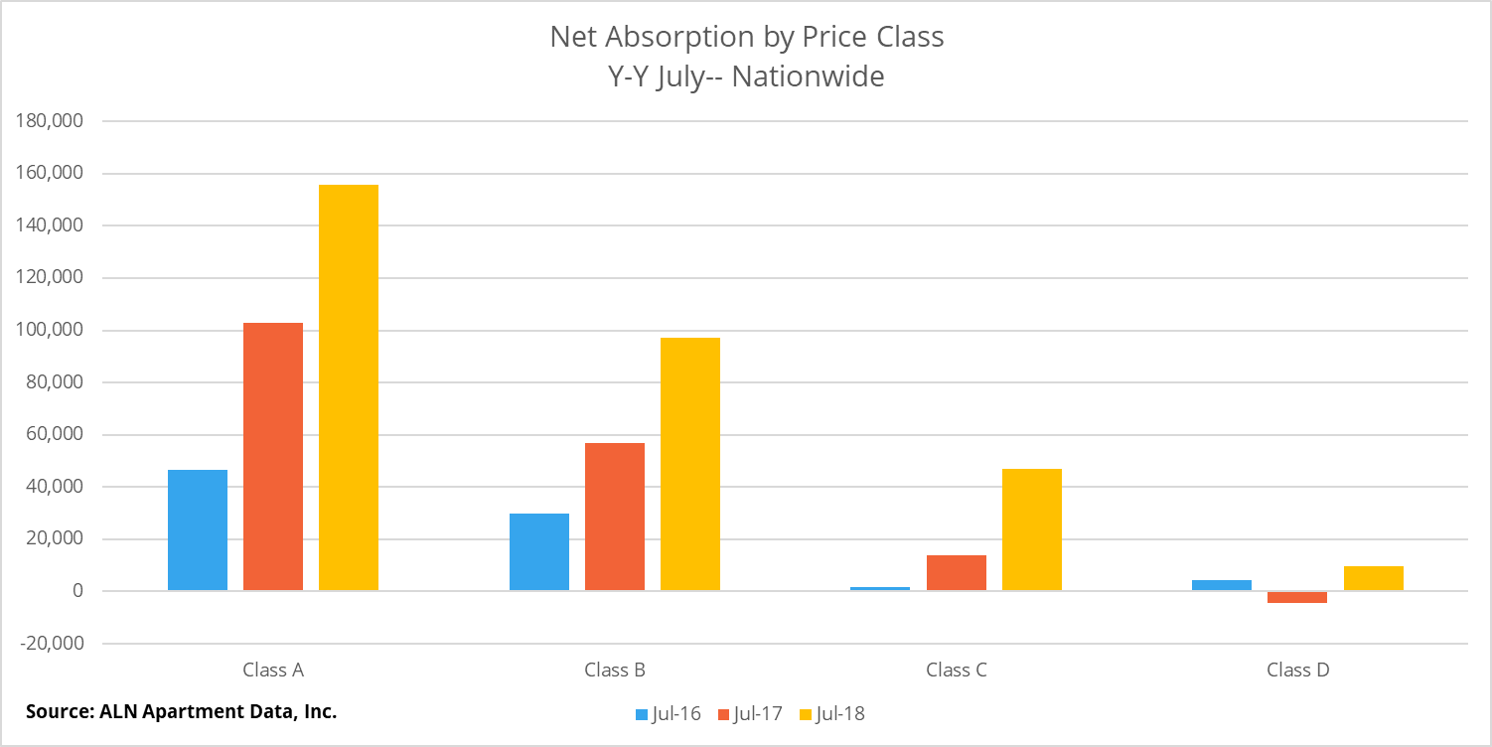
Price Class A properties have absorbed just over 155,000 units in the last 12 months. Combined with the introduction about 93,000 new units during the same time frame, this resulted in an average occupancy of 86.7% for the class to end July. This represents a 7% improvement in average occupancy, by far the largest gain of the last three year-over-year periods.
It would be expected that most of this improvement was due to the lease-up properties in this price tier. When looking at only stabilized properties, average occupancy has been flat over the last 12 months. Nearly half of ALN’s 180 markets lost ground. However, the average nationally for these stabilized properties was a respectable 93.7% to end July.
While absorption numbers have been racing up, average effective rent for this tier has not done the same. In the last 12 months, average effective rent per square foot rose by 4%. This growth is nothing to sneeze at but failed to reach the 8% gain for the same period from 2016-2017.
We’ve seen the stabilized properties do a little better here during the period, achieving 5.2% appreciation. This is the result of fewer stabilized Class A properties offering a rent concession package than lease-up Class A properties.
Price Class B
The second price class gained nearly 100,000 net rented units nationally year-over-year. This also represents a huge leap from the previous 12-month period—a 70% improvement in fact. As recently as July 2015 to July 2016, that figure was only 30,000 units. Average occupancy for Class B properties ended July at 92%, a 1.6% improvement year-over-year. Not as gaudy as the top tier to be sure, but even this gain was double the previous period.
A few markets stood out in terms of average occupancy gain. Both the Miami-Ft. Lauderdale and Milwaukee markets gained about 8% in this price tier, taking them from about 84% to above 90%. The Austin metro rose in excess of 6% to approach 90%, and the Hartford area managed 4% to end July 94% occupied.
Average effective rent among the Class B properties rose 3.5% for the term. As with the top tier, this was a little bit of a retraction from the growth of the previous term. A few markets stood out here as well. The Orlando area saw effective rents rise 7.5%. Both Houston and Honolulu realized gains of around 6.5%, and the Springfield, Massachusetts market topped 5%. Interestingly, by receding by 1.3%, the New York City market was the only major market to lose ground in this price tier.

Price Classes C and D
Average occupancy change switched from negative to positive for both the bottom two price tiers over the last 12 months. Thanks to net absorption more than tripling for Class C compared to the previous year-over-year period, average occupancy rose by 0.4% to end July at 94% nationally. Similarly, in the Class D segment, net absorption went from a loss of nearly 4,500 to a gain of nearly 10,000 for the last 12-month period. The result was on average occupancy improvement of nearly 1%.
Average effective rent growth was also better in both market tiers over the last year than in the previous two annual periods. Class C realized a gain of 3.2% and Class D properties managed a 2.75% appreciation.
Final Takeaways
Demand continues to be very strong in each price class. For the most part, net absorption and average occupancy gains were better over the last 12 months than in either of the previous two annual periods across all four price tiers. As new units continue to flood in, there is still no ground being given up nationally when it comes to occupancies.
Effective rents on the other hand, are increasing at a slower pace—at least at the top of the market. We’re seeing the opposite in the bottom two tiers though, as rent continues to climb as the availability of rent concessions decreases. Demand is going strong, but there’s only so far for rents to run.
*Net absorption is the net change in newly rented units
**Class A is the top 12% of properties, Class B is the next 20%, Class C is the next 38%

