

Rent Growth Broadens, but Concession Pressure Persists
The multifamily industry has regained some footing this year. Reduced new supply and strong net absorption have allowed for the occupancy improvement that first began last year to continue. After several years in which new supply weighed on both occupancy and rent performance, that change has been vital.
More recently, attention has turned to positive indicators in the rent environment, and optimism for a 2027 turnaround in rent growth has risen. While there is cause for some optimism relative to rent performance over the last four years, important caveats remain relevant.
A pertinent question is how much of this recent optimism is already supported by measurable improvements, and what still needs to happen for the gains to become durable?
Methodology notes: All figures refer to conventional properties with at least 50 units. Rent measures include asking and effective rents for new leases.
View the full monthly Markets Stats PDF
Rent Growth Improvement Is Widespread
Rent performance over the last three months provides a clear positive signal. Two-thirds of the 138 markets analyzed had stronger trailing-three-month average effective rent results in October than in October of 2025. The improvement was widespread rather than concentrated in a handful of markets.
During the trailing three months through October 2026, 84 markets recorded positive average effective rent growth, compared to just 60 during the same period a year earlier. Across the 138 markets, the median improvement in three-month effective rent growth was approximately 0.63 percentage points year-over-year, with 71 markets improving by at least half a percentage point.
Improvement is Not the Same as a Recovery
Three-month rent change is more a measure of momentum than of a sustained shift in underlying trends. Zooming out to evaluate the last year provides some perspective on the more recent positive results.
National trailing-twelve-month average effective rent growth was 1.3% in October, compared to 2.4% in October 2025. Importantly, just one month earlier, trailing-year rent growth stood at only 0.6%.
That sharp increase deserves some context. It was not the result of especially strong rent growth during October. In fact, average effective rents declined 0.2% for the month. Instead, much of the improvement reflected a favorable year-earlier comparison. October 2025 saw a considerably steeper monthly rent decline of 0.8%. As that decline rolled out of the trailing-twelve-month calculation and was replaced by the more modest decline this October, the annual growth rate increased substantially.
The smaller October decline represents a meaningful improvement over last year’s performance, but the resulting increase in trailing-year rent growth should not be mistaken for a sudden acceleration in current rental rates.
Effective rent gains have also been skewed toward mature stabilized properties. For properties that have stabilized within the last two years or are currently in lease-up, average effective rents declined 1% over the last year, while concessions were more widespread and generous.
All of this points to short-term improvement in rent performance across much of the country, but not yet a return to the stronger annual performance observed a year ago.
Lease Concessions Remain a Recovery Obstacle
The lease concession environment and its impact on multifamily performance metrics this year have been a common topic of ALN analysis. The consistent proliferation of discounts has been an important qualification to strong absorption figures over the last 18 months and has played a major role in rent performance trends.
Lease concession availability has been on the rise since 2022, but after last year’s strong absorption was able to outpace new supply, there was some question as to whether 2026 would be the year to begin the drawdown. That has not transpired despite another significant decline in new supply.
85% of markets across the country finished October with discount availability higher than in October of 2025. In more recent months, concession availability increased between July and October in 104 markets compared to just 68 last year.
Nationally, nearly 30% of properties closed October offering a lease concession for new residents – the highest share in more than a decade. A 2.5-percentage-point increase from September to October was the largest month-over-month increase during the current four-year uptrend by a wide margin.
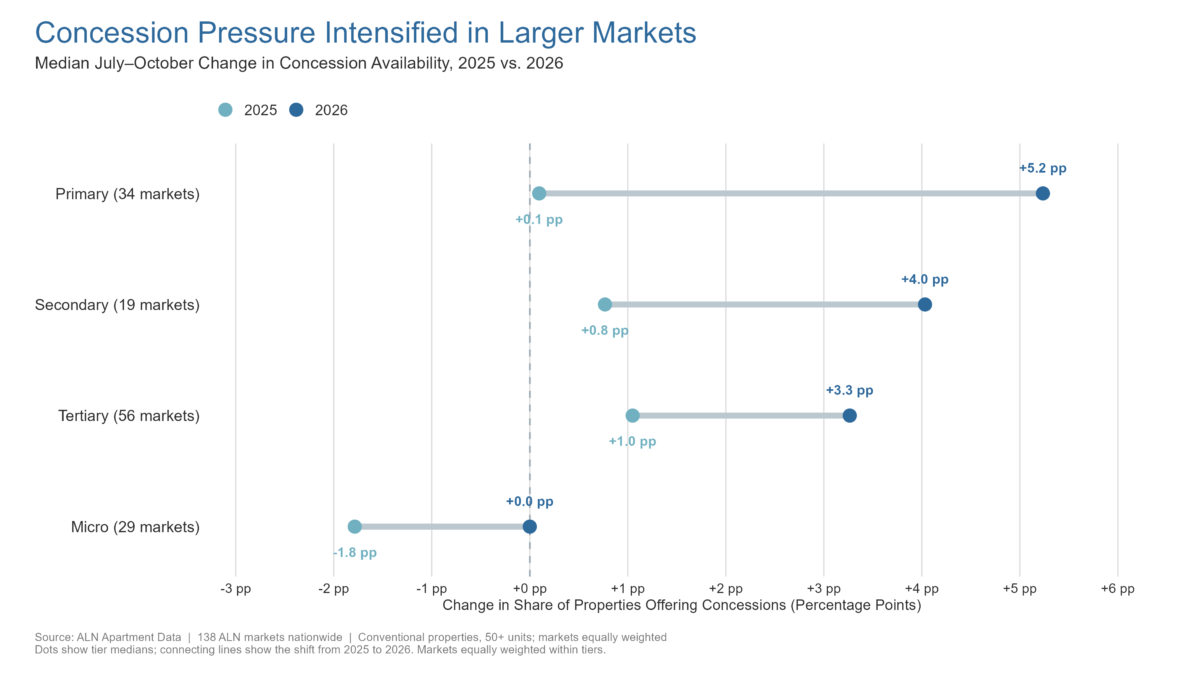
The effect of lease discounts is most pronounced within newer properties, but it is not limited to that portion of the market. 60% of properties in active lease-up were offering an incentive in October, up from 41% in October 2025. For properties that stabilized within the last two years, discount availability rose more modestly from 37% to 42% over the last year. Among mature stabilized properties – the largest share of existing stock – availability ended October at 24%.
The average incentive value is also largest for the newer properties. Lease-up properties feature an average of 6.4 weeks off an annual lease compared to 5.7 weeks and 3.9 weeks for recently stabilized and mature stabilized, respectively.
What Today’s Conditions Suggest About 2027
Next year is likely to bring further bifurcation in market performance, a trend that has grown this year. New deliveries for 2026 are expected to come in at around 315,000 units nationally. Next year, around 400,000 new units are anticipated.
The decline in new supply in 2025 and again in 2026 from a 2024 peak has created much-needed breathing room for absorption and the resulting occupancy firming. With supply poised to rise again next year, though still well below its 2024 level, some of that breathing room may be winnowed away.
Of course, not every market will see an increase in new supply, and not every market that sees an increase will be facing supply pressure. However, there is a subset of markets that are more at risk of falling behind the broader recovery cycle that has played out across much of the country in 2025 and 2026.

As 2026 comes to a close, attention is shifting from year-end planning to the decisions that will shape 2027. ALN Apartment Data is here to help.
This group includes markets less commonly associated with new supply risk, such as Boston, Pittsburgh, and Richmond. For these areas, moderate upcoming supply could be a challenge given the demand environment. Other markets such as Charlotte, Miami – Ft. Lauderdale, Salt Lake City, Austin, and Raleigh-Durham are still amid an elevated supply cycle that could continue to suppress occupancy and rent growth despite healthy demand.
Moderate rent growth improvement next year appears increasingly plausible, but meaningful acceleration will likely come from markets that continue to move beyond the recent supply wave.
Additionally, the widespread and large lease concessions currently present in newer vintage stock represent an opportunity for stronger effective rent growth if those properties can successfully transition toward the concession environment of the mature stabilized stock.
Within the mature stock, average occupancy of 93% means that even a modest improvement in recent lackluster absorption could help drive additional rent growth.
The industry’s next stage of recovery could feature a combination of three developments: concession availability beginning to decline, continued improvement in effective rent growth for mature stabilized stock, and absorption sufficient to offset an increased new supply volume.
Disclaimer: All content and information within this article is for informational purposes only. ALN Apartment Data makes no representation as to the accuracy or completeness of any information in this or any other article posted on this site or found by following any link on this site. The owner will not be held liable for any losses, injuries, or damages from the display or use of this information. All content and information in this article may be shared provided a link to the article or website is included in the shared content.