

Beyond Peak Supply: Where Multifamily Markets Stand in the Construction Cycle
The multifamily sector is now firmly beyond the delivery peak of the recent supply boom. Among conventional properties with at least 50 units, more than 600,000 units were delivered nationally in 2024. Deliveries declined in 2025 and are expected to fall again this year.
Falling deliveries are only part of the supply story. Strong absorption has also worked through a substantial portion of the lease-up inventory created by the development wave. That progress has provided meaningful relief, but it has not occurred uniformly across markets.
Meanwhile, more than 725,000 units remain under construction. The next phase of the recovery is therefore less about whether supply is slowing and more about where enough of the existing overhang has been absorbed for sustained occupancy and effective-rent improvement to follow.
Methodology note: All figures refer to conventional properties with at least 50 units. Rent measures include asking and effective rents for new leases.
View the full monthly Markets Stats PDF
The Lease-Up Overhang Has Fallen Sharply
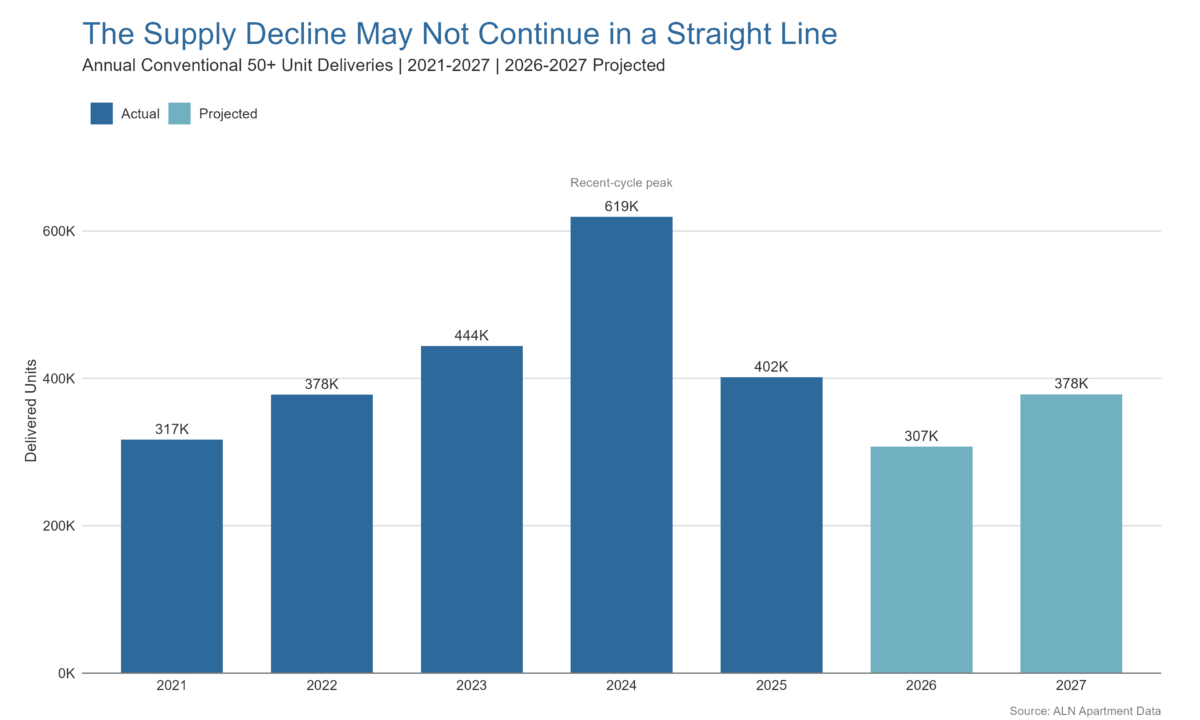
National deliveries have fallen sharply from their peak in late 2024. Annual deliveries that year surpassed 600,000 units. In 2025, annual deliveries fell to just more than 400,000 units. While representing a sharp year-over-year decline, new supply in 2025 remained substantial relative to historic norms.
National net absorption is on track to exceed annual deliveries for a second consecutive year in 2026. That shift in the relationship between new supply and realized apartment demand has allowed for the first stage of recovery to materialize.
Active lease-up units have decreased by 62% from their peak. In June of 2025 there were approximately 795,000 units in lease-up nationally. Just more than a year later, there were roughly 305,000 units in lease-up at the end of August 2026.
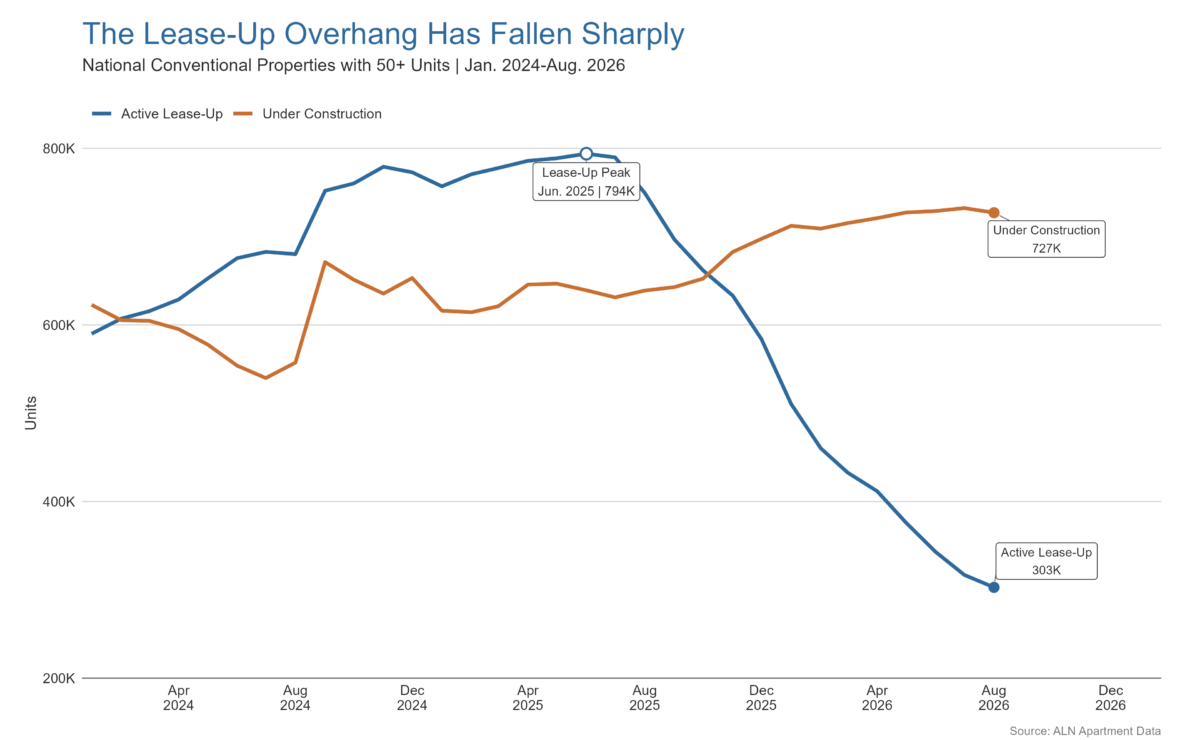
Among primary markets, Atlanta, Austin, Washington DC, Denver, and Miami – Fort Lauderdale have all exceeded the national rate in the decline from lease-up stock peak. Dallas–Fort Worth, New York, and Phoenix have recorded some of the largest aggregate reductions in active lease-up inventory from their recent peaks.
Last month’s newsletter included a look at part of this story. Strong net absorption and considerable average occupancy improvement have not yet translated into consistent effective rent growth, partially because positive net absorption has been concentrated entirely in lease-up and recently stabilized properties rather than extending into mature stabilized properties.
The substantial drawdown in lease-up stock has been a necessary development for the continued recovery in multifamily performance, but it is insufficient on its own.
The Supply Decline May Not Continue in a Straight Line
The decreased output from the new construction pipeline has been helpful, but further decline should not be taken for granted. There are currently more than 725,000 units under construction nationally. Across the current construction pipeline, just more than 100,000 units are expected to be delivered before the end of 2026. That would put annual deliveries for this year at around 310,000 units.
Around 380,000 new units are currently projected to deliver in 2027. That degree of new supply would be almost 25% higher than the 2026 annual total but would remain below the annual totals from the 2023 – 2025 period. The difference from recent years is that an increase in new supply would come alongside much more manageable existing lease-up stock.
Among primary and secondary markets, Charlotte, Miami – Fort Lauderdale, Buffalo, and Boise are leaders in expected deliveries through the end of 2027 as a share of existing stock. Other standout markets include Asheville, Melbourne, Northwest Arkansas, and Fort Myers – Naples.
Supply Pressure Depends on Where a Market Is Starting
Expected deliveries alone do not fully describe the degree of supply pressure facing a market. The impact of new units arriving in 2027 will depend in part on how much of the previous supply wave a market is still carrying. A market with little remaining lease-up inventory is entering the next round of deliveries from a very different starting point than one still working through a substantial existing overhang.
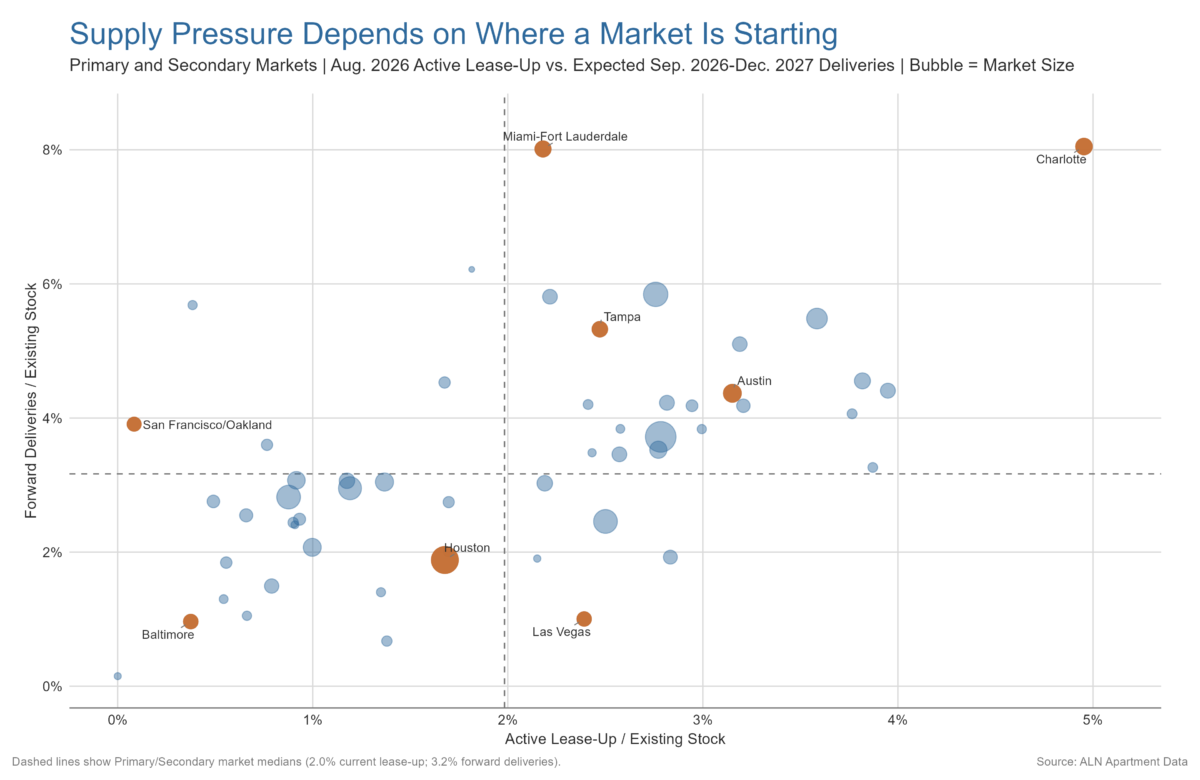
Asheville, Melbourne, Fort Myers–Naples, and Savannah stand out because both sides of that equation remain elevated. Each has substantial active lease-up inventory relative to existing stock while also facing meaningful additional deliveries through the end of 2027. Those markets have made less progress separating the previous supply wave from the next one, increasing the possibility that new deliveries will prolong the current digestion period.
By contrast, markets like Tampa and Austin have worked through considerably more of their lease-up inventory and may therefore be better positioned to absorb renewed supply. Expected deliveries in Tampa during the remainder of 2026 and through 2027 total nearly 11,500 units, equal to about 5% of existing stock. That is significant volume. However, only about 5,300 units remain in active lease-up, down from a peak of nearly 17,000 units in March 2025.
Similarly, more than 12,000 units expected to be delivered in Austin by the end of next year account for more than 4% of existing stock. However, units in active lease-up have declined there from a peak of more than 30,000 units in May 2025 to only about 9,000 units in August 2026.
The opposite dynamic is also important. Markets still carrying elevated lease-up inventory but facing a much lighter forward pipeline may remain under pressure today while having a clearer path toward improvement. Charleston, West Virginia, Lincoln, and Sioux Falls are examples. Markets with both limited active lease-up inventory and modest expected deliveries are in the strongest position to move beyond supply digestion altogether. Among primary markets, Houston and Las Vegas fit that profile.
This is why the next stage of the multifamily construction cycle is likely to become increasingly market specific. The national supply wave has receded substantially, but individual markets are entering 2027 with very different combinations of existing inventory to absorb and new supply still to come.

Every market tells a different story. Get the data behind yours with ALN OnLine.
Takeaways
The multifamily sector has made substantial progress working through the supply imbalance of recent years. Deliveries have fallen sharply, active lease-up inventory has declined considerably, and many markets should enter 2027 from a much healthier starting point than was the case over the last few years.
That does not mean the recovery is complete. As discussed in last month’s newsletter, improved absorption and occupancy have not yet translated consistently into stronger effective-rent growth. Net absorption has also been rather concentrated despite healthy headline numbers. Supply relief creates the conditions for the next stage of recovery, but the timing will vary considerably by market.
With more than 725,000 units still under construction and nearly 380,000 units currently projected to deliver in 2027, the construction cycle still has more to work through. The important distinction is that those units will arrive against a much smaller existing lease-up headwind than the industry faced at the height of the supply wave.
Heading into 2027, the markets best positioned for the next phase of recovery will be those that can continue absorbing remaining lease-up inventory while taking on new deliveries without sacrificing recent occupancy gains. That is where improving fundamentals have the best opportunity to translate into more durable pricing power.
Disclaimer: All content and information within this article is for informational purposes only. ALN Apartment Data makes no representation as to the accuracy or completeness of any information in this or any other article posted on this site or found by following any link on this site. The owner will not be held liable for any losses, injuries, or damages from the display or use of this information. All content and information in this article may be shared provided a link to the article or website is included in the shared content.