
Price Class Divide Widens Across Multifamily Performance
The March and April ALN newsletters discussed slowing net absorption among seasoned stabilized properties. In this context, seasoned stabilized properties are those that stabilized at least 18 months ago. Price class offers a related but distinct lens on recent performance.
Recent performance has diverged sharply across price tiers. Demand and occupancy have improved broadly but rent growth and concession trends show mounting pressure in the workforce housing segment. That marks a notable shift from the prior two years.
Methodology note: All figures refer to conventional properties with at least 50 units. Average effective rent refers to rents on new leases.
View the full monthly Markets Stats PDF
Net Absorption and Average Occupancy
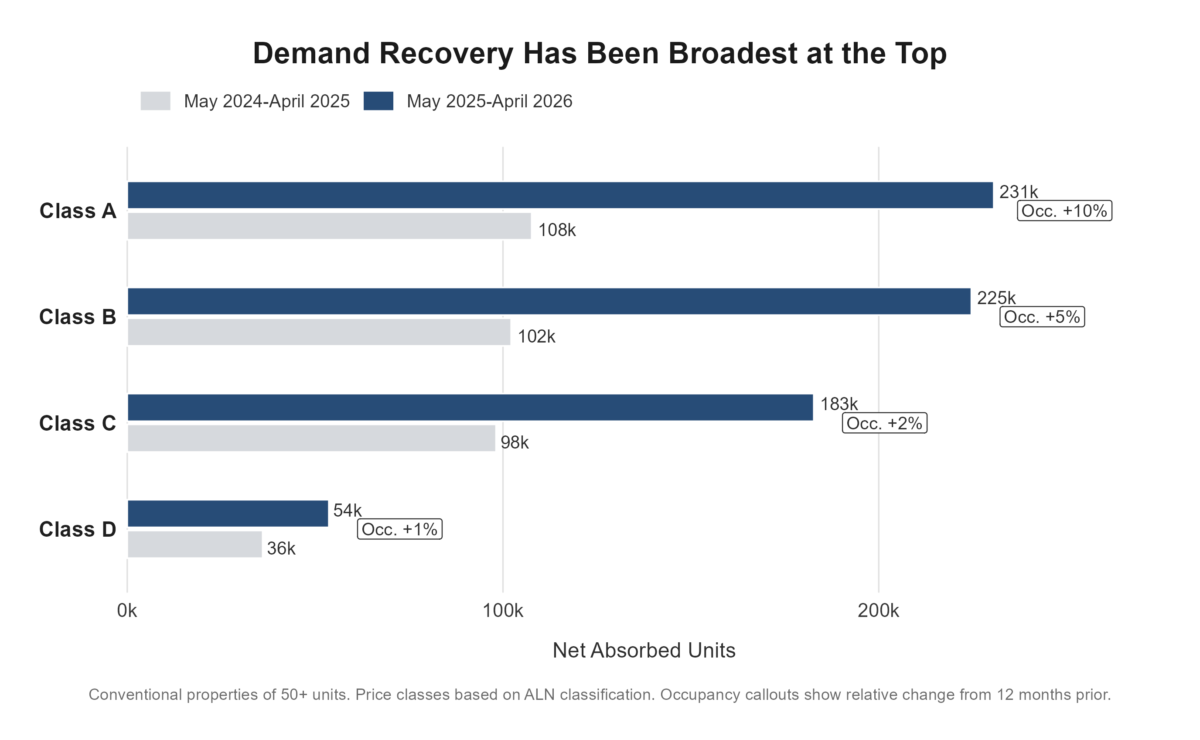
As of April, trailing twelve-month net absorption improved across all four price classes. The top two price tiers posted the largest gains. Both Class A and Class B absorbed more than 200,000 units over the last year. For both classes, that total was slightly more than double the prior twelve-month figure.
Class C absorption tracked more closely with Class A and Class B than with Class D. Class D absorbed nearly 54,000 net units, approximately 50% more than in the prior twelve-month period.
Lower new supply and stronger demand also lifted average occupancy across all four price tiers over the last year. Those occupancy gains, however, were uneven. Annual occupancy gains largely reflected each price class’s exposure to new supply. The pullback in deliveries benefited the top of the market most directly.
Class A overall average occupancy increased by 10% over the last twelve months. For Class B, the annual increase was 5%. Both remain well below their normal range, but the recovery has become more visible.

Planning on attending or exhibiting at Apartmentalize? Come see us in Booth 1900 to talk about data and how we can help your business!
For the workforce housing segments, progress has been more modest. Class C’s 2.2% annual gain marked a clear improvement from the 0.7% decline in the prior twelve-month period, but it still trailed the gains in the top two tiers. Similarly, Class D’s 0.8% gain reversed the 0.6% decline from the previous twelve-month period.
These trailing twelve-month trends have largely held over the last six months. Class D demand is the main exception to that pattern. Class D net absorption has slowed notably over the last six months compared with its twelve-month trend.
Seasonality explains part of that difference. November through April is typically a weaker period for apartment demand. However, demand also slowed relative to the same period a year earlier. Over the last six months, Class D properties absorbed about 13,000 net units nationally. That total was 26% lower than in the same period a year earlier.
Rent Growth and Lease Concessions
Generally positive net absorption trends have still not translated into robust rent growth. That disconnect has persisted since 2024. The main headwinds remain unchanged. First, despite recent improvement, average occupancy remains below normal across all four price classes. Second, lease concessions continue to weigh on effective rent performance.
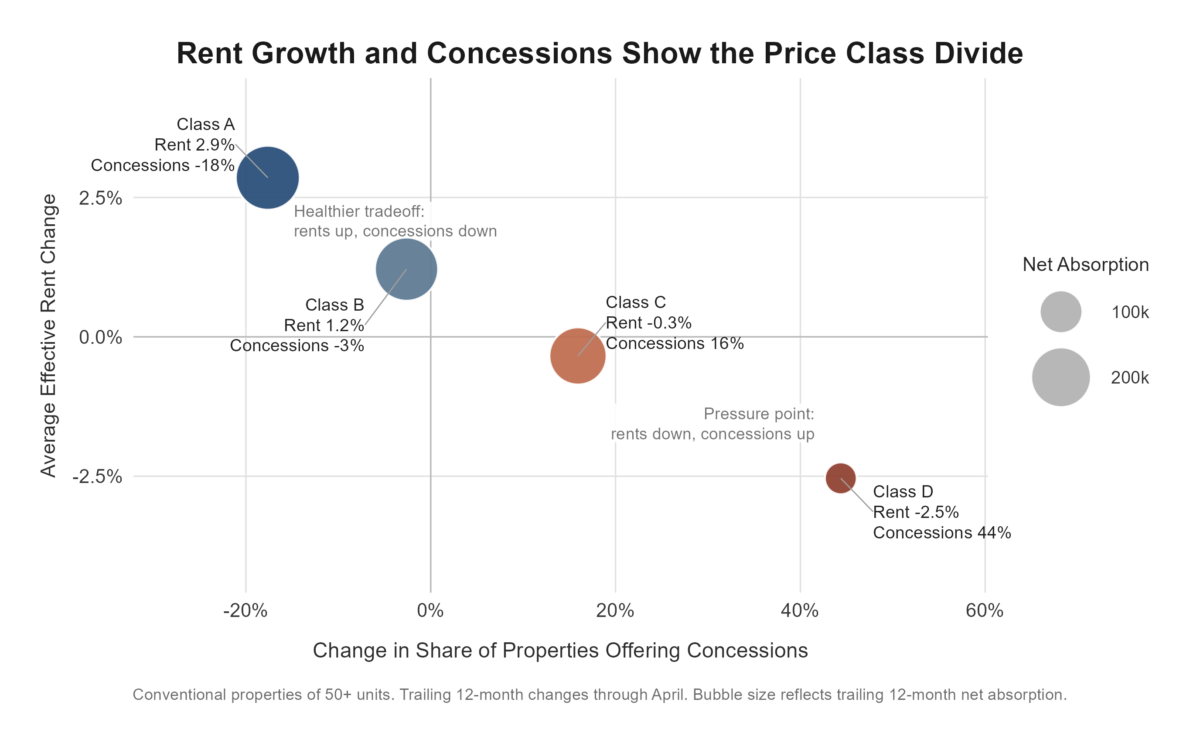
Class A posted the strongest twelve-month average effective rent growth at 2.9%. Class B rent growth was weaker, at 1.2%. Both underperformed their prior twelve-month results.
Despite slowing rent growth in the top two price tiers, conditions were even more challenging for workforce housing. Average effective rent fell by 0.3% for the Class C subset and by 2.5% for Class D. Both had posted positive rent growth in the prior twelve-month period.
The six-month rent data largely mirrors the twelve-month trend. Class A rent growth has been strongest, while Class C and Class D have remained in negative territory. All four price tiers underperformed compared with the same period a year earlier.
Lease concessions have played a major role in recent market performance. They have consistently pressured effective rent growth. This complicates the interpretation of strong absorption, since much of that demand has required widespread discounts.
The top of the market has made meaningful progress in recent months. Over the past twelve months, concession availability declined by 18% for Class A and by 3% for Class B. Over the last six months, a period when concessions often expand, Class A concession availability declined by 7%.
By contrast, already elevated discount availability rose further in the lower two price tiers. Availability for Class C properties increased by 16% over the last year, while Class D discount availability surged by more than 40%. Both segments ended April with higher concession availability than Class A.
Takeaways
Top-line national multifamily data masks growing stress in specific segments of the market. Performance by price class has diverged further over the last year.
Class A and Class B have recorded robust absorption, notable occupancy gains, and positive rent growth while reducing reliance on lease concessions. For Class C and Class D, net absorption and occupancy gains have been paired with effective rent declines and further expansion of lease concessions.
Fewer expected new deliveries this year provides some leeway for an industry that has absorbed a wave of new units in recent years. However, workforce housing has become the clearest pressure point. Concessions have been necessary to drive absorption, and in Class D, that lever appears to be losing effectiveness. At the same time, those discounts are weighing on rent growth.
With the traditionally stronger leasing season now underway, the next few months will be critical for determining whether workforce housing can regain momentum this year.
Disclaimer: All content and information within this article is for informational purposes only. ALN Apartment Data makes no representation as to the accuracy or completeness of any information in this or any other article posted on this site or found by following any link on this site. The owner will not be held liable for any losses, injuries, or damages from the display or use of this information. All content and information in this article may be shared provided a link to the article or website is included in the shared content.