A Potential Warning Sign Emerged This Winter
Last year brought significant positive developments for multifamily performance. In recent months, new supply has continued to trend downward and national net absorption has remained robust. However, early cracks have begun to appear in the broader picture of a multi-year recovery. These cracks do not necessarily signal a reversal of the gains made over the past two years, but they warrant closer examination.
All figures refer to conventional properties with at least 50 units. Average effective rent refers to rents on new leases.
View the full monthly Markets Stats PDF
Net Absorption Trends
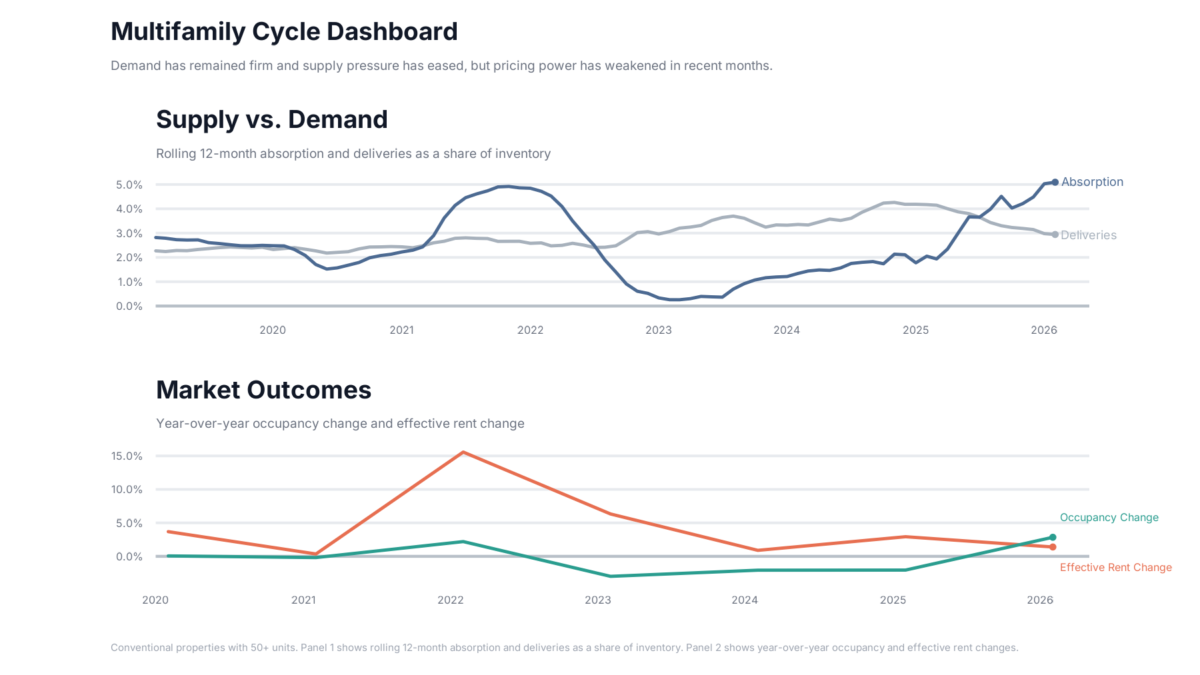
National net absorption entered 2026 on a three-year uptrend after bottoming out in 2022. Rather than stagnating, demand gained additional momentum last year. The last twelve months produced the strongest multifamily demand in several years.
Approximately 700,000 units were absorbed nationally from March 2025 through February 2026. That total equaled roughly 5% of existing stock – slightly edging out the twelve-month period ending in February of 2022.

Visit us at the TAA ONE Conference in Booth 1200 to see the data that’s defining the Texas multifamily market.
Demand has also been strong for properties that entered 2026 already stabilized. About 460,000 absorbed units represented more than 3% of existing stock. That result was double the level recorded a year earlier and trailed only the period ending in February 2022.
National demand also remained strong this winter. About 160,000 units were absorbed nationally from October through February. That was the strongest winter performance in recent years.
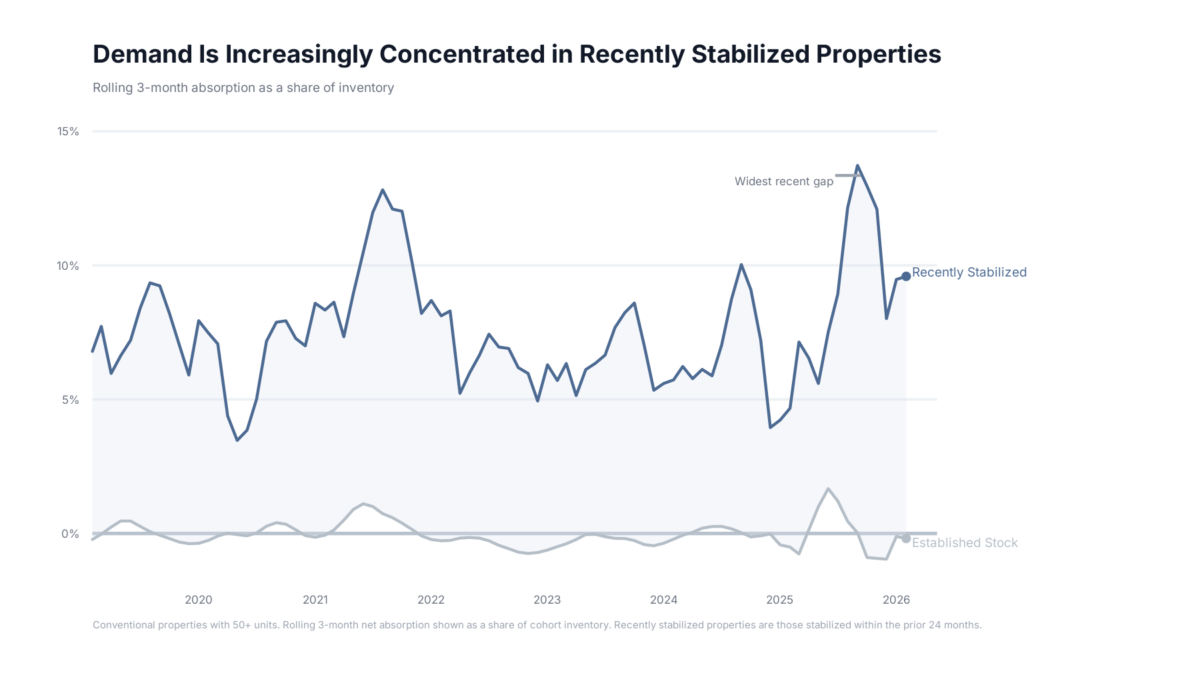
However, the gap in absorption between newer and older properties has widened considerably. While new properties typically attract more leasing activity, demand has become increasingly concentrated in that segment. Much of the recent absorption among properties categorized as stabilized reflects assets that stabilized in 2025.
Properties built before 2024 lost roughly 114,000 leased units from October through February. A year earlier, properties the same distance from their completion year lost about 54,000 units during the same period. Headline demand figures increasingly mask diverging conditions across the multifamily sector.
Rent Growth Trends
National average effective rent rose about 2.7% in 2024. Growth slowed to about 1.8% in 2025 despite improved fundamentals. A major reason for weaker rent performance was the continued expansion of lease concessions. By the end of 2025, nearly one-quarter of conventional properties were offering discounts to new residents. Discount availability has increased for four consecutive years, and current availability is above its pandemic-era peak.
The average discount value has also climbed steadily in recent years and closed February at about 4.1 weeks off an annual lease. That average was equal to the average from the end of 2020.
Heading into 2026, a key question was whether absorption momentum could continue if the industry began reducing concessions. A decline in either the average value or availability of concessions would support stronger rent growth.
It is still too early in the year to make definitive statements on the topic, especially because any sustained draw down in concessions would be likely to occur in the middle quarters of the year, but recent absorption trends certainly do not portend guaranteed success.
Leasing activity concentrated in new properties will likely continue to rely on concessions common to those properties. At the same time, weaker performance in older vintages may prompt greater reliance on discounts.
Over the most recent twelve months, the national average effective rent increased by 1.4%. In the five months since the start of the fourth quarter of 2025, that metric has declined by 1.2%. Seasonal rent declines during winter are not unusual, but this year’s slide followed a modest gain from the same period a year ago and was the largest decline for this portion of the calendar in more than five years.
Takeaways
National multifamily performance over the last twelve months has been mostly encouraging. New supply is down, net absorption is up, and average occupancy has gained ground for the first time in a few years. Rent growth has taken a step back, but has remained in positive territory and has perhaps contributed to firmer conditions across the other metrics.
Even so, a potential warning sign has emerged. While overall leasing activity remains robust, gains are increasingly concentrated in new properties. For properties older than two years, net absorption has recently turned negative – and by a wider margin than was the case last winter.
This recent softness does not necessarily mean that the multi-year positive demand trend the industry has been in the midst of is now dramatically changing course. Coming into the year, annual net absorption for 2026 was expected to be lower than in 2025. This could simply be a seasonal bump in the road that will not survive through spring.
However, the shift merits close monitoring in the coming months. A reversal of the recent progress in workforce housing would have significant implications for overall industry performance this year.
Disclaimer: All content and information within this article is for informational purposes only. ALN Apartment Data makes no representation as to the accuracy or completeness of any information in this or any other article posted on this site or found by following any link on this site. The owner will not be held liable for any losses, injuries, or damages from the display or use of this information. All content and information in this article may be shared provided a link to the article or website is included in the shared content.