2019 Q1 Multifamily Review
Spring is here, and summer is fast approaching. That means the opening quarter of 2019 is in the books. We don’t have 5 petabytes of data stored on 1,000 pounds of hard drives as was generated by the recent, historic first picture of a super-massive black hole. But, we have more than enough data to assess what kind of start various multifamily markets have gotten off to this year. On a national level, stability is the word. Average occupancy was essentially flat, as was average effective rent growth.
All numbers will refer to conventional properties with more than 50 units. For this review, we’ll go by National Apartment Association (NAA) regions and identify some high and low points from each.
Jump to a section
View the full monthly Markets Stats PDF
Region 1—Washington DC, MD, PA, VA, WV
A little more than 20 new properties were added in these states in the first three months of the year. Of those, 12 are in the DC market. The approximately 3,300 new units there represent the only market in this group to have surpassed 1,000 new units. Philadelphia was closest, adding just under 1,000 units. Unfortunately, net absorption* was negative by more than 200 units in the quarter, while in DC, more than 2,700 units were newly rented.
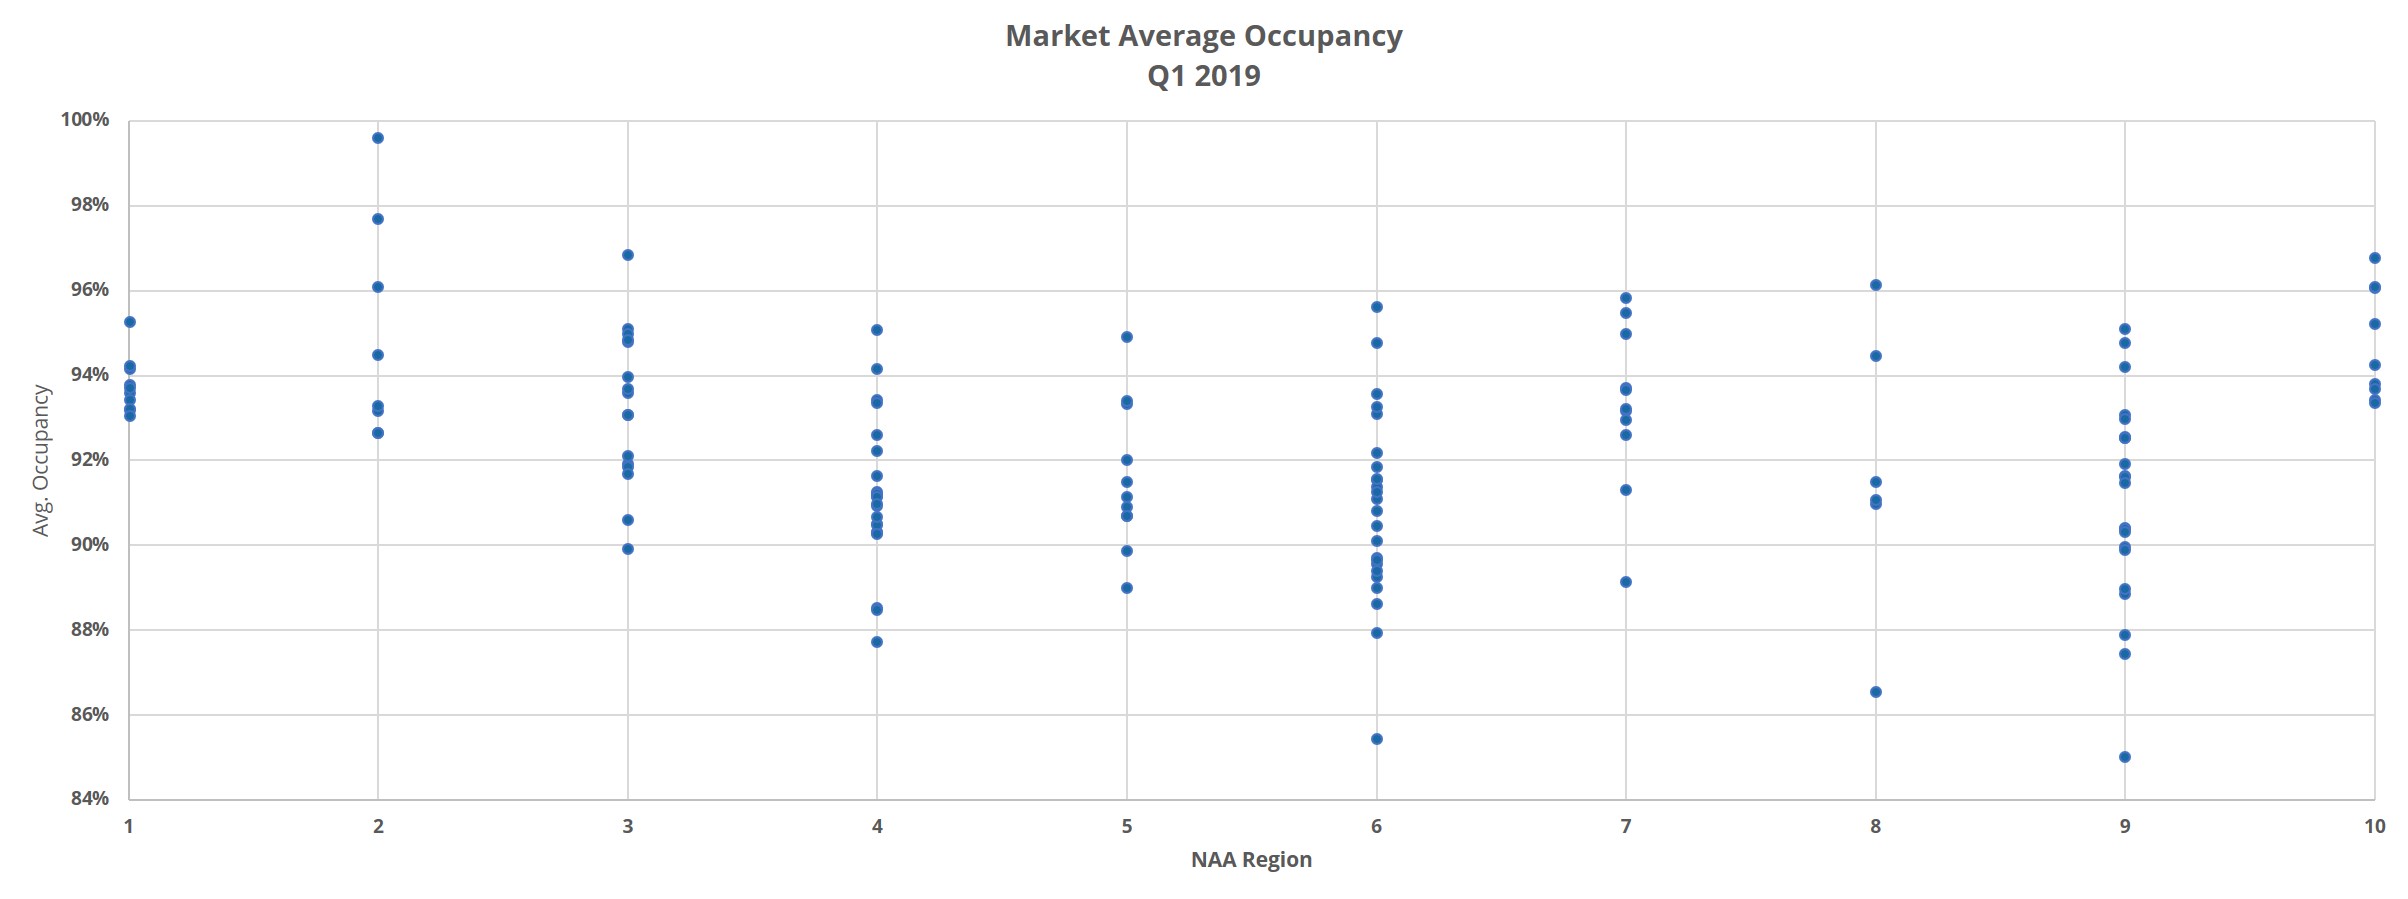
The story with average occupancy across these markets is one of stability. A relatively small amount of new construction in areas outside metro DC resulted in average occupancy change being within 1% either direction for every market. No area ended March below 93%, and no area managed to hit 96%.
As with occupancy, there wasn’t much movement in average effective rent during the quarter. There were three markets to top 1% growth: Harrisburg – Lancaster, Richmond and Roanoke. The 2% increase in Roanoke put it in the top 10% of all markets across the county. Harrisburg – Lancaster saw rents gain about 1.5%, and Richmond added 1%. DC continues to lead the pack in rent per unit, and by a wide margin, ending the period at $1,800 per month per unit. Baltimore and Philadelphia come next, with both right around $1,300 per month.
Region 2—CT, MA, ME, NH, NY, RI
Fewer properties were added in this region, with a majority coming online in the Greater New York metro area. New York added about 1,300 new units but absorbed nearly 4,000. Hartford, Boston and the upstate New York region each added two or three properties, but all failed to absorb those units within the quarter.
Once again, because of the relatively sparse construction pipeline deliveries, average occupancy was stable. No market gained or lost even 1%. At the highest occupancies were in Albany, Augusta – Portland, Providence and Springfield, where the lowest ended March at 96%. All are in the top 10% nationally.
There wasn’t much activity in rent growth in this region either. Concord and the New York metro area each managed about a 1% gain to lead the way. New York and Boston have the highest average monthly rents, at $2,600 and $2,200 respectively.
Region 3 – IL, IN, MI, MN, OH, WI
Much of the new construction activity in these markets was in Chicago, where almost 3,400 units were added. Both Columbus and Minneapolis – St. Paul added more than 800 units, and Detroit added almost 750 units.
This is the first region where we see some real variance in average occupancy. Although, like the previous regions, there isn’t much variance in terms of occupancy percent change. Fort Wayne and Madison were the only areas to hit 1% occupancy growth for the quarter. On the other end, Springfield suffered the largest occupancy loss—a 1% decline. Chicago ended March at 90% average occupancy. Every other market ended higher, with Green Bay – Appleton – Oshkosh highest at nearly 97% — placing it in the top 10% of markets nationally.
Rents performed comparatively well in these markets during the first three months of the year. Both Minneapolis – St. Paul and Chicago realized 1.5% rent gains, while Columbus and Evansville came in just behind with about 1.3% growth each. Green Bay – Appleton – Oshkosh was the only one in this region to see rent growth fall short of 50 basis points, with a gain of about 25 basis points.
Region 4 – GA, KY, NC, SC, TN
New supply is more pronounced in these areas compared to the first three regions. It’s also more dispersed amongst the markets. The Atlanta metro added about 3,500 new units, and Charlotte and Raleigh – Durham each added around 1,800 units. Nashville was the other site of notable construction activity, with nearly 1,200 new units coming online in the quarter.
Whereas the areas covered so far have tended to have average occupancies in the low-to-high 90% range, this region is grouped more around the high 80% to low 90% range. On the low end, markets like Augusta, Charleston and Myrtle Beach all ended March around 88% for average occupancy. On the high end, Columbus and Wilmington ended the quarter at 94% and 95% respectively. The larger markets such as Atlanta, Charlotte, Raleigh – Durham and Nashville were all right in the middle in the low 90% range.
This region also experienced strong rent growth in the period compared to the previous few regions. In fact, two markets landed in the top 10% for effective rent growth across the county. Wilmington and Lexington added about 3% and 2% respectively to average effective rent. Albany, Atlanta, Memphis and Louisville each gained just under 2%. Furthermore, Augusta, Chattanooga, Charleston, Columbus and Savannah all surpassed 1.5% rent appreciation. For those keeping track, 11 of the 22 markets in this region saw larger rent gains than any of the markets in NAA Regions 1, 2 or 3.

Region 5 – IA, KS, MO, NE, OK
Slightly more than 1,100 units were introduced in the Oklahoma City market in the period. No other market in this region added even 500 units. The closest was Omaha, with about 450 new units.
The average occupancies in this group resemble those in NAA Region 4. Wichita managed a 1% occupancy gain despite also adding about 200 units. No other area added even 50 basis points to average occupancy. Springfield and Oklahoma City each lost ground to the tune of 1%. Lincoln, after adding about 160 units saw average occupancy decline by 2.5%. St. Louis ended the quarter at 95% average occupancy, with Columbia and Kansas City not far behind at 93%. No market finished March any lower than 89%.
Effective rent growth was strong in this region compared to the national average as well. Wichita was the biggest gainer, at about 2%. Rents rose in Oklahoma City by a little more than 1.5%. The St. Louis, Lincoln and Topeka – Manhattan -Lawrence areas all managed to top 1% growth as well. Springfield was the only market that slid backward, suffering a 2% loss on average. This is the first region where no market average is above $1,000 per unit per month, though Kansas City and St. Louis are likely to change that before 2019 is over.
Read our Recap of the 2019 TAA Education Conference & Lone Star Expo
Region 6 – AR, NM, TX
Q1 2019 continued the building trend in the major Texas markets. More than 6,200 units were added in DFW. Houston added more than 3,000 new units and Austin delivered about 2,200. San Antonio introduced just under 1,500 new units. The smaller markets got into the action as well, with Albuquerque, Waco – Temple – Killeen, Northwest Arkansas and Midland – Odessa each adding at least 1 new property in the quarter.
The lowest average occupancies as of the end of March for this region were all in markets with no new supply in the period. College Station ended up at about 85%, while Amarillo, Beaumont and Lubbock all ended between 88-89% average occupancy. The best improvements were found in areas like Abilene, Albuquerque and Waco – Temple – Killeen where average occupancy rose by more than 1%. Three of the four major Texas markets finished the quarter at about 90% occupancy, Austin ended higher at about 91%. Lastly, DFW had the highest net absorption of any market in the US in the first quarter, adding more than 4,400 net newly rented units.
Rent growth in this region was relatively robust across the board, with only a couple of exceptions. Waco -Temple – Killeen and Midland – Odessa both surpassed 2.5% growth. Lufkin and Victoria added better than 2% to rents. All four markets were in the top 10% for effective rent growth nationally.
Thanks to the oil industry rebound and limited multifamily supply, Midland – Odessa continues to be the most expensive market in Texas. Average effective rent in that market ended March at over $1,500 per month. Austin and San Antonio each realized gains of 1.5% or better, while both DFW and Houston managed only a little more than 50 basis points. San Antonio has now joined the other major Texas markets with average rent of $1,000 or more.
Region 7 – AK, AZ, ID, NV, OR, WA
The Q1 performance of this region is as diverse as the geography it covers. Phoenix and Seattle each added about 2,000 units in the first three months of the year. The other market with notable new supply was Portland, where around 1,200 new units came online.
The Southeast Washington area saw average occupancy jump nearly 5% in the quarter, ending March at nearly 96%. Boise was another strong performer, adding a little more than 1.5% to finish at 95% average occupancy. On the other end of the spectrum, both Reno and Flagstaff moved downward by about 2%. Spokane didn’t see much movement in the quarter but remains one of the highest occupancy markets in the country at nearly 96%. The only market under 90% is Anchorage, but only slightly, at 89%.
Every market in this region managed to raise rents, most of them by at least 1%. Phoenix and Boise paced the field at just over 2%, while the 20 basis point gains in Flagstaff and Southeast Washington brought up the rear. Each of the other seven markets added no less than 70 basis points at the average. Spokane was the other standout, managing to just touch 2% growth.
Region 8 – CO, ND, SD, UT
The bulk of new construction in this region occurred in the Denver – Colorado Springs and Salt Lake City markets. Denver – Colorado Springs added about 1,400 new units and Salt Lake City delivered around 800.
Sioux Falls, which began the year at 89% average occupancy, added almost 400 units and the result was an occupancy decline of almost 3% to just under 87%. No other market ended the quarter with an average occupancy below 91%. Fargo also suffered an average occupancy decline, losing just under 2% to finish March at 91%. Rapid City, at 96%, and Bismarck at 95% continue to have the highest average occupancy of the region.
Average effective rent in both Bismarck and Sioux Falls rose by 2% in the period, the highest gains in this region. Salt Lake City and Denver – Colorado Springs each gained about 60 basis points and continue to be the only markets with average rent above $1,000 in this group. Denver – Colorado Springs now has an average rent per unit of nearly $1,450 per month, while Salt Lake City ended March just below $1,200.


Region 9 – AL, FL, LA, MS
Unsurprisingly, the larger Florida markets dominated the new construction scene in the first quarter for this region. Orlando and Miami each added around 2,000 new units. Tampa and Fort Myers – Naples saw deliveries of about 1,800 and 1,600 units respectively. Melbourne, Jacksonville and Fort Lauderdale each added more than 500 new units as well.
Average occupancies in this group largely ended March on the low end of the national scale. Baton Rouge, Lake Charles and Fort Myers – Naples all ended Q1 2019 at or below 88%. Additionally, Monroe and Mobile each finished up the period around 89% average occupancy. All five of these markets were in the bottom 10% of nationwide markets. Of the markets with at least 250 conventional properties, Birmingham owns the highest ending average occupancy – just under 93%. Jacksonville had the lowest ending occupancy of those larger markets, managing to stay just above 90%.
Lake Charles was the only market in this region to suffer a significant loss in average effective rent—a loss of nearly 6%. It’s important to note the sample size here as Lake Charles has only 29 conventional properties with more than 50 units. Gulfport – Biloxi also lost some ground on rents, but only by about 20 basis points at the average.
There’s good news for this region – it’s home to the market with the strongest effective rent growth in the nation for the first quarter. Pensacola rents climbed 3.5%, and just behind Pensacola was Fort Myers – Naples with a gain just over 3%. Lastly, Baton Rouge, Gainesville and New Orleans are likely to surpass $1000 average effective rent per unit sometime this year.
Region 10 – CA, HI
Most of the new supply in this group came in the Los Angeles – Orange County and San Francisco – Oakland markets. The LA metro area added about 1,300 units, and the Bay Area added about the same.
It shouldn’t come as any surprise that some of the highest average occupancies in the nation are found in this region. San Joaquin Valley finished March with an average occupancy of 97%. Central Coast in California crossed 96% in the quarter. Honolulu and Los Angeles – Orange County are the low water marks in this group, and each stands a bit over 93%. The nearly 1,800 absorbed units in the Los Angeles – Orange County area was enough to put it in the top 10% of markets nationally.
The highest average effective rent for a market continues to be the Bay Area, which ended March with an average rent of just above $2,700 per month. LA is neck-and-neck with Boston for the next third most expensive market nationally, with an average rent of about $2,200 per month.
In fact, eight of the ten ALN markets in this region are in the top-10 for most expensive markets, with only New York City and Boston being in the top-10 from outside this region. Honolulu is the only market to have seen rents recede at all in the period, with a loss of just under 2%. San Joaquin Valley, Providence, San Bernardino – Riverside and Sacramento were the only areas to gain at least 1%.
Takeaways
The nearly 70,000 new units introduced nationally in the first quarter is a reduction from over 85,000 new units in the same period in 2018. However, that’s still a significant increase compared to Q1 2017 which saw the introduction of fewer than 55,000 units. The draw down in new supply was timely because demand, as reflected in net absorption of about 45,000 units, was lower than it has been in the last few years for an opening quarter.
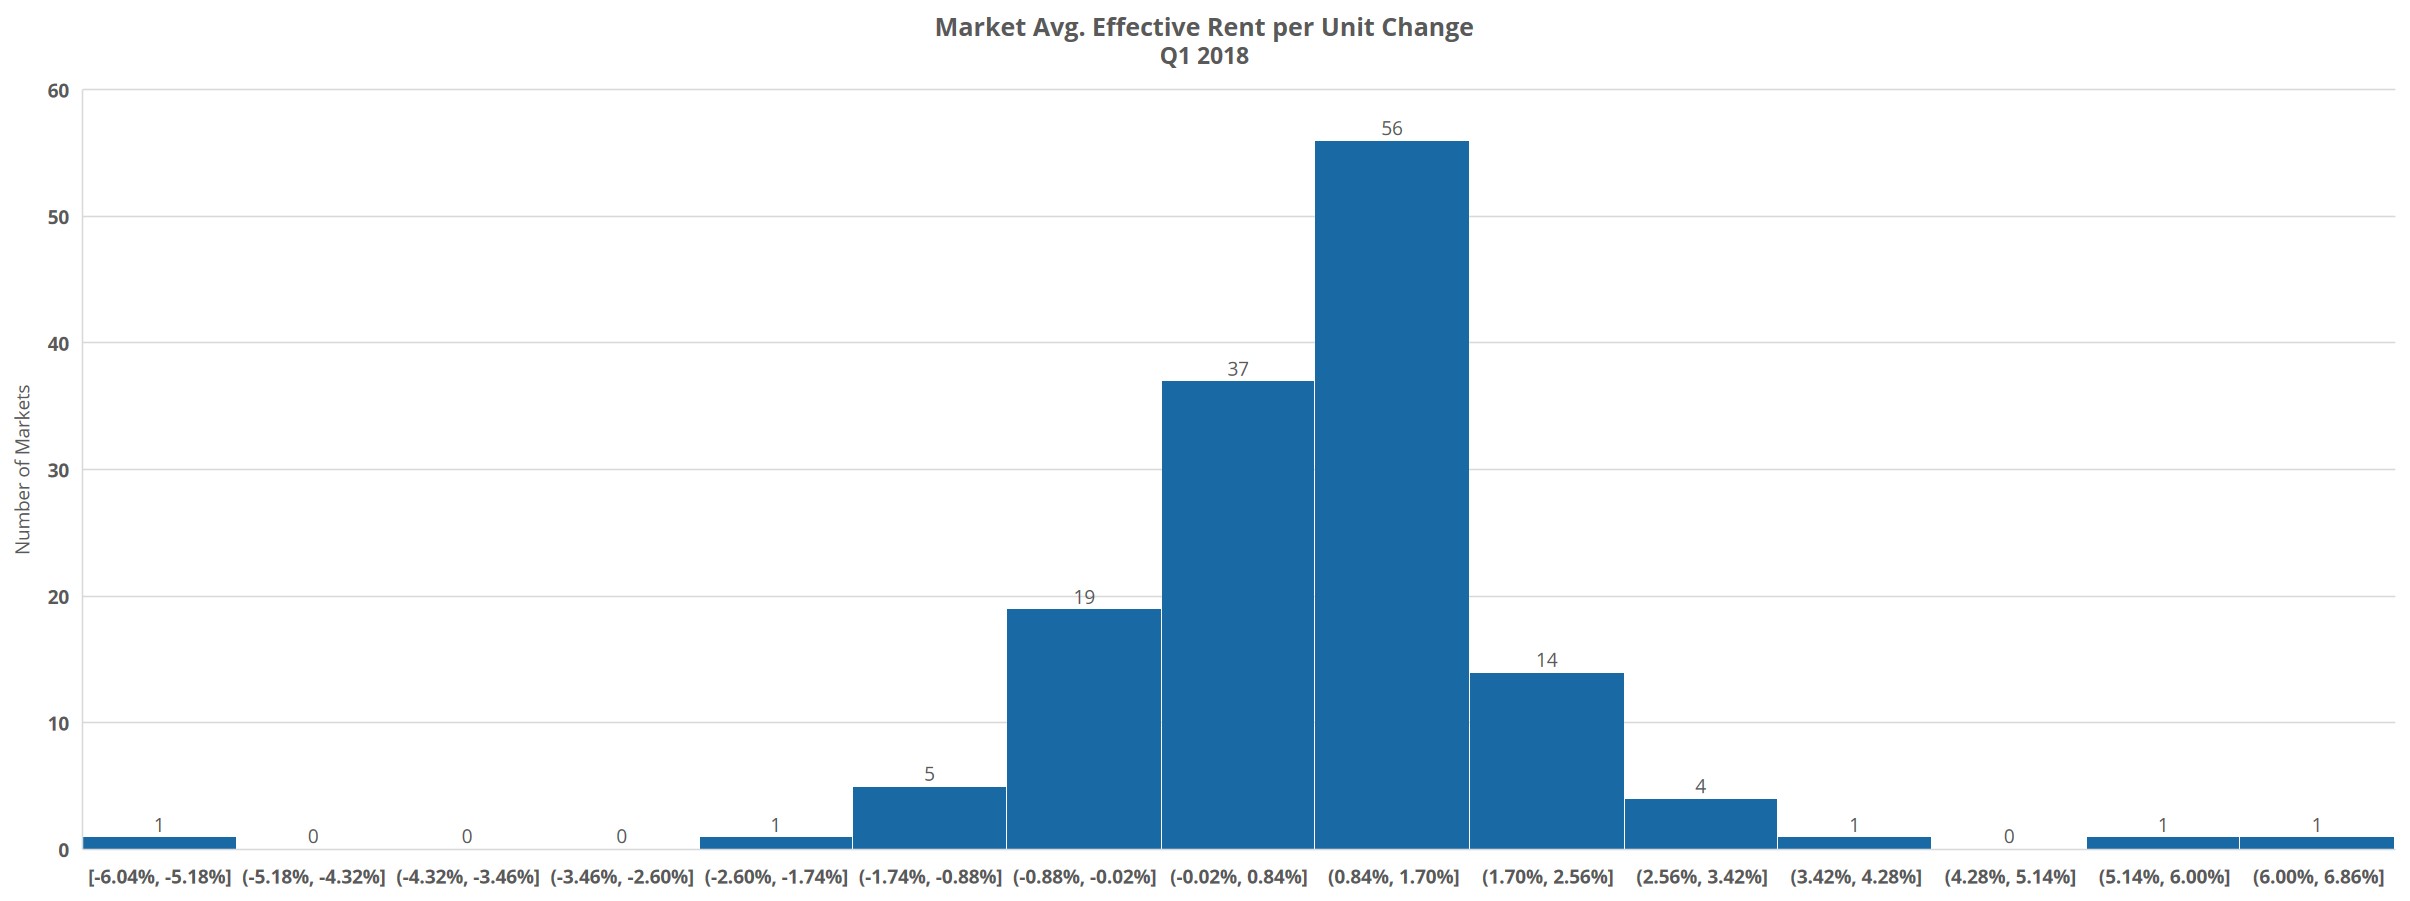
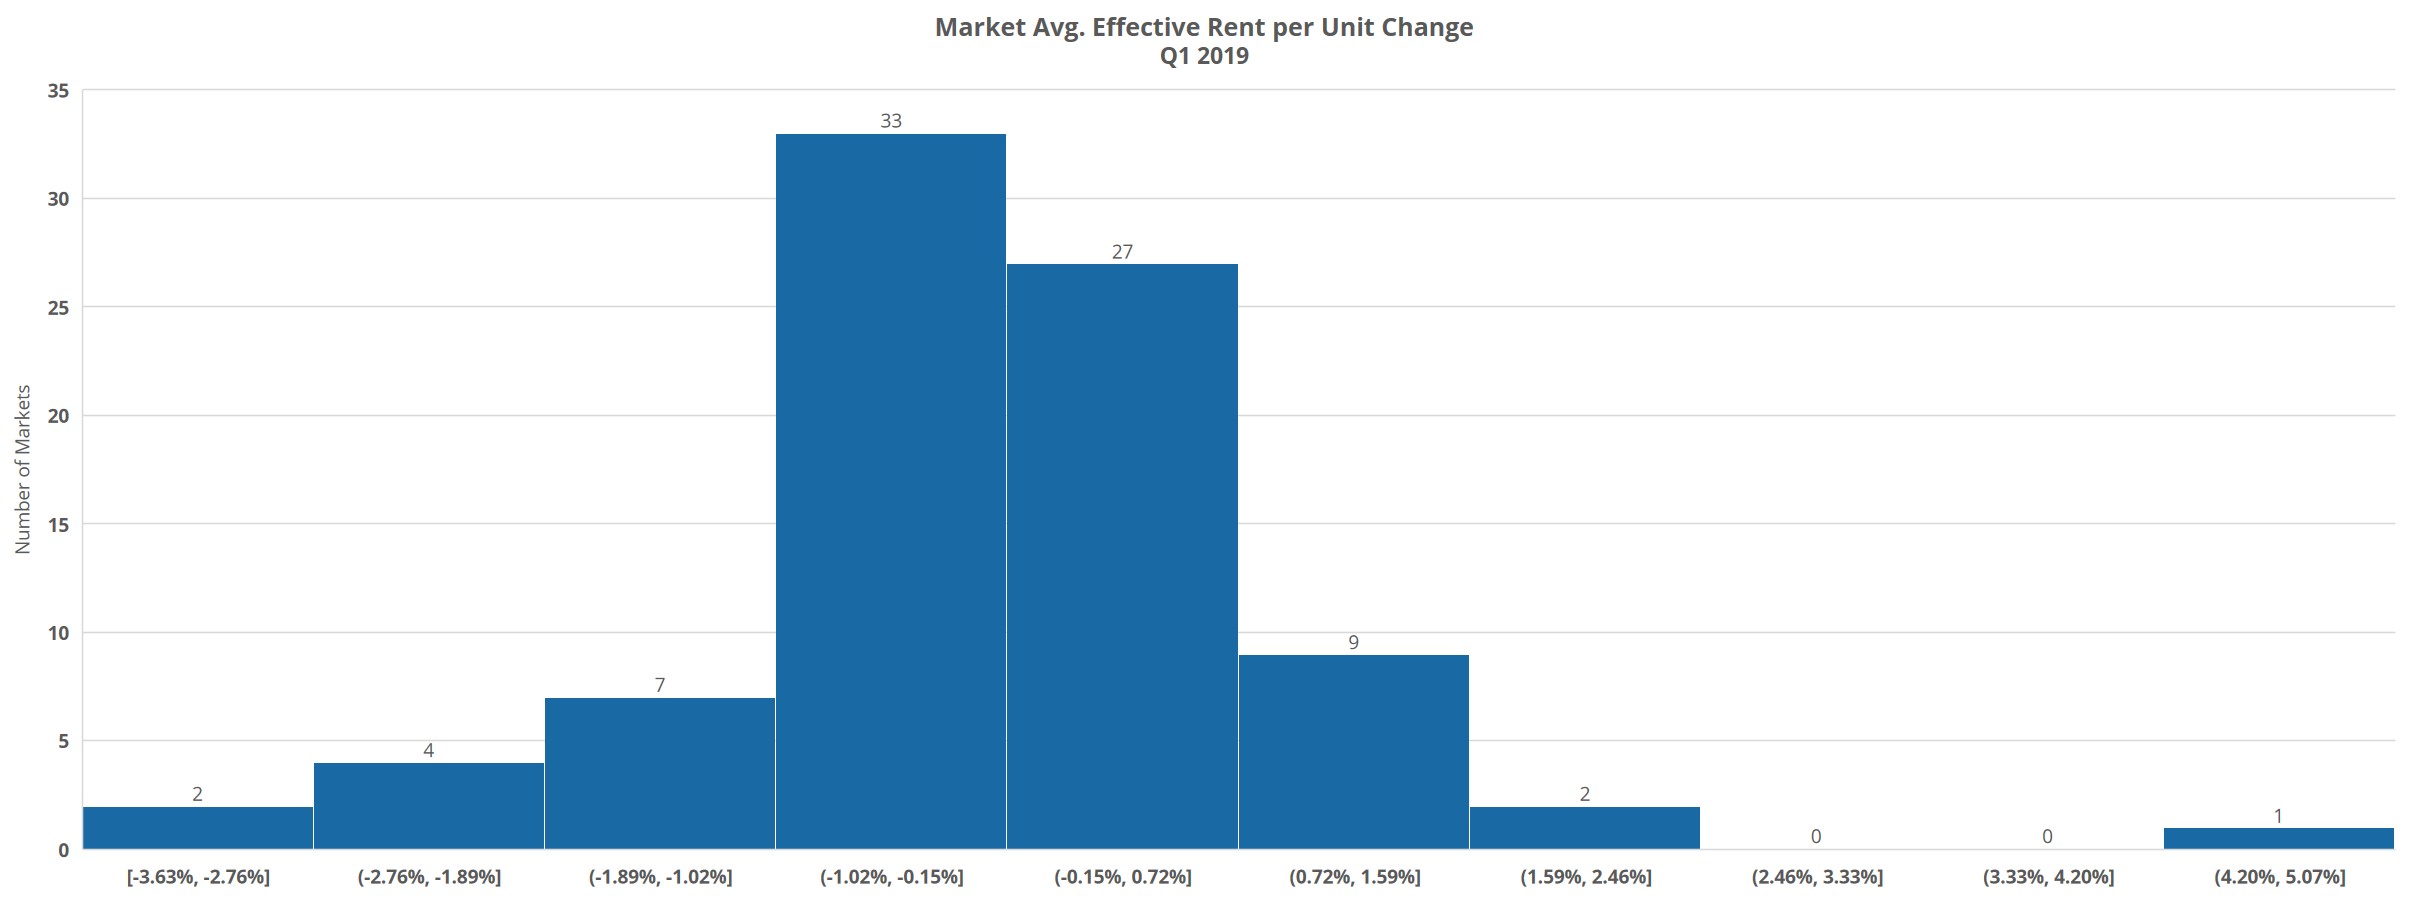
Average occupancy in Q1 2019 stayed essentially flat for the third year in a row, and average effective rent growth was just under 1%. What we’ve seen so far this year is that some areas continue to perform well, but the strong results are beginning to be concentrated in fewer markets. And, even these relatively strong performers failed to replicate recent past performance. Many areas mostly held their ground but didn’t make much progress in the quarter.
As we move into the traditionally stronger second and third quarters, demand will have to increase if it’s going to stay in-range of the pace of new supply. In a few markets, we could see more pronounced signs of overbuild before the end of the year.
Read our Recap of the 2019 TAA Education Conference & Lone Star Expo
*Net absorption refers to the net number of newly rented units in a period
Disclaimer: All content and information within this article is for informational purposes only. ALN Apartment Data, Inc. makes no representation as to the accuracy or completeness of any information in this or any other article posted on this site or found by following any link on this site. The owner will not be held liable for any losses, injuries, or damages from the display or use of this information. All content and information in this article may be shared provided a link to the article or website is included in the shared content.

