An Update on the New Construction Pipeline
Apartment demand has improved considerably so far this year relative to where the industry was at the same point in 2022 and 2023. Net absorbed units through May nearly reached 100,000 units nationally, 58% higher than the 2023 total through the same period. Despite the step in the right direction, apartment demand has remained well below what had been the normal range in the pre-pandemic years. In 2018, approximately 188,000 net units were absorbed through May. Net absorption in the same portion of 2019 totaled around 170,000 units.
Unfortunately, even if demand had recovered to the pre-pandemic level, national average occupancy would still be steadily declining. The reason that even net absorption 50-60% higher than what has been achieved would be insufficient to defend occupancy is the new construction pipeline. New multifamily deliveries will continue to drive industry performance this year because demand is not expected to catch up with supply. That misalignment will put continued downward pressure on occupancy and make rent growth that much more difficult to capture.
View the full monthly Markets Stats PDF
Pre-Construction and Lease-up Units
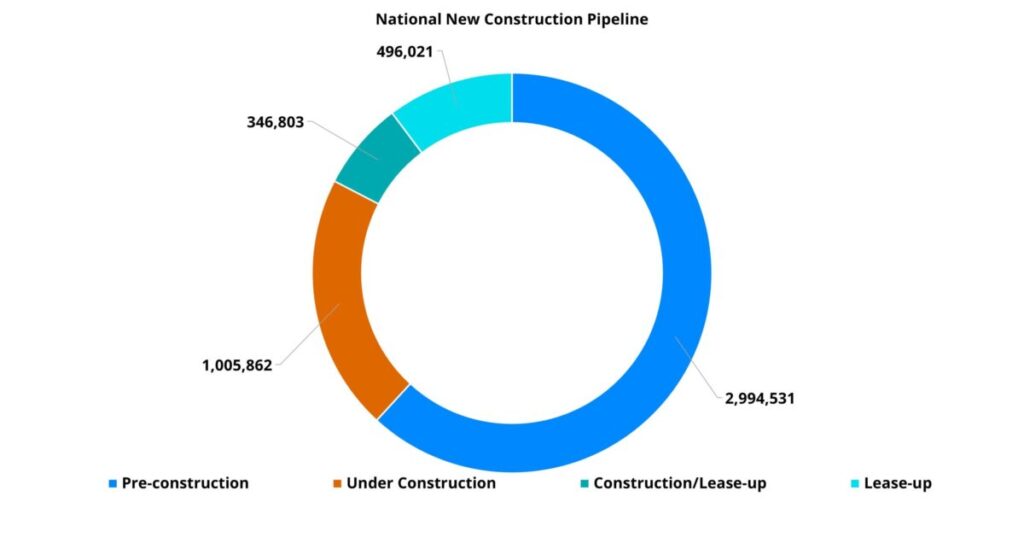
In total, ALN is currently tracking more than 4.8 million units in some phase of the construction pipeline. The bulk of those, about three million, are in a pre-construction phase. Some of these units will never come to market, and those that do are unlikely to be leasing before 2027. For this reason, they are less of a concern when it comes to the industry outlook for this year or next.
There are roughly 840,000 units around the country in some phase of lease-up. These properties are either completing construction but already leasing, or construction has completed but the property is not yet stabilized. Unsurprisingly, the markets with the most new units in this phase of the pipeline tend to be those that have consistently built and delivered a lot of new units. Dallas – Fort Worth, Austin, New York, Denver – Colorado Springs, and Houston represent the top five with a range of about 35,000 units in Houston up to around 58,000 units in Dallas – Fort Worth.
For most of the markets with a high number of units in this phase, new supply pressure will continue to be especially acute. Not only do these units have to be absorbed, but the flow of new units will not be stopping this year. Of the top twenty markets for this phase of the pipeline, fourteen are Sunbelt markets.

Units Under Construction
Projects currently under construction but not yet leasing provide a basis for expected new supply over the next two years. Averages vary widely by market, but the national average construction time for a multifamily project currently stands at twenty months as measured from a construction start to a lease start. ALN is currently tracking just more than one million units in this phase of the pipeline.
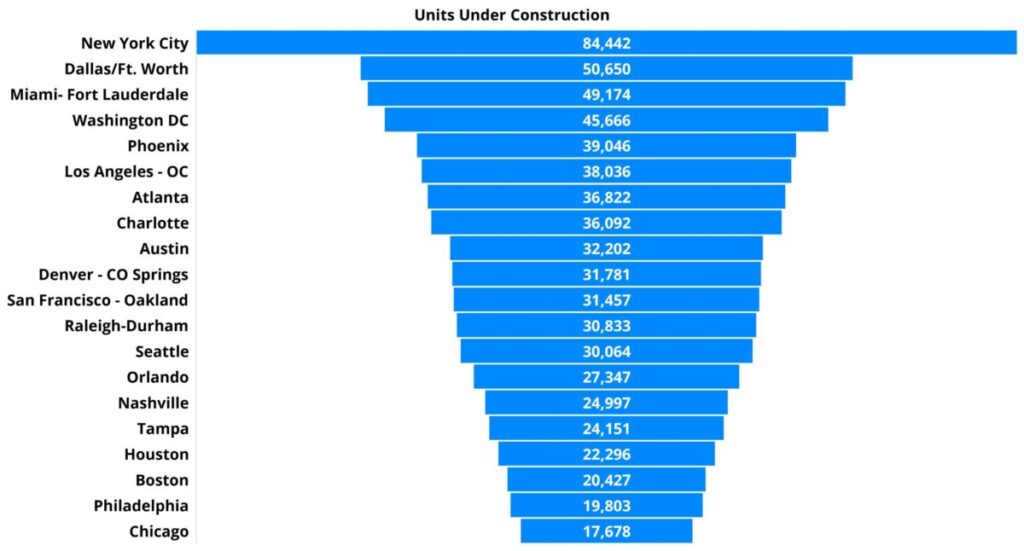
Market leaders for units currently under construction are similar to the leaders in lease-up units, but there are some differences. Both New York and Dallas – Fort Worth are in the top three for units under construction as they were for lease-up units. Upcoming new supply in areas like Austin, Houston, and Denver – Colorado Springs has them lower in the market rankings than their current volume of lease-up units. For units under construction, Austin and Denver – Colorado Springs rank ninth and tenth in the nation, respectively. Houston is all the way down at seventeenth.
Other markets like Washington DC, Phoenix, Los Angeles – OC, Atlanta, Charlotte, Miami – Fort Lauderdale round out the top ten in the nation for units under construction. None of these markets are surprises, as all have tended to be among the most active markets for new supply on an annual basis in recent years.
With the possible exception of the Los Angeles area, none of the top ten markets for upcoming new supply are likely to get annual net absorption close enough to annual new supply in 2024 to maintain current average occupancy. Los Angeles presents an interesting case because demand has rebounded particularly well there this year. With an average construction time of almost twenty-four months, the flow of new supply is also naturally smoothed a bit by the longer timeline.

Market Size-Adjusted Upcoming Supply
Another important measure of the expected impact of upcoming new supply is what share of existing conventional multifamily stock is represented by the incoming units. In general, this can bring smaller areas into focus whose aggregate units under construction may not be eye-catching but are nevertheless a major addition to the market. This measure can also highlight those larger markets that have an outsized amount of new supply on the horizon even accounting for their size.
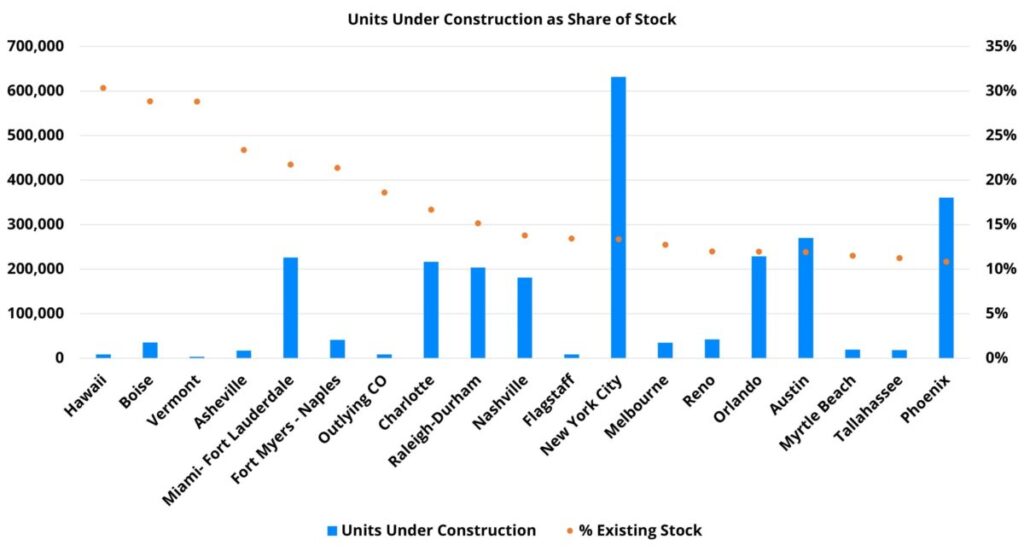
The current national market leaders in this metric present a mix of those two categories. Smaller markets or regions such as Hawaii, Boise, Vermont, and Asheville lead all markets with units under construction as a share of existing stock ranging from about 24% in Asheville to 30% in Hawaii. The outlying portion of Colorado, comprised of areas not assigned to a Metropolitan Statistical Area (MSA) by the Census Bureau, currently has about 1,630 units under construction that equal about 19% of existing stock. Fort Myers – Naples also finds itself within the top ten markets with its roughly 8,900 units under construction totaling 21% of existing stock.
As already mentioned, there are some primary markets that crack the top ten in a metric that typically favors smaller markets. Units under construction in Miami – Fort Lauderdale, Charlotte, Raleigh – Durham, and Nashville represent anywhere from 14% of existing stock in Nashville to 22% of existing stock in Miami – Fort Lauderdale. For context, the national market average is currently 6% of existing stock.

Takeaways
More than 240,000 new units have been delivered across the country this year through May. In recent years, new supply has never even hit 200,000 units in the first five months of the year. This massive flow of new supply has put immense downward pressure on occupancy during a period in which net absorption has totaled only about 100,000 units.
As was highlighted in a blog post earlier this year, the Midwest region has outperformed in rent growth recently. This had more to do with less new supply than with dazzling apartment demand. This dynamic will probably continue through the rest of 2024 – markets that perform better on the rent front are likely to do so thanks to higher occupancy that is a result of less new supply pressure.
Markets that are likely to struggle more this year across the usual metrics like occupancy, rent change, and concession availability are those that have both a high number of lease-up units and a high number of units under construction. Markets with a high number of upcoming deliveries relative to their size can also be added to that group.
While demand has improved significantly on a percentage basis year-over-year, much ground remains to be made up – both in terms of returning to pre-pandemic levels of net absorption and attaining a level that could offset upcoming new supply. Unfortunately, monthly national net absorption tends to peak around June, and month-over-month progress seemed to stall in May at a time when a seasonal updraft should have continued propelling it higher. Markets still in the midst of a construction boom will likely have to look to 2025 or beyond for notable relief.

Stop by Booth 1806 at Apartmentalize to find out why thousands of multifamily professionals use ALN every single day to help their business and enter our drawing for brand new Louis Vuitton swag!
Disclaimer: All content and information within this article is for informational purposes only. ALN Apartment Data makes no representation as to the accuracy or completeness of any information in this or any other article posted on this site or found by following any link on this site. The owner will not be held liable for any losses, injuries, or damages from the display or use of this information. All content and information in this article may be shared provided a link to the article or website is included in the shared content.

